CNN Fear & Greed Sentiment Analysis 2026-10-03
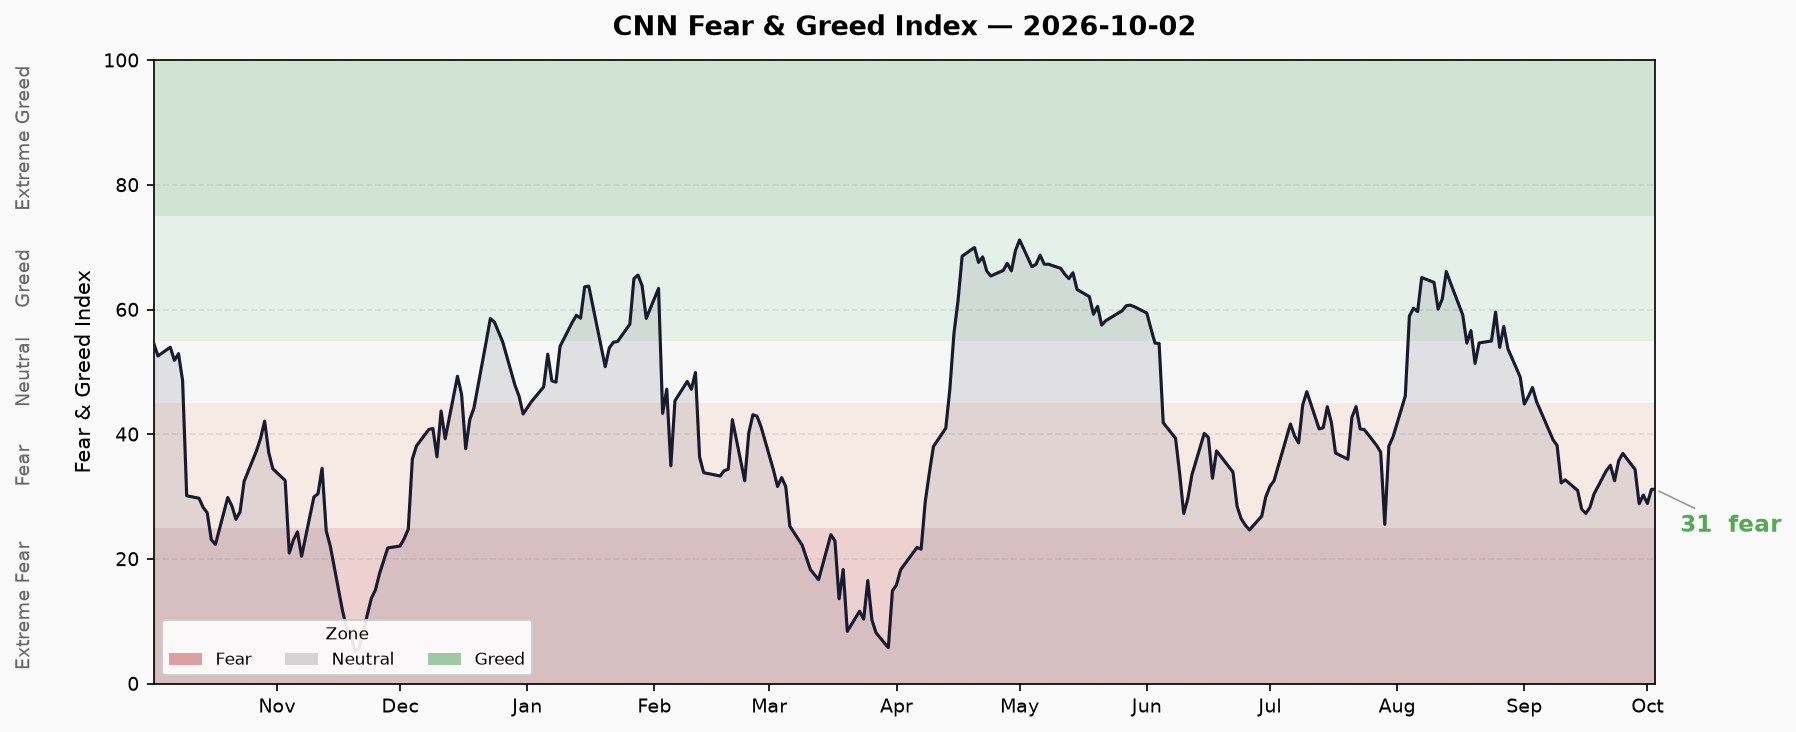
CNN Fear & Greed data pull and cross-validation run on 2026-10-03 CST. Latest data as of 2026-10-02 (US close), composite index 31.2 (Fear), up +3.1 from prior session 28.1. 20 consecutive fear days, sample low 5.2 (2025-11-20). Four of nine sub-indicators in Fear/Extreme Fear. HY credit spreads in alert zone, yield curve normal-flat, margin debt and ETF flows at historical highs.
Data Cutoff and Update Status
| Data Source | As Of | Updated |
|---|---|---|
| CNN F&G Composite | 2026-10-02 (US close) | ✅ Latest |
| Seven Sub-Indicators | 2026-10-02 | ✅ Latest |
| FRED Credit Spreads / Yields | 2026-10-01 | ✅ Latest |
| Margin Debt | 2026-04 (FINRA monthly) | ⚠️ Monthly lag |
| IPO / ETF Flows | 2026 YTD | ⚠️ YTD cumulative |
Changes Since Last Update and Persistent Signals
Composite retracts from session low, but fear regime holds. 10/2 close at 31.2, up +3.1 from 10/1’s 28.9 (+11%), the first positive daily change in 20 consecutive fear/extreme fear sessions. However:
- Past 10 trading days: 35.0 → 31.2, trend -3.8
- Past 1 month: 46.1 → 31.2, notable deterioration
- 20 consecutive fear days — among the longest fear streaks in the sample
Persistent from last report: Sub-indicator ratings unchanged. Credit spreads hold in alert zone. Yield curve normal-flat.
Composite Index Trend
Current: 31.2 — Fear
Last 10 trading days:
| Date | Score | Rating |
|---|---|---|
| 09-22 | 35.03 | Fear |
| 09-23 | 32.54 | Fear |
| 09-24 | 35.74 | Fear |
| 09-25 | 36.94 | Fear |
| 09-28 | 34.37 | Fear |
| 09-29 | 28.86 | Fear |
| 09-30 | 30.26 | Fear |
| 10-01 | 28.91 | Fear |
| 10-02 | 31.17 | Fear |
Trend characteristics:
- Sample minimum: 5.17 (2025-11-20, Extreme Fear)
- Sample maximum: ~71.2 (2026-06, Greed)
- Current position: approximately 15th percentile of sample
- 20 consecutive fear days; brief rebounds failed to break 40
Seven Sub-Indicators
| Indicator | Score | Rating | Raw Value | Unit | As Of | Daily Change |
|---|---|---|---|---|---|---|
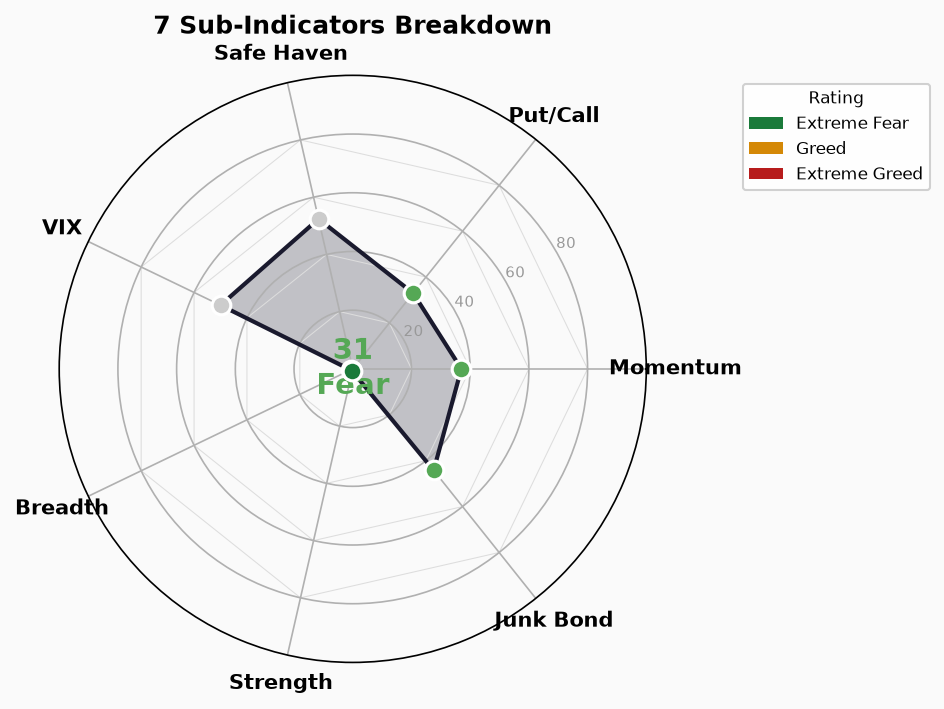
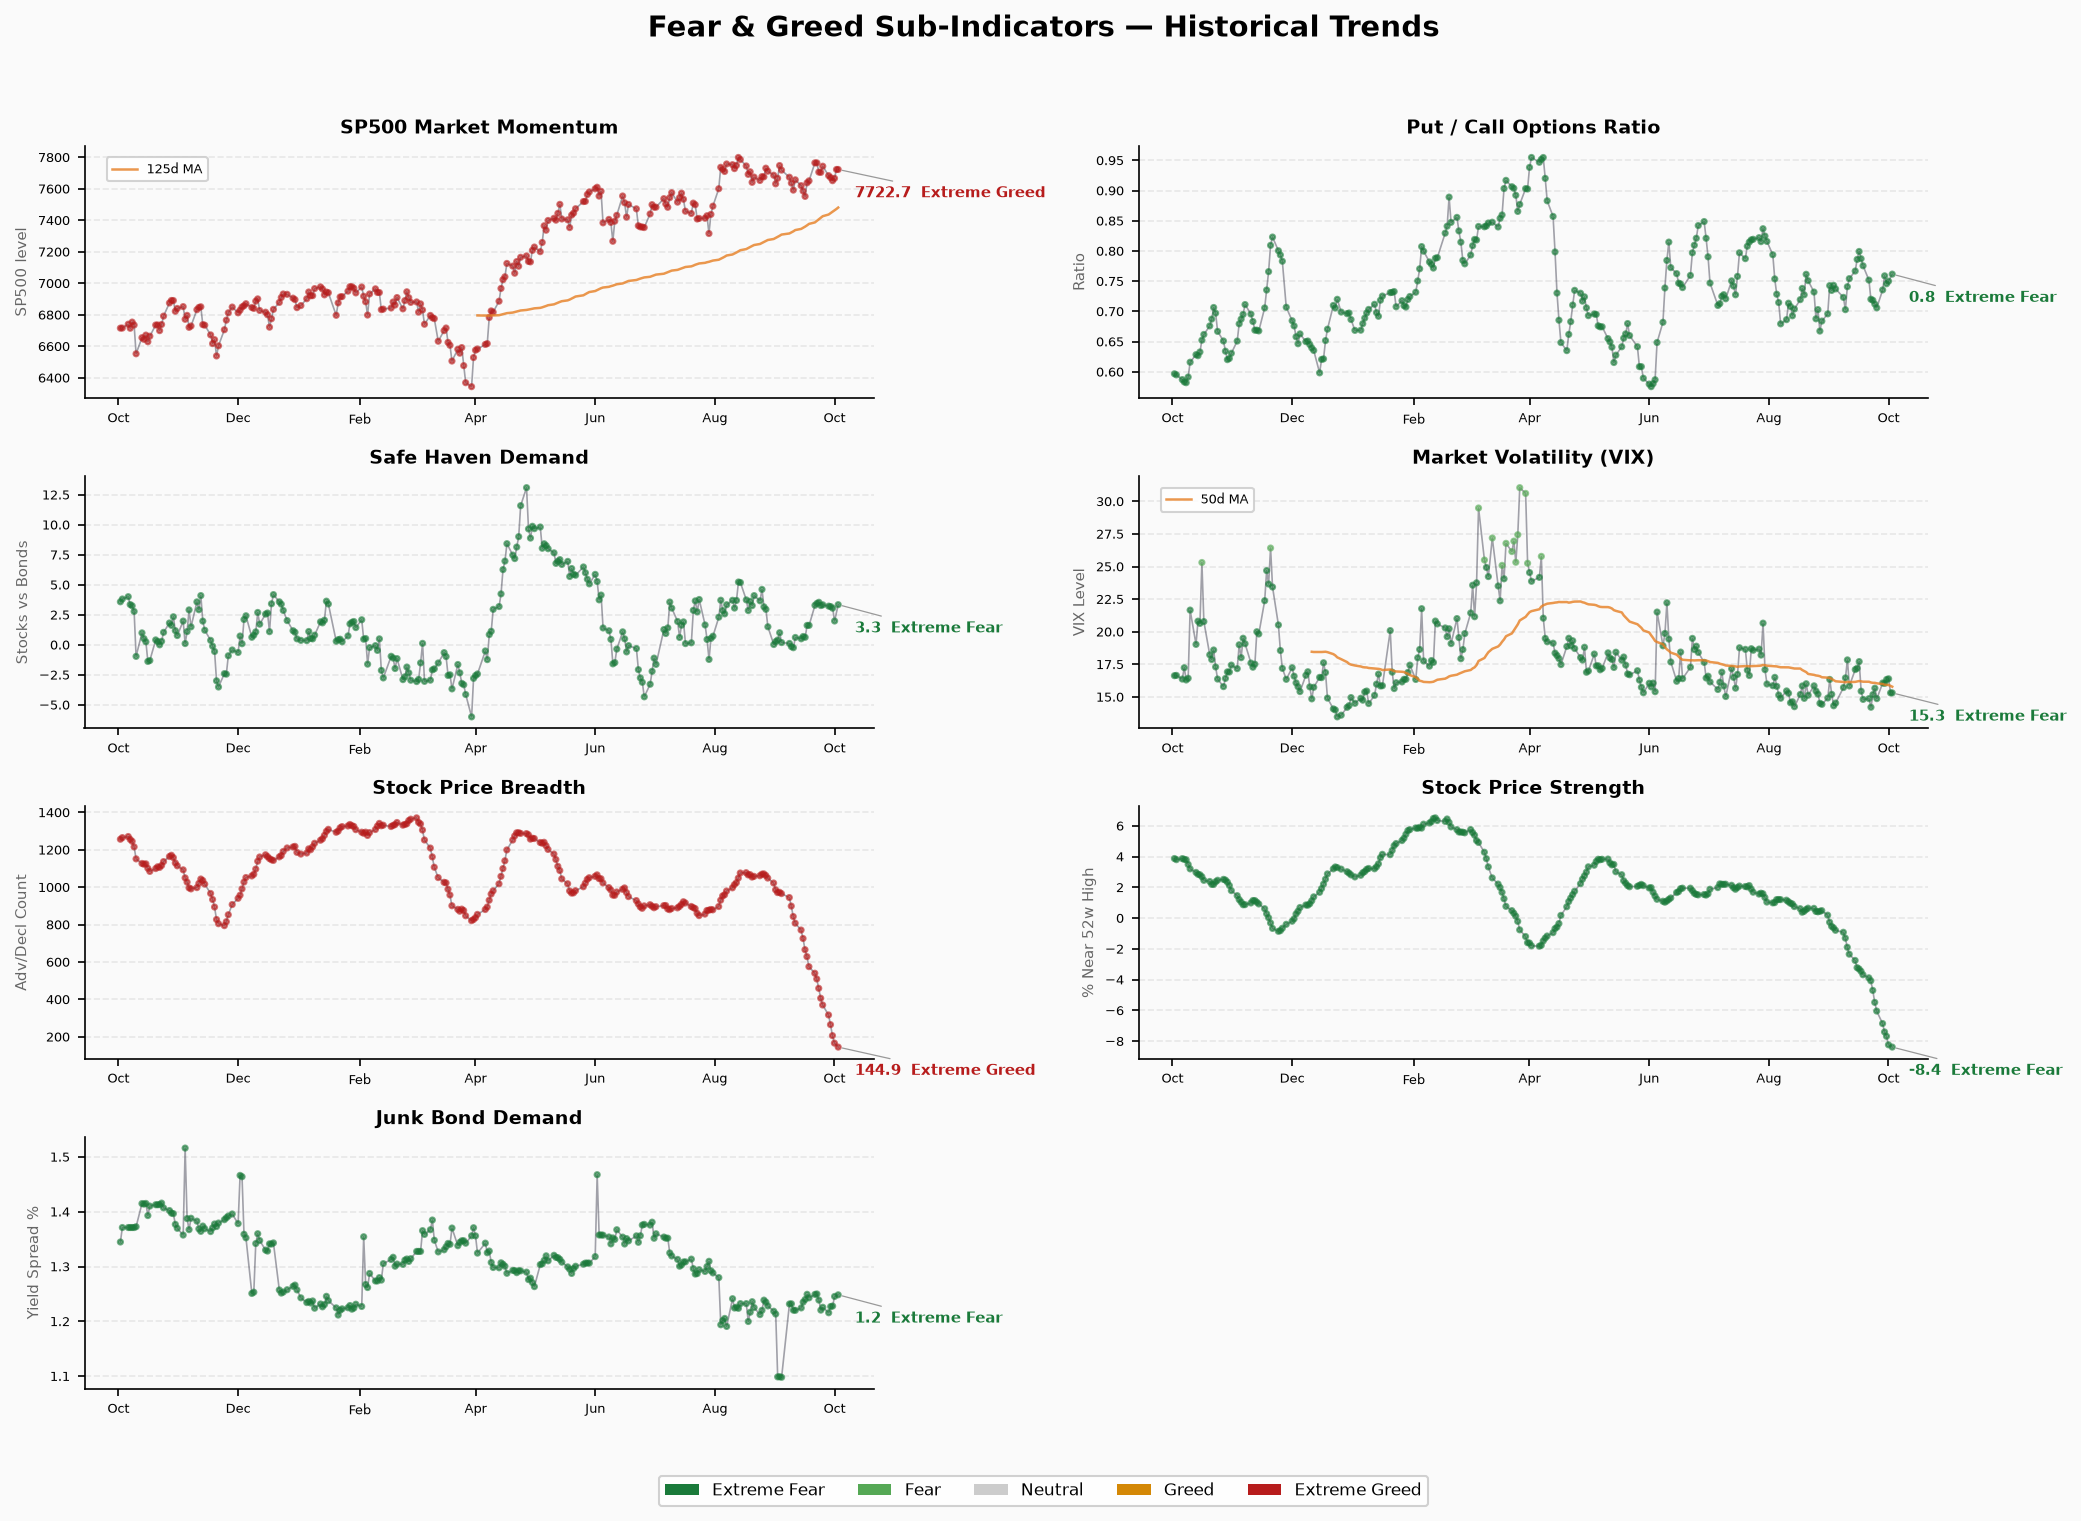
| Market Momentum S&P 500 | 37 | Fear | 7,722.72 | Index level | 2026-10-02 | Carried forward |
| Market Momentum S&P 125 | 37 | Fear | 7,472.03 | Index level | 2026-10-02 | Carried forward |
| Stock Price Strength | — | Extreme Fear | -8.38 | % change | 2026-10-02 | Carried forward |
| Stock Price Breadth | — | Extreme Greed | 144.91 | Advancing issues | 2026-10-02 | Carried forward |
| Put/Call Options | 33 | Fear | 0.76 | PCR ratio | 2026-10-02 | Carried forward |
| VIX (S&P 500) | 50 | Neutral | 15.31 | Index value | 2026-10-02 | Carried forward |
| VIX 50-day Percentile | 50 | Neutral | 15.85 | VIX value | 2026-10-02 | Carried forward |
| Junk Bond Demand | 44 | Fear | 1.25 | HY OAS | 2026-10-01 | Carried forward |
| Safe Haven Demand | 52 | Neutral | 3.34 | Gold change | 2026-10-02 | Carried forward |
Notes:
- Price Strength and Price Breadth do not output numeric scores in the script (the Score column shows indicator weight). Raw values extracted from the last data point in sub-indicator series.
- VIX 15.31 sits in the Neutral band (script score 50), but VIX 50-day Percentile raw value 15.85 is labeled Extreme Fear by the script’s internal threshold logic — raw value provided for verification.
- Daily change marked “Carried forward” since the latest trading day is 10/2, identical to the previous report’s data date — no new trading session update.
Indicator Divergences: Possible Explanations and Counter-evidence
1. Breadth (Extreme Greed) vs Strength (Extreme Fear) — Classic Divergence
Breadth raw value 144.91 shows significantly more advancing than declining issues, yet Price Strength -8.38% reveals declining stocks fell far more than advancing stocks rose. This is the classic “few mega-caps dragging,多数 mid/small caps stable” structure.
- Counter-evidence: In systemic risk, Breadth should turn green synchronously. The divergence suggests risk concentrated in specific sectors/weights.
- Requires verification: SPX top-20 weight performance vs. bottom-480 separation data.
2. VIX Neutral vs Composite Fear — Volatility Not Following
VIX at 15.31 is in the neutral band, meaning options-implied volatility has not joined the fear reading. This conflicts with Price Strength and Put/Call (PCR 0.76 leaning fear).
- Possible explanation: VIX may be under-pricing tail risk, or the options market reads short-term mean reversion.
- Counter-evidence: If VIX stays flat while equities decline further, hedging demand may be concentrated in OTM puts (which don’t drive VIX as aggressively).
3. Safe Haven Neutral vs Junk Bond Fear — Risk-Off via Credit, Not Gold
Safe Haven (gold-related) scores 52.4 Neutral — no significant gold bid. Yet Junk Bond sits in Fear. Risk aversion is expressing through credit markets rather than traditional safe-haven assets.
Credit / Rates / Leverage Cross-Validation
| Macro Indicator | Value | Status | As Of |
|---|---|---|---|
| HY OAS (High Yield Spread) | 3.24% | 🟡 Alert Zone | 2026-10-01 |
| IG OAS (Investment Grade) | 0.86% | 🟢 Normal | 2026-10-01 |
| 10Y-2Y Spread | 0.45% | 🟢 Normal, flat | 2026-10-01 |
| 10Y Yield | 5.24% | — | 2026-10-01 |
| 2Y Yield | 4.78% | — | 2026-10-01 |
| 30Y Yield | 5.61% | — | 2026-10-01 |
| 10Y-30Y Spread | -0.37% | Inverted (long end) | 2026-10-01 |
| Margin Debt | $1.304T | 🔴 Historical high range | 2026-04 |
| IPOs (2026 YTD) | ~73 | 🔴 Active | 2026 YTD |
| ETF Net Inflows (2026 YTD) | $8,560B | 🔴 Record | 2026 YTD |
Cross-validation conclusion:
- Credit markets cautious: HY OAS at 3.24% just crossed the 3% alert threshold, pricing tail risk in high-yield. IG OAS at 0.86% remains healthy — risk concentrated in lower ratings.
- Yield curve mixed: 10Y-2Y at +45bp shows no short-end inversion panic, but 10Y-30Y at -37bp suggests long-end term premium compression, possibly tied to supply concerns or insufficient long-duration demand.
- Leverage risk persists: Margin debt at $1.304T near historical highs (April 2026 data). In a 20-day fear environment, margin-call pressure on highly leveraged accounts is a potential accelerator.
- Record fund inflows: YTD ETF net inflows of $8,560B at all-time high, IPO market active. This is liquidity support but could become liquidity withdrawal if market sentiment shifts.
Conditions for Risk Escalation or De-escalation
Signals to watch for risk escalation:
- HY OAS breaks 5% → enters panic zone
- Margin debt shows material decline (margin call cascade)
- VIX breaks 20 with PCR persistently > 1.0
- Price Strength and Breadth turn green together (divergence becomes systemic)
- 10Y-2Y turns negative with 10Y rising fast (equity-bond selloff)
Signals to watch for risk de-escalation:
- F&G composite closes above 40 for 3 consecutive days
- Price Strength turns positive (declining stocks’ downside compresses)
- HY OAS falls back below 3%
- VIX drops below 15 with Put/Call PCR below 0.6
Data Limitations
- Margin Debt from FINRA, monthly release, latest April 2026 — cannot reflect May-September changes.
- IPO/ETF Flows are YTD cumulative; marginal change in the most recent month is not visible.
- Sub-indicator raw values (Strength/Breadth) extracted from the script’s internal data last point, not from official CNN raw source, not cross-validated with a third party.
- VIX rating internal conflict: VIX=15.31 sits in the script’s Neutral band, but VIX 50-day Percentile rating reads Extreme Fear — due to the script’s different internal thresholds, not a data error.
- CNN raw seven indicators: Price Strength and Price Breadth do not output 0-100 scores; the script’s Score (0.8) is weight allocation, not a percentile figure.