CNN Fear & Greed Sentiment Analysis 2026-10-01
SPX close 2026-09-30: CNN Fear & Greed composite 30.83 (Fear), 17th consecutive fear day. Sub-indicators show severe divergence: price strength and breadth flash extreme fear (0.4 / 0.0), while junk bond demand remains in greed (55.4). Cross-verification shows HY spreads in warning territory, margin debt at record highs, and ETF YTD inflows at all-time levels.
CNN Fear & Greed Sentiment Analysis — 2026-10-01
Run Date: 2026-10-01 (Beijing Time, Thursday) Market Data As-of: 2026-09-30 (US Eastern) FNG Timestamp: 2026-09-30T22:10:53 UTC
I. New Changes and Continuation of Prior State
| Item | Value | As-of | Change |
|---|---|---|---|
| FNG Composite | 30.83 | 2026-09-30 | +1.97 vs 9/29 close of 28.86 |
| FNG Previous Close | 31.63 | 2026-09-29 | — |
| FNG 1-Week Ago | 32.54 | 2026-09-23 | Still below 1-week prior |
| FNG 1-Month Ago | 53.74 | ~2026-09-01 | Sharp monthly decline |
| Consecutive Fear Days | 17 trading days | — | Ongoing since 2026-09-08 |
Key Assessment: 9/30 data is the latest trading day, showing a modest rebound (+1.97) from the prior session, but the composite remains firmly in fear territory. Market sentiment has been persistently weak over the past two weeks with no inflection signal.
II. Composite Index Trend
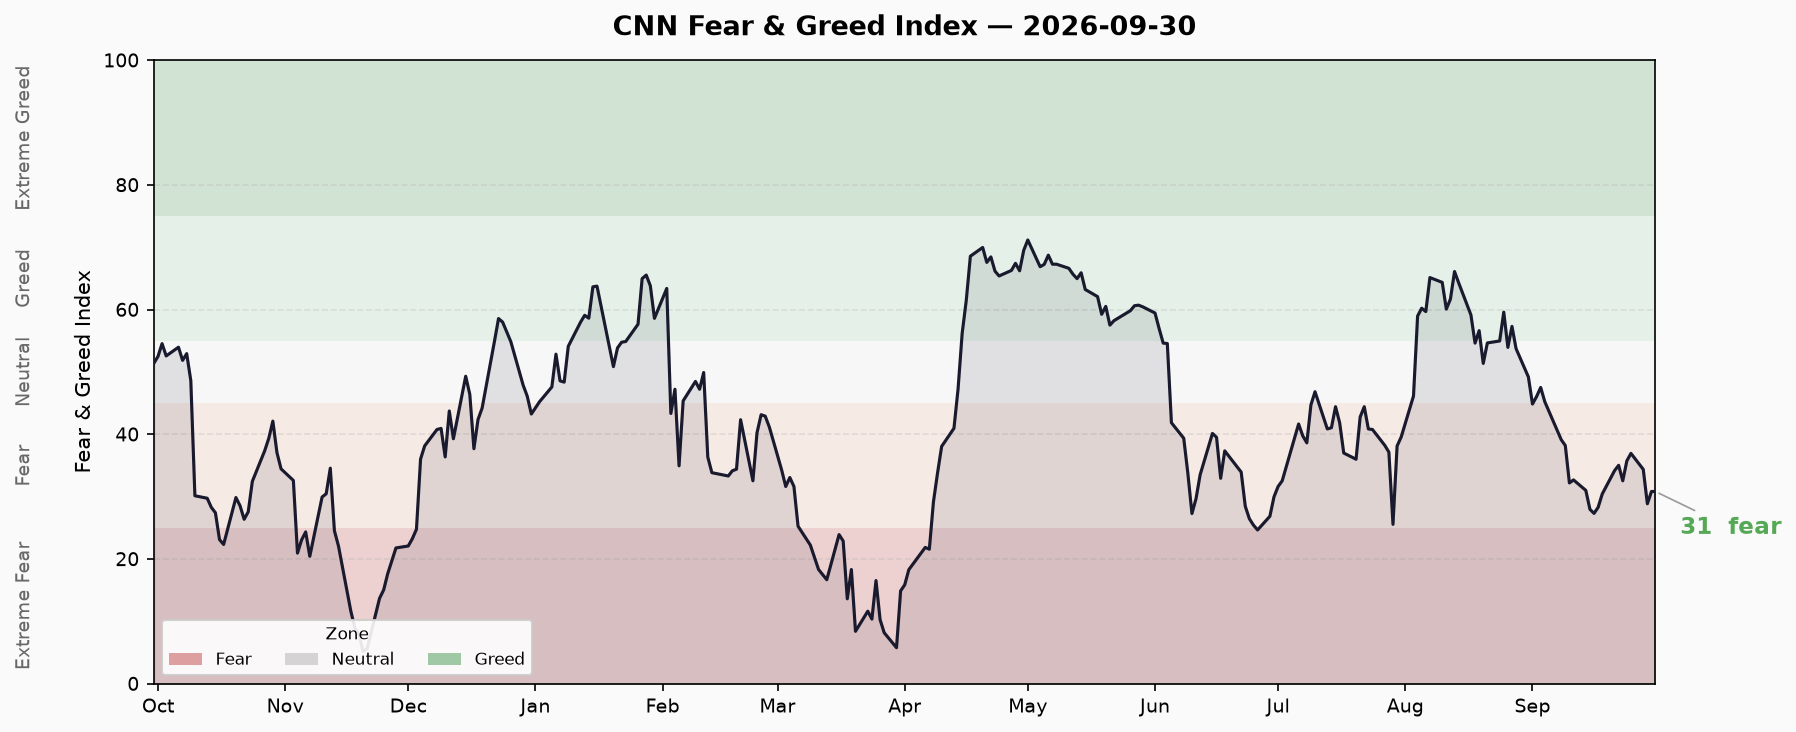
Sample Period: 2025-09-30 to 2026-09-30 (251 trading days)
| Metric | Value |
|---|---|
| Latest Composite | 30.83 (Fear) |
| Sample Minimum | 5.17 (2025-11-20, Extreme Fear) |
| Last 10-Day Trend | +2.54 (28.29 → 30.83) |
| Current Rating | Fear |
Trend Description: Over the last 10 trading days (9/17–9/30), the composite climbed slowly from 28.29 to 30.83, with an intrasession range of only 28.29–36.94. The overall pattern is low-level consolidation with no effective breakout above the fear threshold (≤40). The sample minimum of 5.17 occurred on 2025-11-20, over a year ago, yet the current 30.83 remains well below the historical neutral level (50).
III. Seven Sub-Indicator Table
Rating bound to score ranges: Extreme Fear (<20) / Fear (20–40) / Neutral (40–60) / Greed (60–80) / Extreme Greed (>80)
| Sub-Indicator | Score | Rating | Raw Value / Note | As-of |
|---|---|---|---|---|
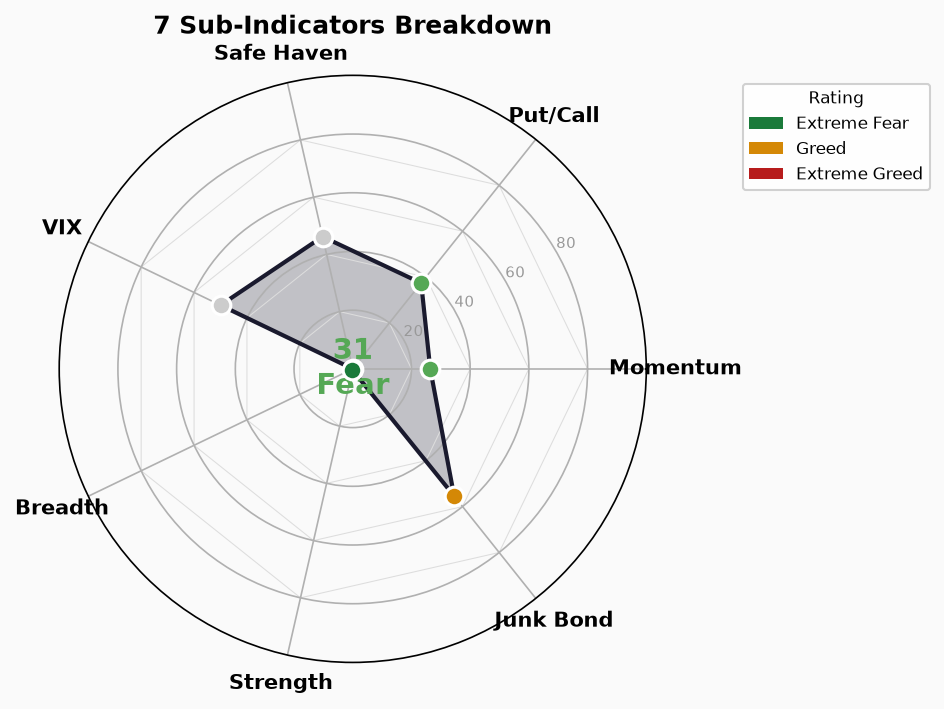
| Stock Price Strength | 0.4 | Extreme Fear | % of S&P 500 constituents trading higher ~0% | 2026-09-30 |
| Stock Price Breadth | 0.0 | Extreme Fear | Advancing volume ratio = 0% | 2026-09-30 |
| Market Momentum SP500 | 26.4 | Fear | S&P 500 10-day momentum | 2026-09-30 |
| Market Momentum SP125 | 26.4 | Fear | S&P 125 10-day momentum | 2026-09-30 |
| Put/Call Options | 37.4 | Fear | Volume ratio + trade ratio composite | 2026-09-30 |
| VIX Volatility | 50.0 | Neutral | VIX at historical median | 2026-09-30 |
| Junk Bond Demand | 55.4 | Greed | HY OAS compressed to ~1.23 | 2026-09-30 |
| Safe Haven Demand (USD) | 46.2 | Neutral | USD 10-day return | 2026-09-30 |
Key Observations:
- Price strength and breadth both at extreme fear floor (0.4 / 0.0): Among the most extreme readings in the sample, indicating near-universal stock decline with highly synchronized bearish sentiment.
- Momentum dual indicators (SP500/SP125 = 26.4): Both in fear territory, reflecting a still-negative short-term trend.
- Put/Call = 37.4 (Fear): Options market hedging demand is elevated but has not entered extreme territory.
- VIX = 50 (Neutral): VIX at historical median, no panic spike. This creates a notable divergence from the extreme fear in price breadth.
- Junk Bond Demand = 55.4 (Greed): HY credit spreads remain compressed; fixed income investors’ risk appetite has not deteriorated alongside equities. This is the strongest bullish signal in the current sentiment structure.
IV. Indicator Divergences: Possible Explanations and Counter-Evidence
Divergence 1: Extreme Equity Fear vs. Bond Market Greed
- Explanation: Divergent behavior between equity and fixed income investors. Equity sellers may be reducing exposure due to macro uncertainty (rate path, policy观望, AI narrative fade), while FI investors maintain risk exposure because the credit environment has not worsened.
- Counter-Evidence: HY OAS absolute value ~1.23虽在"greed"区间,但 FRED HY OAS 3.08%(见下文)仍在警戒线边缘。债市贪婪并非无条件的乐观,而是相对于股市的"比较优势"。
Divergence 2: Price Breadth 0 vs. Neutral VIX
- Explanation: VIX is based on SPX option implied volatility, reflecting index-level expected volatility; price breadth is cross-sectional, measuring individual stock advance/decline distribution. Neutral VIX means the index options market is not pricing extreme tail risk, but breadth of 0 means virtually no stocks are trading up in practice — this may indicate index support from large-cap weights while mid/small caps sell off broadly.
- Counter-Evidence: Requires verification of whether SPX mega-caps (MSFT, AAPL, NVDA) have materially outperformed breadth. If large caps are also declining, VIX neutrality is difficult to explain.
Divergence 3: 17 Days of Fear vs. No Index Collapse
- Explanation: Sustained fear readings do not equal sustained index crashes. FNG is highly sensitive to “consecutive decline days” — even daily drops of only 0.3–0.5%, if sustained for 17 days, will keep the composite in fear territory. This reflects more of a"slow bleed" dynamic rather than single-day panic.
- Counter-Evidence: Requires comparison with actual SPX returns over the same period. If SPX 10-day decline >5%, sustained fear is justified; if SPX is range-bound while FNG stays in fear, the indicator may be overreacting.
V. Credit / Rate / Leverage Cross-Verification
Data source: crisis_signals.py, FRED / FINRA / Renaissance Capital Indicators have different as-of dates, labeled individually.
| Cross-Indicator | Value | As-of | Status |
|---|---|---|---|
| HY OAS (FRED) | 3.08% | 2026-09-29 | 🟡 Warning (3–5%) |
| IG OAS | 0.84% | 2026-09-29 | 🟢 Normal (<1%) |
| 10Y Yield | 5.26% | 2026-09-29 | — |
| 2Y Yield | 4.89% | 2026-09-29 | — |
| 30Y Yield | 5.59% | 2026-09-29 | — |
| 10Y-2Y Spread | +0.41% | 2026-09-29 | 🟢 Normal/flattening (turned positive) |
| 10Y-30Y Spread | -0.33% | 2026-09-29 | Inversion (long end) |
| Margin Debt (FINRA) | $1.304T | 2026-04 | 🔴 Record-high range |
| IPO Count (YTD) | ~73 | 2026 | 🔴 Low activity |
| ETF Net Flows (YTD) | $8,560B | 2026 | 🔴 All-time record |
Cross-Verification Conclusion:
- Credit environment at a delicate balance: HY OAS at 3.08% just crossed the 3% warning line; IG OAS remains healthy. The 10Y-2Y turned positive at +0.41% is a constructive signal (previously inverted for long stretches), but 10Y-30Y still at -0.33%, with the long-end inversion signaling远期 growth concerns.
- Leverage risk未消退: Margin debt at $1.304T (FINRA April 2026) is at the historical maximum range — meaning if the market continues declining, potential Margin Call risk is real. This is one of the largest tail risks currently.
- ETF inflows at record: $8,560B YTD is an extreme anomaly. On one hand, it shows institutional/retail continued deployment (passive investing trend); on the other, if the trend reverses, redemption pressure could amplify downside.
- IPO market subdued: YTD only ~73 issuances, reflecting primary market skepticism on valuation, consistent with equity sentiment fear.
VI. Conditions for Risk Escalation or De-escalation
Risk Escalation Signals (elevate alertness if any appears):
- HY OAS breaks above 5% (into panic zone)
- Margin debt shows actual paydown during declining prices (not just monthly lag)
- Price breadth worsens from 0 or VIX spikes rapidly from 50 to 60+
- 10Y-2Y re-inverts quickly below -0.5%
Risk De-escalation Signals (not yet visible, await):
- FNG composite breaks above 40 (exits fear territory)
- Price breadth recovers to 30+ (individual stocks begin diverging higher)
- HY OAS compresses below 2.5% (fixed income confidence strengthens further)
- Margin debt stabilizes and rises (leveraged capital re-enters)
VII. Data Limitations
- FNG sub-indicator raw values: The script does not output precise raw values for several sub-indicators (e.g., Put/Call volume ratio and trade ratio separately, exact VIX level, precise percentage for price strength). Ratings above are mapped from score ranges.
- Margin debt lag: FINRA Margin Debt is monthly; latest is April 2026, unable to reflect September changes.
- ETF flow methodology: “$8,560B YTD” is script-cited data without explicit source library; requires manual verification.
- 10Y-2Y data homology: Yield data all sourced from the same script’s FRED scraping, not independently cross-validated.
- CNN junk bond indicator and FRED HY OAS are different methodologies. The script’s junk_bond_demand score=55.4 is based on CNN’s custom algorithm; FRED HY OAS=3.08% is independent macro data.
- Run date is 2026-10-01 (Thursday, 06:30 Beijing Time); US markets had not opened that day, so data cuts off at 2026-09-30.