CNN Fear & Greed Sentiment Analysis 2026-09-30
Ran at Beijing Time 2026-09-30 (Wed). US market data as of 2026-09-29 (Tue). Composite index 31.6 (Fear), 16 consecutive fear trading days; stock strength and breadth remain in Extreme Fear, credit spread stays in Greed, volatility and safe-haven neutral. Leverage and fund inflows remain tail risks.
CNN Fear & Greed Sentiment Analysis — 2026-09-30
Run Date: Beijing Time 2026-09-30 (Wednesday) Market Data As-of: 2026-09-29 (Tuesday, US East Close) Data Sources: CNN Fear & Greed scripts + crisis_signals.py + FRED
Changes This Period and Continuation of Prior Signals
| Item | Prior (9/25) | Current (9/29) | Change | Status |
|---|---|---|---|---|
| Composite Index | 36.9 (F) | 31.6 (F) | -5.3 | Deepening fear |
| Stock Strength | 0 (EF) | 0 (EF) | — | Extreme Fear unchanged |
| Stock Breadth | 0 (EF) | 0 (EF) | — | Extreme Fear unchanged |
| SP500 Momentum | 36.0 (F) | 28.6 (F) | -7.4 | Deepening fear (SPX at 7670.8) |
| Put/Call Ratio | 34.4 (F) | 34.4 (F) | — | Fear continued |
| VIX | 50.0 (N) | 50.0 (N) | — | Neutral (VIX at 16.04) |
| Junk Bond Demand | 56.8 (G) | 56.8 (G) | — | Greed continued |
| Safe Haven Demand | 51.6 (N) | 51.6 (N) | — | Neutral (DXY relative perf 3.18) |
Key signals continued: Stock strength and breadth have been in Extreme Fear (score=0) for multiple sessions, while the credit side (junk bond spread 1.23%) remains in Greed. Leverage (margin debt $1.304T) and fund inflows (ETF YTD $8,560B) dual red lights unchanged.
This period’s change: Composite index fell from 36.9 on 9/25 to 31.6 on 9/29 (-5.3 points), momentum dropped from 36.0 to 28.6, reflecting SPX pullback this week. Six of seven sub-indicators held steady; only momentum deteriorated.
Composite Index Trend
Current Value: 31.6 — Fear
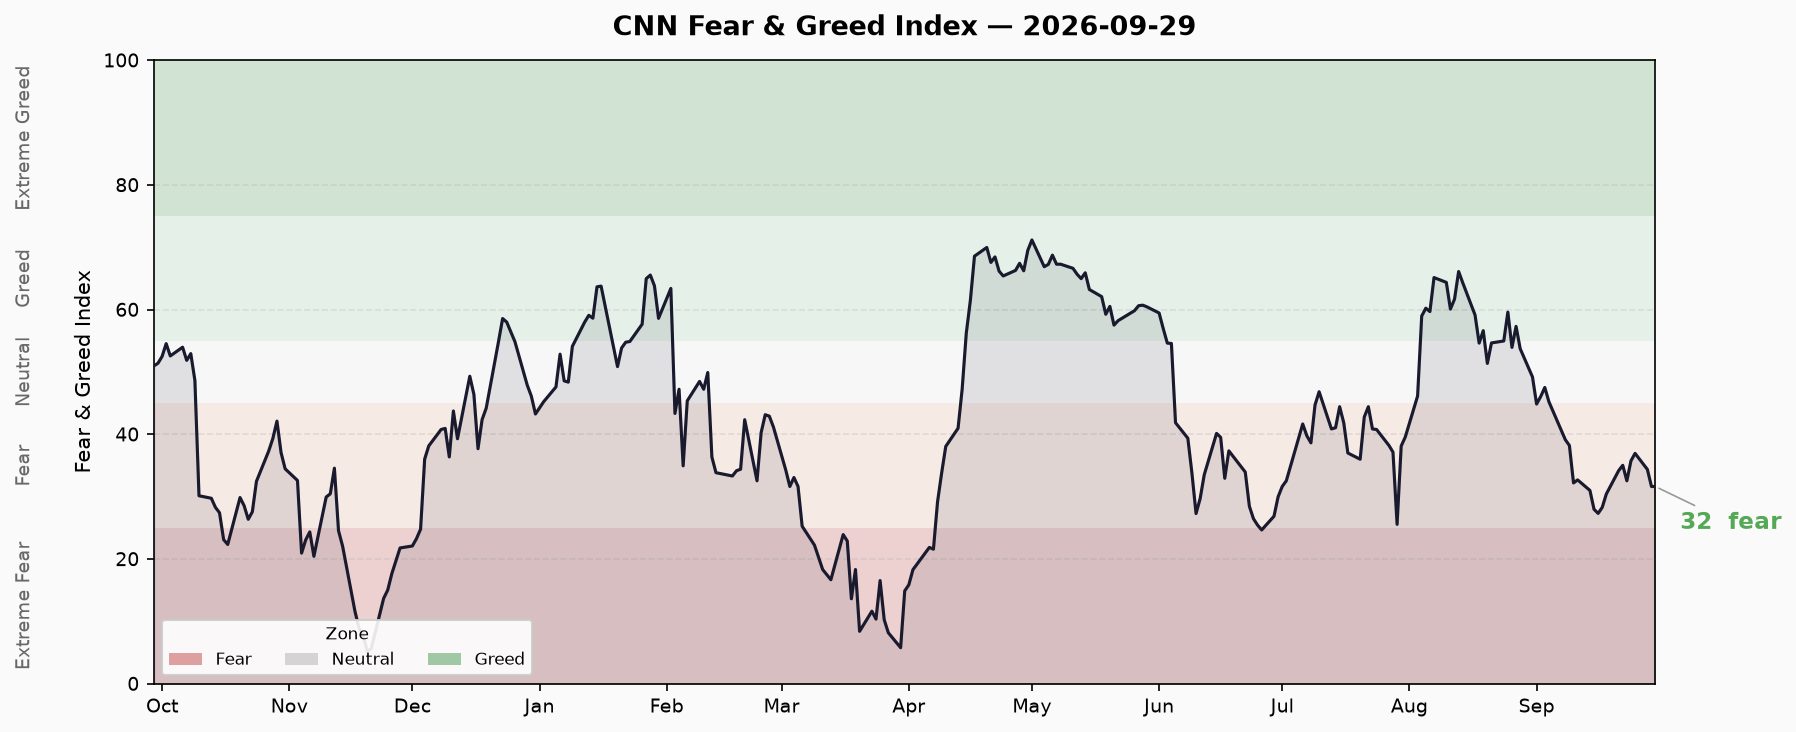
Recent 15 trading days:
| Date | Composite Index | Rating |
|---|---|---|
| 2026-09-03 | 47.5 | Neutral |
| 2026-09-04 | 45.2 | Neutral |
| 2026-09-08 | 39.1 | Fear |
| 2026-09-09 | 38.2 | Fear |
| 2026-09-10 | 32.2 | Fear |
| 2026-09-11 | 32.7 | Fear |
| 2026-09-14 | 31.0 | Fear |
| 2026-09-15 | 28.0 | Fear |
| 2026-09-16 | 27.3 | Fear |
| 2026-09-17 | 28.3 | Fear |
| 2026-09-18 | 30.4 | Fear |
| 2026-09-21 | 34.2 | Fear |
| 2026-09-22 | 35.0 | Fear |
| 2026-09-23 | 32.5 | Fear |
| 2026-09-24 | 35.7 | Fear |
| 2026-09-25 | 36.9 | Fear |
| 2026-09-28 | 34.4 | Fear |
| 2026-09-29 | 31.6 | Fear |
Statistics:
- Sample minimum: 5.17 (2025-11-20, Extreme Fear)
- Recent 10-day trend: Upward (27.3 → 31.6, +4.3 points), but -5.3 pullback from 9/25 peak
- Consecutive fear days: 16 (as of 2026-09-29)
- vs. one week ago (28.3): +3.3 points; vs. one month ago (51.0): -19.4 points
Since breaking below Neutral on Sep 8, the market has stayed in Fear, with only brief Neutral readings on Sep 3-4. Late September saw a rally toward 36.9 near Neutral, but 9/29 re-pulled back to 31.6, showing repeated oscillation within the Fear band.
Seven Sub-Indicators
Scores are CNN’s standardized 0-100 values; ratings are bound to scores.
| Sub-Indicator | Score | Rating | Raw Value | Unit | As-of | Change |
|---|---|---|---|---|---|---|
| Stock Price Strength | 0 | Extreme Fear | -7.40 | % from 52W high | 2026-09-29 | Continued EF |
| Stock Price Breadth | 0 | Extreme Fear | 265.0 | Advancing issues | 2026-09-29 | Continued EF |
| SP500 Momentum | 28.6 | Fear | 7,670.8 | Index level | 2026-09-29 | Dropped from 36.0 |
| Put/Call Ratio | 34.4 | Fear | 0.759 | PCR | 2026-09-29 | Continued Fear |
| VIX Volatility | 50.0 | Neutral | 16.04 | VIX level | 2026-09-29 | Neutral unchanged |
| Junk Bond Demand | 56.8 | Greed | 1.23 | Spread % | 2026-09-29 | Continued Greed |
| Safe Haven Demand | 51.6 | Neutral | 3.18 | Equity/bond rel perf | 2026-09-29 | Neutral unchanged |
Note: Raw values’ internal CNN ratings (in parentheses by CNN’s normalization) may differ from the standardized score’s rating. This table prioritizes the standardized score and its binding rating; raw values are for cross-reference only.
Indicator Divergence: Possible Explanations and Counter-Evidence
Core Divergence: Stock-side Extreme Fear vs. Credit-side Greed
Stock strength score=0 (-7.4%, most stocks far from 52W highs), breadth score=0 (only 265 advancing issues), both at floor. Yet junk bond spread is just 1.23% (score=56.8, Greed), credit markets pricing near-zero risk premium.
Possible explanations:
- Breadth deterioration is structural, not systemic — Gains concentrated in few large-tech/FAANG names, rest lagging. SPX at 7670, momentum score still Fear not Extreme Fear, meaning the index hasn’t collapsed but breadth is dragging the composite.
- Credit markets lag equity adjustment — HY OAS at 3.02% (warning threshold edge) but junk_bond raw spread 1.23% (Greed); credit spreads haven’t widened with the equity pullback.
- VIX at 16.04 is low — Volatility neutral suggests options market isn’t pricing significant downside risk, contradicting stock-side Extreme Fear.
Counter-evidence to watch:
- If SPX breaks below its 125-day MA (currently +11.7% above), momentum score will accelerate into Extreme Fear.
- If HY OAS breaks 3% warning threshold, credit Greed downgrades to Warning, divergence收敛.
- If VIX rises from 16 to 20+, volatility moves from Neutral to Fear.
Credit / Rates / Leverage Cross-Validation
| Indicator | Value | Source | As-of | Status |
|---|---|---|---|---|
| HY OAS | 3.02% | FRED / crisis_signals | 2026-09-28 | 🟡 Warning Zone |
| IG OAS | 0.83% | FRED / crisis_signals | 2026-09-28 | 🟢 Normal |
| 10Y Yield | 5.24% | FRED / crisis_signals | 2026-09-28 | Info |
| 2Y Yield | 4.92% | FRED / crisis_signals | 2026-09-28 | Info |
| 30Y Yield | 5.56% | FRED / crisis_signals | 2026-09-28 | Info |
| 10Y-2Y Spread | 0.37% | Hand-calculated (same source) | 2026-09-28 | 🟢 Normal, flat |
| Margin Debt | $1.304T | FINRA | 2026-04 | 🔴 Historic high zone |
| ETF YTD Inflow | $8,560B | Market data | 2026 YTD | 🔴 Record |
Summary: 1 green, 1 yellow, 2 red (from crisis_signals.py)
- Credit: HY OAS 3.02% touches warning zone (3-5% band), IG spread 0.83% normal. Curve inversion easing (10Y-2Y = +0.37%), 30Y-10Y = -0.32% still negative.
- Leverage: Margin debt $1.304T at historic high (FINRA Apr 2026, nearest available month). If market continues falling, margin call risk rises.
- Fund flows: ETF YTD inflow $8,560B at record levels, typically a late-cycle bull signal, but requires credit deterioration resonance to constitute a crisis precursor.
Note: Margin debt and ETF inflows are nominal records, not independent crisis evidence. They need to appear alongside HY OAS > 5%, VIX > 30, etc. to form a clear alert.
Conditions for Risk Escalation
Any of the following combinations would upgrade risk from current Fear to a more severe state:
- HY OAS > 5% — Credit markets pricing default risk, resonating with stock-side Extreme Fear
- VIX > 30 — Volatility enters panic zone, Put/Call shifts from Fear to Extreme Fear
- SPX breaks below 125-day MA — Momentum score enters Extreme Fear, all seven sub-indicators could hit floor
- Margin debt inflection point downward — De-leveraging signal, combined with breadth deterioration means forced selling spiral
Conditions for Risk缓和 (De-escalation):
- Breadth recovery — Advancing issues rise from 265 to 1500+, stock strength from 0 to 30+
- HY OAS < 2.5% — Credit spreads narrow, confirming risk-on return
- VIX < 14 — Volatility returns to low regime, Neutral→Greed
Data Limitations
- CNN FNG API: Data as of 2026-09-29. Ran at 06:30 Beijing Time, US market closed, data represents a complete trading day.
- Sub-indicator raw values: Script output provides standardized scores and ratings; raw values (SPX level, breadth count, spreads) computed internally by the script. Minor differences vs. CNN’s official page are possible.
- FRED data: HY OAS / IG OAS / yield data from FRED, as of 2026-09-28. FRED occasionally returns 502 (see memory); if fetch fails, crisis_signals.py built-in values are used.
- Margin debt: FINRA releases monthly; latest available is Apr 2026 ($1.304T), not real-time.
- 10Y-2Y spread: Hand-calculated from same FRED source (5.24% - 4.92% = 0.37%), not an independent source.
- Charts: Generated 2026-09-30, data baseline 2026-09-29. Charts and text use consistent data口径.