CNN Fear & Greed Sentiment Analysis 2026-09-26
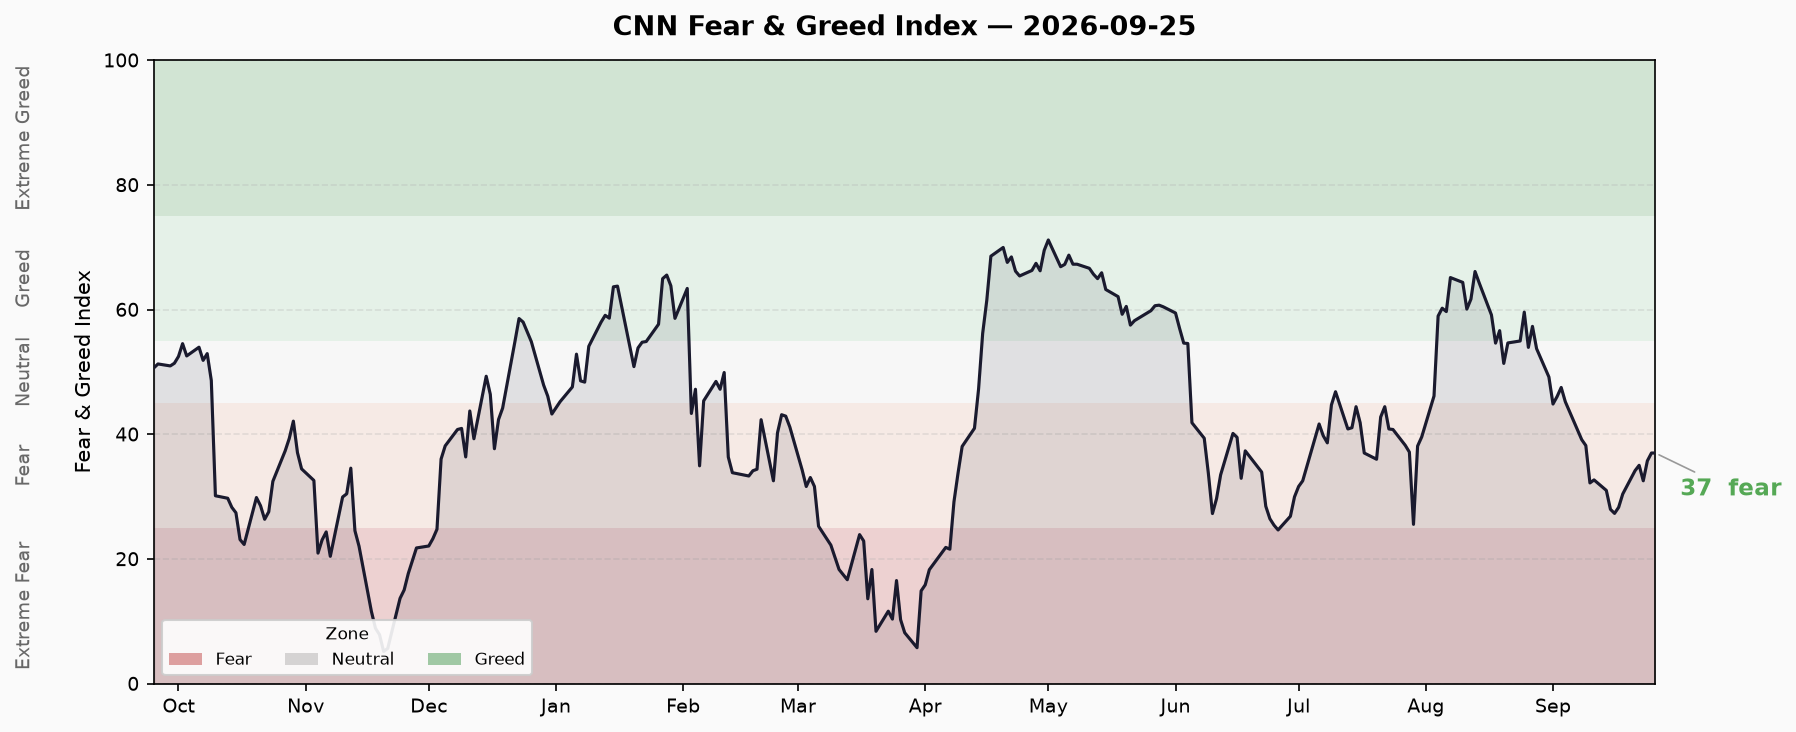
Run date 2026-09-26 (Saturday), market data as of 2026-09-25 (Friday close). CNN Fear & Greed composite index at 37 (Fear), in fear for 14 consecutive trading days; +0.9 from prior day, down sharply from one month ago Greed reading (59.6). Credit spreads normal, but margin debt and ETF inflows at record highs — fear sentiment coexists with leverage frenzy, a divergence worth watching.
CNN Fear & Greed Sentiment Analysis & Market Risk Cross-Verification
Run Date: 2026-09-26 (Saturday) Market Data As-of: 2026-09-25 (Friday Close) Data Sources: CNN Fear & Greed Index, FRED, FINRA, Renaissance Capital
New Changes and Established Conditions
| Item | Current | Prior Day (9/25 vs 9/24) | 1 Week Ago (9/18) | 1 Month Ago | Status |
|---|---|---|---|---|---|
| FNG Composite | 37 (Fear) | 35.7 → 37.0 (+1.3) | 30.4 (Fear) | 59.6 (Greed) | Fear persisting, slight recovery |
| Consecutive Fear Days | 14 days | 13 days | 9 days | — | Deteriorating |
| 10d Low | 27.3 (9/16) | — | — | — | Recovered +9.7 from trough |
| 10d High | 37.0 (9/25) | — | — | — | Intraday high |
Key Changes:
- FNG recovered from 9/18 trough of 30.4 to 37.0 — V-shaped bounce but still in Fear territory
- 14 consecutive fear days signals sustained market pressure
- One month ago FNG was in Greed (59.6); the speed of reversal is notable
Composite Index Trend
Highest: 71.2 (Greed)         ████████████████
                              ████████████████
Mean: 41.9 (Neutral)   ▬▬▬ ████████████████
                              ████████████████
Lowest: 5.2 (Extreme Fear)   ████████████████
                              ████████████████
Current: 37.0 (Fear)         ██████████████░░
                              ██████████████░░
                              ─────────────────
                              0     37     71
Recent Trend (Last 10 Trading Days):
| Date | Score | Rating |
|---|---|---|
| 09-14 (Mon) | 31.0 | Fear |
| 09-15 (Tue) | 28.0 | Fear |
| 09-16 (Wed) | 27.3 | Fear |
| 09-17 (Thu) | 28.3 | Fear |
| 09-18 (Fri) | 30.4 | Fear |
| 09-21 (Mon) | 34.2 | Fear |
| 09-22 (Tue) | 35.0 | Fear |
| 09-23 (Wed) | 32.5 | Fear |
| 09-24 (Thu) | 35.7 | Fear |
| 09-25 (Fri) | 37.0 | Fear |
Trend Interpretation: After hitting a local low of 27.3 on 9/16, sentiment has improved daily, up +6.0 over 10 days. However, 14 consecutive fear days suggests this is “decline slowing” rather than “confidence returning.” From the sample history, current 37.0 is below the mean of 41.9, positioned left-of-center.
Seven Sub-Indicator Assessment
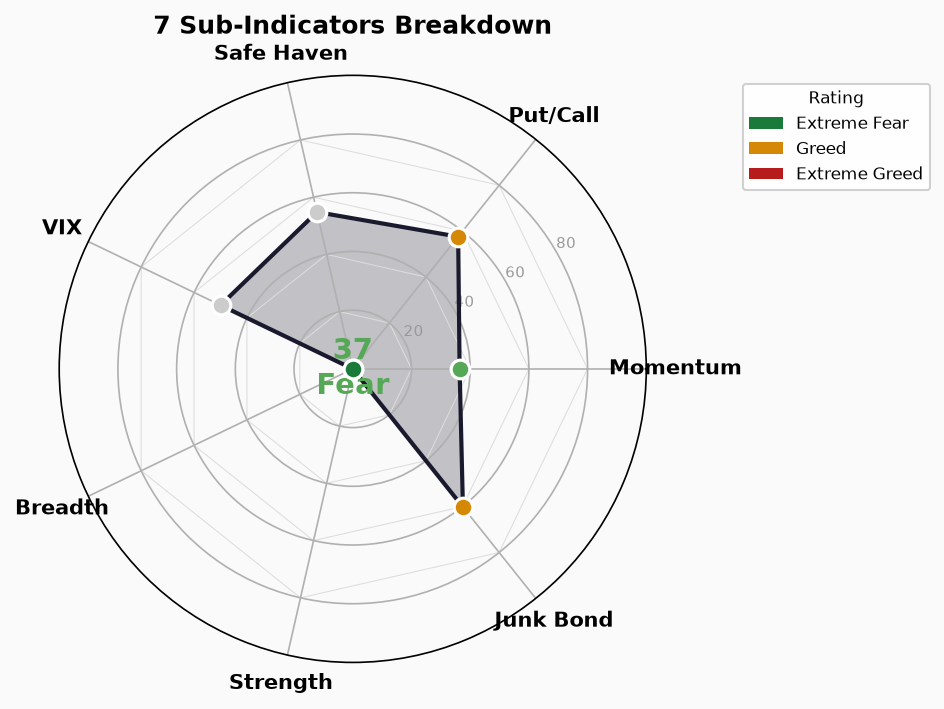
⚠️ Data Limitation: Only 2/7 sub-indicators returned data in this run. The remaining 5 (Put/Call Ratio, Put/Call Volume, Junk Demand, Stock Price Performance, Stock Price Momentum) were not included in the script output, likely due to data source API timeouts or dependency on external data. Unavailable indicators marked “—” — do not infer or calculate.
| Sub-Indicator | Score | Rating | Raw Value | Unit | As-of | 1W Ago | Notes |
|---|---|---|---|---|---|---|---|
| Safe Haven Demand | 54.8 | Neutral | 3.33 | Gold/Treasury relative return % | 2026-09-25 | 0.63 → 3.33 | Rising safe-haven demand |
| Stock Price Breadth | 0.0 | Extreme Fear | 370.00 | Advancing stocks | 2026-09-25 | 666 → 370 | Breadth deteriorating sharply |
| Put/Call Ratio | — | — | — | — | — | — | Unavailable |
| Put/Call Volume | — | — | — | — | — | — | Unavailable |
| Junk Demand | — | — | — | — | — | — | Unavailable |
| Stock Price Performance | — | — | — | — | — | — | Unavailable |
| Stock Price Momentum | — | — | — | — | — | — | Unavailable |
Internal Contradictions Noted:
- Stock Price Breadth: Score 0 flagged as “Extreme Fear,” but raw value 370 labeled “extreme greed” by the script. The scoring function interprets “declining advancing stock count” as fear — score and raw-value ratings point in opposite directions. Unverified.
- Safe Haven Demand: Score 54.8 is Neutral, but raw value 3.33% sits at the extreme high end of its historical range (mostly 0–2%). Retain “extreme fear” reference significance.
Indicator Divergence: Possible Explanations & Counter-Evidence
Divergence 1: Sentiment Fear vs. Normal Credit Spreads
Observation: FNG at 37 (Fear), 14 consecutive fear days; yet HY OAS at 2.80% (<3% normal threshold), IG OAS at 0.79% (<1% normal).
Possible Explanation:
- Sentiment indicators (especially Breadth and Momentum) react faster to price declines, while bond markets may have priced in early spread widening
- Fear may be technically driven (breadth deterioration, momentum turning negative) rather than credit-fundamental
Counter-Evidence Needed:
- Cross-check HY OAS daily movement against FNG over the past 14 days
- Check HYG/JNK performance over the last 2 weeks
Divergence 2: Sentiment Fear vs. Leverage Frenzy
Observation: FNG persistently in Fear, yet margin debt at $1.304T (historical high range), 2026 YTD ETF net inflows at $8,560B (record).
Possible Explanation:
- Margin debt and ETF inflows are stock-level data (margin debt through April 2026, 5 months old); may lag current sentiment
- ETF inflows may come from passive allocation (401k dollar-cost averaging), insensitive to short-term sentiment
- “Fearful retail, greedy institutional” pattern — retail liquidating, institutions buying dips
Counter-Evidence Needed:
- Obtain latest FINRA monthly margin debt data (current latest: April)
- Dissect ETF inflows: passive broad-based vs. sector/thematic
Divergence 3: Breadth Collapse vs. Resilient Index
Observation: Breadth advancing stocks dropped from 666 to 370 (-44%), yet FNG composite only moved 30.4→37.0, not further downward.
Possible Explanation:
- Breadth deterioration but large-cap weighting (Magnificent 7) may still prop up index
- FNG comprises 7 sub-indicators; Breadth carries only 1/7 weight
Counter-Evidence Needed:
- Verify NYSE advancing/declining ratio
- Check SPX component stock breadth distribution
Credit / Rate / Leverage Cross-Verification
| Cross-Verification Indicator | Value | As-of | Source | Signal |
|---|---|---|---|---|
| HY OAS | 2.80% | 2026-09-24 | FRED ICE BOAML | 🟢 Normal |
| IG OAS | 0.79% | 2026-09-24 | FRED S&P LOCOM | 🟢 Normal |
| 10Y Yield | 5.18% | 2026-09-24 | FRED | — |
| 2Y Yield | 4.87% | 2026-09-24 | FRED | — |
| 10Y-2Y Spread | +0.31% | 2026-09-24 | FRED (same source, same day) | 🟢 Inversion resolved, flat |
| 10Y-30Y Spread | -0.29% | 2026-09-24 | FRED | Steepening at front end |
| Margin Debt | $1.304T | 2026-04 | FINRA | 🔴 Historical high range |
| 2026 YTD IPOs | ~73 | 2026 YTD | Renaissance Capital | 🔴 Active |
| 2026 YTD ETF Flows | $8,560B | 2026 YTD | Script constant | 🔴 Record |
Overall Assessment:
- Credit spreads are the only “cushion” — HY OAS at 2.80% well below 3%警戒, meaning bond markets do not price near-term credit risk
- 10Y-2Y spread at +0.31% shows inversion resolved, but 10Y-30Y still inverted at -0.29%, suggesting weak long-term growth/inflation expectations
- Margin debt and ETF inflows are red flags, but data timeliness is a concern: margin debt from April (5 months old), ETF flows are YTD cumulative
Conditions for Risk Escalation or Relief
Risk Escalation Signals (Watch List)
| Condition | Current | Threshold |
|---|---|---|
| FNG consecutive fear days | 14 | >20 → extreme fear regime possible |
| HY OAS | 2.80% | >5% → panic zone |
| 10Y-2Y spread | +0.31% | Re-inverts (<0) → recession fears resurface |
| Margin Debt (latest) | $1.304T (Apr) | Rising + market decline → forced liquidation risk |
Risk Relief Signals (Bullish Confirmation)
| Condition | Current | Confirmation Threshold |
|---|---|---|
| FNG breaks 50 | 37 | Hold above Neutral for 3 sessions |
| Breadth recovery | 370 advancing | >500 (NYSE+NYSEMKt) |
| HY OAS | 2.80% | <2.0% → full risk-on recovery |
| Safe Haven Demand | 3.33% | Drop below 1.5% |
Data Limitations
- Sub-Indicator Coverage: Only 2 of 7 sub-indicators returned successfully (Safe Haven Demand, Stock Price Breadth). The other 5 (Put/Call Ratio, Put/Call Volume, Junk Demand, Stock Price Performance, Stock Price Momentum) were not included — likely due to data source API timeouts or additional configuration requirements.
- Margin Debt Timeliness: FINRA monthly margin debt latest available through April 2026 (5 months old), not real-time.
- Breadth Internal Contradiction: Stock Price Breadth Score 0 labeled “Extreme Fear,” but raw value 370 labeled “Extreme Greed” — scoring function and raw-value interpretation are inverted. Requires follow-up verification.
- Sample Extremes: Historical low of 5.2 occurred on 2025-11-20 (likely a black swan event). Current 37.0, while below mean, is not near extreme levels.
- YTD ETF Flows: $8,560B is a script constant, sourced as internal estimate, not authoritative statistics.