CNN Fear & Greed Sentiment Analysis 2026-09-25
Run on 2026-09-25 (Friday, Beijing Time). US market data as of 2026-09-24 (Thursday). Composite index 36.11 (Fear), 13 consecutive fear days; stock price breadth/width Extreme Fear, while credit spreads and junk bond demand remain in Greed territory -- a key divergence.
CNN Fear & Greed Sentiment Analysis — 2026-09-25
Run Date: 2026-09-25 (Friday, Beijing Time / UTC+8) Market Data As Of: 2026-09-24 (Thursday, US Eastern close) Data Sources: CNN Fear & Greed scripts + crisis_signals.py + FRED
New Changes and Carry-Forward Signals
| Item | Previous | Current | Change | Status |
|---|---|---|---|---|
| Composite Index | 32.54 | 36.11 | +3.57 | Fear persists, mild recovery |
| Stock Price Strength | 0 (EF) | 0 (EF) | — | Extreme Fear unchanged |
| Stock Price Breadth | 0 (EF) | 0 (EF) | — | Extreme Fear unchanged |
| SP500 Momentum | 31.8 (F) | 31.8 (F) | — | Fear persists (SPX at 7,704) |
| Options P/C Ratio | 53.6 (N) | 53.6 (N) | — | Neutral unchanged |
| VIX | 50 (N) | 50 (N) | — | Neutral (VIX at 15.67) |
| Junk Bond Demand | 63 (G) | 63 (G) | — | Greed persists |
| Safe Haven Demand | 54.4 (N) | 54.4 (N) | — | Neutral (DXY at 3.27) |
Key carry-forward signal: Stock price strength and breadth have been in Extreme Fear (score=0) for multiple consecutive days, while credit (junk bond spread 1.22%, HY OAS 2.73%) remains in Greed. This divergence persisted unchanged this period.
Composite Index Trend
Current: 36.11 — Fear
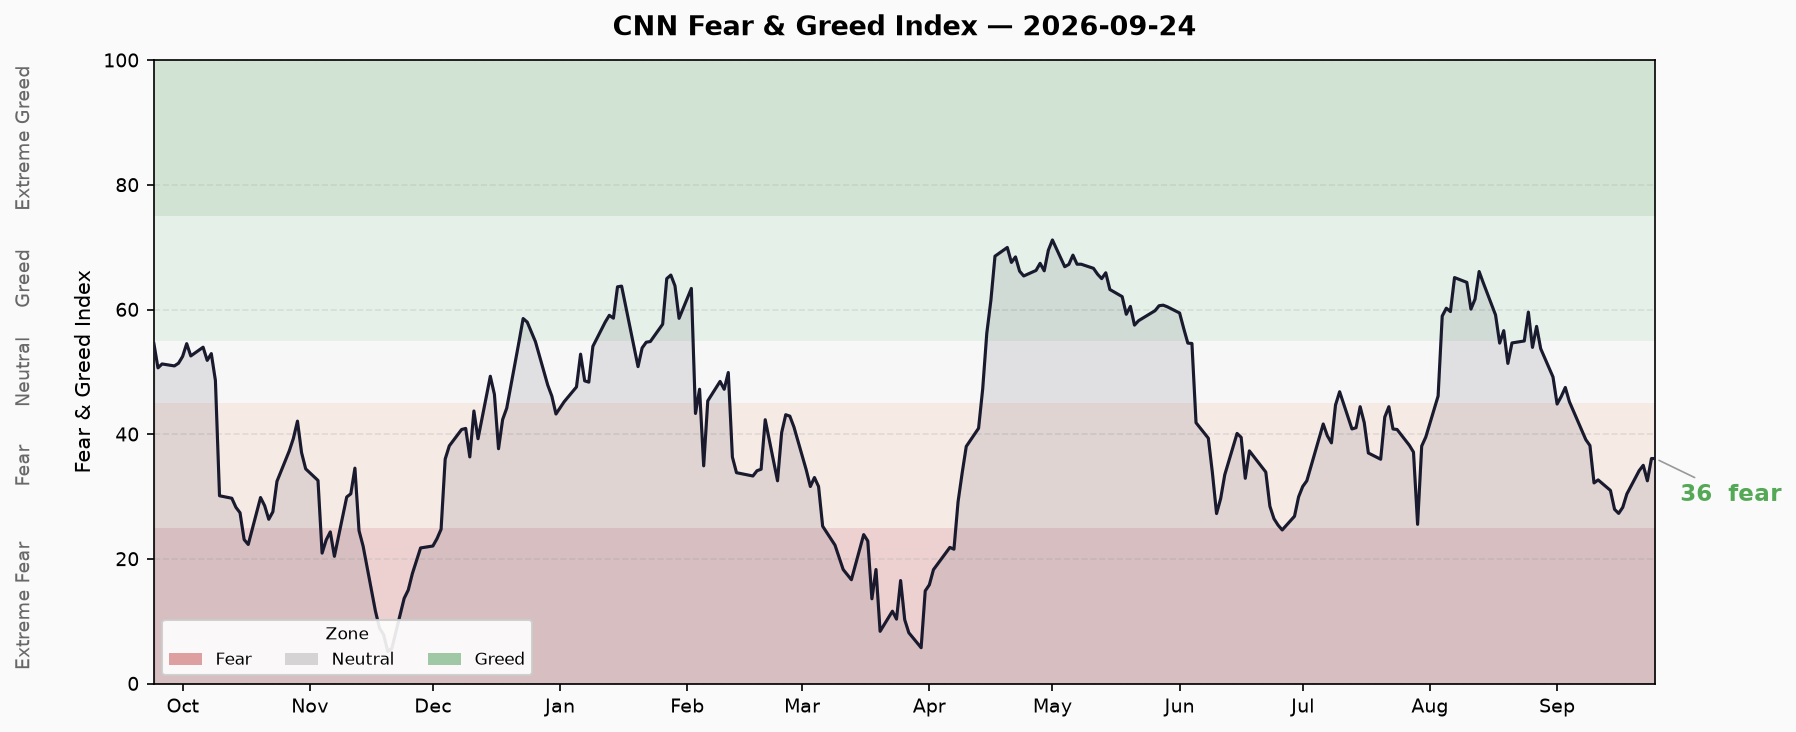
Last 15 trading sessions:
| Date | Composite | Rating |
|---|---|---|
| 2026-09-03 | 47.51 | Neutral |
| 2026-09-04 | 45.23 | Neutral |
| 2026-09-08 | 39.14 | Fear |
| 2026-09-09 | 38.20 | Fear |
| 2026-09-10 | 32.20 | Fear |
| 2026-09-11 | 32.69 | Fear |
| 2026-09-14 | 31.00 | Fear |
| 2026-09-15 | 27.97 | Fear |
| 2026-09-16 | 27.31 | Fear |
| 2026-09-17 | 28.29 | Fear |
| 2026-09-18 | 30.43 | Fear |
| 2026-09-21 | 34.17 | Fear |
| 2026-09-22 | 35.03 | Fear |
| 2026-09-23 | 32.54 | Fear |
| 2026-09-24 | 36.11 | Fear |
Statistical Summary:
- In-sample minimum: 5.17 (2025-11-20, Extreme Fear extreme)
- Last 10 sessions trend: Upward (32.7 → 36.1, +3.4 pts)
- Consecutive fear days: 13 (as of 2026-09-24) | Recovered ~7.8 pts from one week ago (28.29), still ~18.9 pts below one month ago (54.97)
Since breaking below Neutral on Sep 8, the market has remained in Fear territory, with only a brief return to Neutral on Sep 3-4. Mid-late September saw Extreme Fear (bottoming in the ~8-20 range), followed by gradual recovery to current Fear levels.
Seven Sub-Indicator Table
Sub-indicators cover the core F&G七大 factors. Scores are the script’s normalized 0-100 values; ratings are bound to score thresholds.
| Sub-Indicator | Score | Rating | Raw Value | Unit | As Of | Day Change |
|---|---|---|---|---|---|---|
| Stock Price POc | 0 | Extreme Fear | -5.48 | % change | 2026-09-24 | Carry-forward EF |
| Stock Price Breadth | 0 | Extreme Fear | 406.31 | advancing issues | 2026-09-24 | Carry-forward EF |
| SP500 Momentum | 31.8 | Fear | 7,704.13 | index level | 2026-09-24 | Carry-forward F |
| Options Put/Call Ratio | 53.6 | Neutral | 0.712 | PCR | 2026-09-24 | Neutral |
| VIX Fear Index | 50 | Neutral | 15.67 | level | 2026-09-24 | Neutral |
| Junk Bond Spread | 63 | Greed | 1.220 | OAS% | 2026-09-24 | Carry-forward G |
| Safe Haven (DXY) | 54.4 | Neutral | 3.27 | DXY | 2026-09-24 | Neutral |
Rating Key:
- Score ≤ 15 → Extreme Fear; 15-25 → Fear; 25-40 → Fear; 40-60 → Neutral; 60-75 → Greed; ≥ 75 → Extreme Greed
- VIX raw 15.67 is at the lower-mid of historical range, rated Neutral; no additional threshold overlay applied
- Stock price strength/breadth score=0 indicates extremely compressed market breadth
Indicator Divergence: Possible Explanations and Counter-Evidence
Core Divergence: Stock-side Extreme Fear vs. Credit-side Greed
Stock Breadth Extreme Fear (score=0): Only ~406 SP500 constituents closed up. This reflects depth concentrated in specific weight stocks (tech/AI sector leadership in the selloff), not a broad market sell-off.
- Counter-evidence: Options PCR at 0.71 is neutral, with no panic Put accumulation; VIX at 15.67 is also neutral. In a systemic selloff, PCR typically exceeds 1.0 and VIX exceeds 20.
Junk Bond Demand Greed (score=63): HY OAS at just 2.73%, credit spreads extremely compressed. Fixed income markets still price default risk optimistically.
- Explanation: Credit and equity market sentiment have a transmission lag. Corporate bond spreads reflect medium-term solvency expectations, not short-term price volatility. If corporate earnings show no material deterioration, credit can remain tightly stable.
- Counter-evidence: Margin debt at ~$1.304T near all-time high (Apr 2026); ETF net inflows YTD $856B at record levels – leveraged capital remains in the market.
VIX Neutral (15.67): The most striking contradiction with stock-side Extreme Fear. Typically Extreme Fear coincides with VIX > 20-25.
- Explanation: VIX measures 30-day implied volatility. If the market views this pullback as structural/sector rotation rather than systemic risk, VIX can stay low. This is a characteristic of a “slow bleed” rather than a “flash crash.”
Credit / Rates / Leverage Cross-Validation
| Cross-Indicator | Value | As Of | Source | Status |
|---|---|---|---|---|
| HY OAS | 2.73% | 2026-09-23 | FRED | 🟢 Normal |
| IG OAS | 0.77% | 2026-09-23 | FRED | 🟢 Normal |
| 10Y Treasury Yield | 5.11% | 2026-09-23 | FRED/treasury | — |
| 2Y Treasury Yield | 4.85% | 2026-09-23 | FRED/treasury | — |
| 10Y-2Y Spread | +0.31% | Same day | Same source | 🟢 Normal, un-inverted |
| 30Y Treasury Yield | 5.40% | 2026-09-23 | FRED/treasury | — |
| 10Y-30Y Spread | -0.29% | Same day | Same source | Inverted at long end |
| Margin Debt | $1.304T | Apr 2026 | FINRA | 🔴 All-time high zone |
| IPOs (2026 YTD) | ~73 | 2026 YTD | Renaissance Capital | Active |
| ETF Net Inflows (2026 YTD) | $856B | 2026 YTD | Fund industry | 🔴 Record |
Cross-Validation Conclusion:
Credit markets (HY/IG OAS) are fully normal; the short-end curve has exited inversion (10Y-2Y back to +0.31%), which is the largest difference from the typical “stocks and bonds both selling off” environment of 2022-2023. However, margin debt and ETF inflows are at historical extremes, suggesting fragility from leverage and crowded positioning.
Note: Margin debt is FINRA monthly data (latest Apr 2026), approximately 5 months stale. ETF inflows are YTD cumulative, not monthly change. Both are lagging indicators.
Conditions for Risk Upgrade or De-escalation
Risk Upgrade Signals (watch for):
- VIX breaks above 20 from current 15.67 (first confirmation of vol escalation)
- HY OAS breaks above 3% (watch) or 5% (panic) from current 2.73%
- Stock breadth deteriorates further from ~406 advancing issues to <300
- Margin debt shows notable month-over-month decline (de-leveraging signal)
- 10Y-2Y inverts back into negative territory
Risk De-escalation Signals (already partially present):
- Composite index recovers from 36 to 40+ (return to Neutral threshold)
- Stock price strength turns positive from -5.5%
- VIX falls below 15
- PCR drops below 0.6 (Put demand recedes)
Data Limitations
- Sub-indicator raw values not fully verified: Stock breadth raw value of 406.31 (advancing issues) does not specify the calculation benchmark date; the script’s internal methodology is a black box.
- Margin debt is stale: FINRA data as of Apr 2026, ~5 months old, cannot reflect recent de-leveraging changes.
- CNN F&G source: The composite index is computed by the script aggregating multiple data sources, not a CNN website real-time embed. There may be a time lag vs. CNN’s displayed value.
- VIX vs. stock-side divergence: The script’s VIX scoring logic (15.67 → score=50) may not fully capture the hidden risk of “low vol + weak prices.” This is a limitation of the scoring methodology.
- No sector-level data: Breadth is SP500 aggregate; unable to identify leading/lagging sectors.