CNN Fear & Greed Sentiment Analysis 2026-09-24
Run date: 2026-09-24 (Mon, Beijing time). Market data as of 2026-09-22 (Fri, US ET). CNN F&G Composite at 35.26 (Fear), 11th consecutive fear day. Sub-indicator divergence: VIX neutral, credit spreads normal, but momentum/breadth/strength all fearful. Cross-validation: 2/4 signals normal, 2/4 alert (margin debt & ETF flows at records).
Data Summary
| Item | Value | As of | Status |
|---|---|---|---|
| CNN F&G Composite | 35.26 | 2026-09-22 | 🔴 Fear |
| Previous close | 33.71 | 2026-09-21 | — |
| 1 week ago | 27.97 | 2026-09-15 | — |
| 1 month ago | 54.66 | ~2026-08-22 | — |
| 1 year ago | 66.51 | ~2025-09-22 | — |
Data cutoff: 2026-09-22 (Friday US ET). Run at Beijing time 9/24 morning; no new US trading day data this week yet. Composite index carries forward the 9/22 reading.
Changes and Continued State
- Composite maintains fear: 9/22 closed at 35.26, up +1.55 from 9/21’s 33.71, but remain in fear zone (<40).
- 11th consecutive fear day: Every trading day since 9/9 has been fear-rated, uninterrupted.
- Previous close note:
previous_close= 33.71 (9/21), latest historical entry = 35.26 (9/22). Difference of 1.55 is expected—previous_closereferences the prior trading day, while the historical series has been updated to the most recent. - 10-day trend slightly down: From 38.20 (9/9) to 35.26 (9/22), cumulative -2.94. Last 3 days (9/21→9/22) show a small rebound of +0.46.
Composite Trend
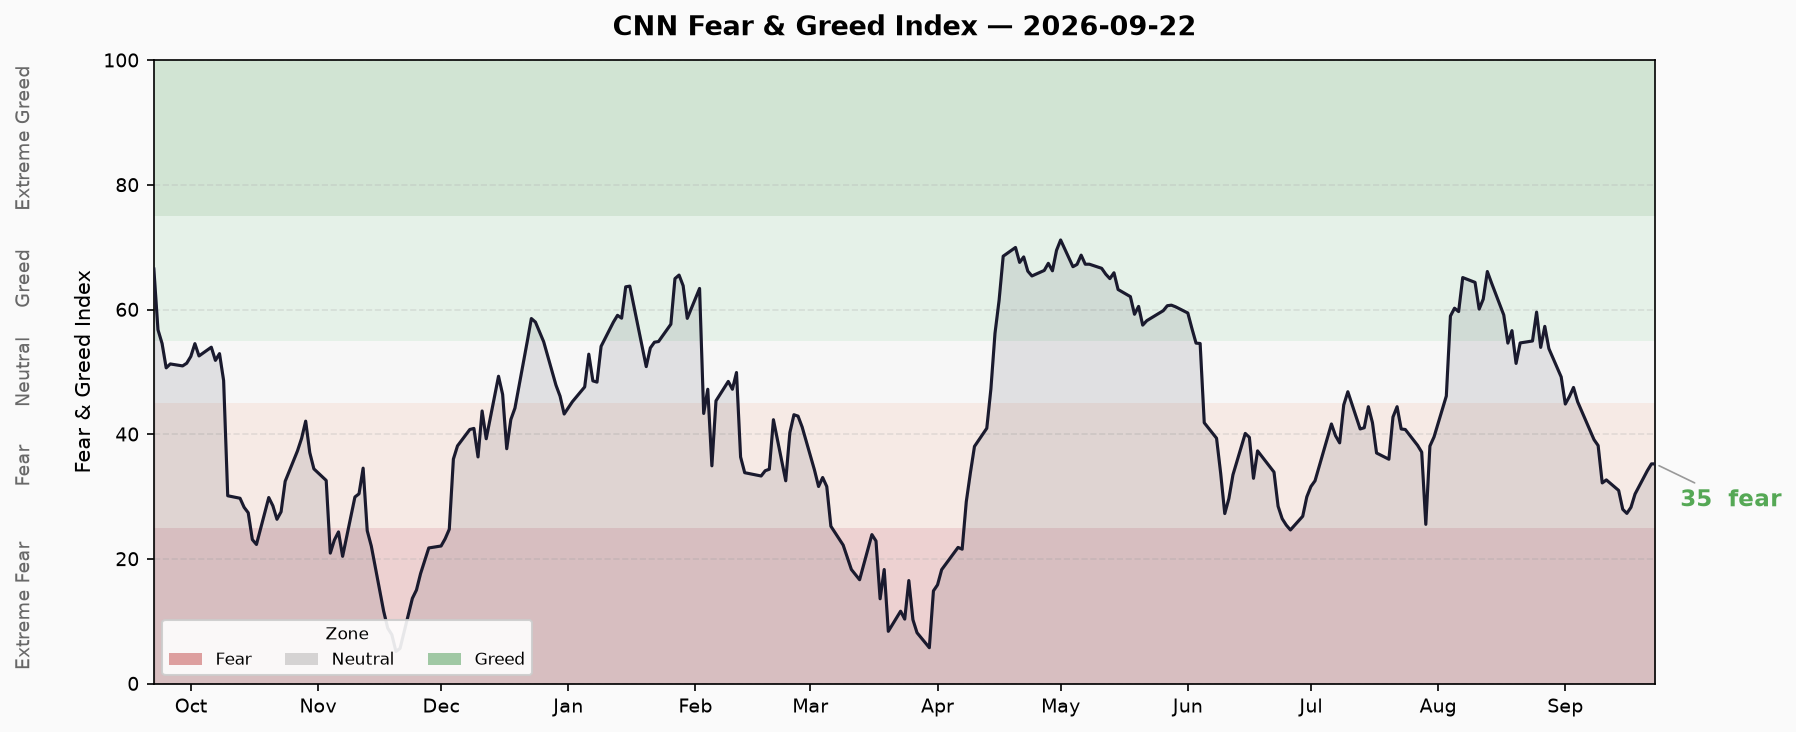
- Sample minimum: 5.17 (2025-11-20) — extreme panic bottom.
- Sample maximum: 71.17 (2026-05-01) — greed zone.
- Current position: 35.26, at ~14th percentile of sample range ((35.26-5.17)/(71.17-5.17)), well below median 50.
- Fear window: 11 consecutive fear days since 9/9, ranging from 27.31 (9/16 low) to 38.20 (9/9 high), oscillating in 27-38 band.
Seven Sub-Indicators
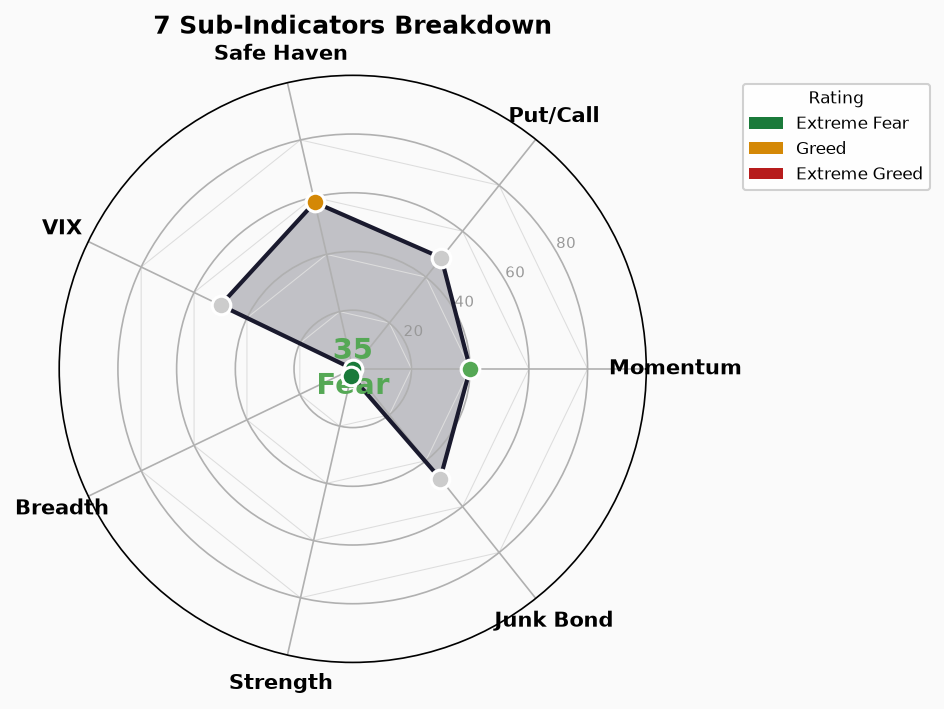
| Sub-Indicator | Score | Official Rating | Raw Value | Unit | As of | Notes |
|---|---|---|---|---|---|---|
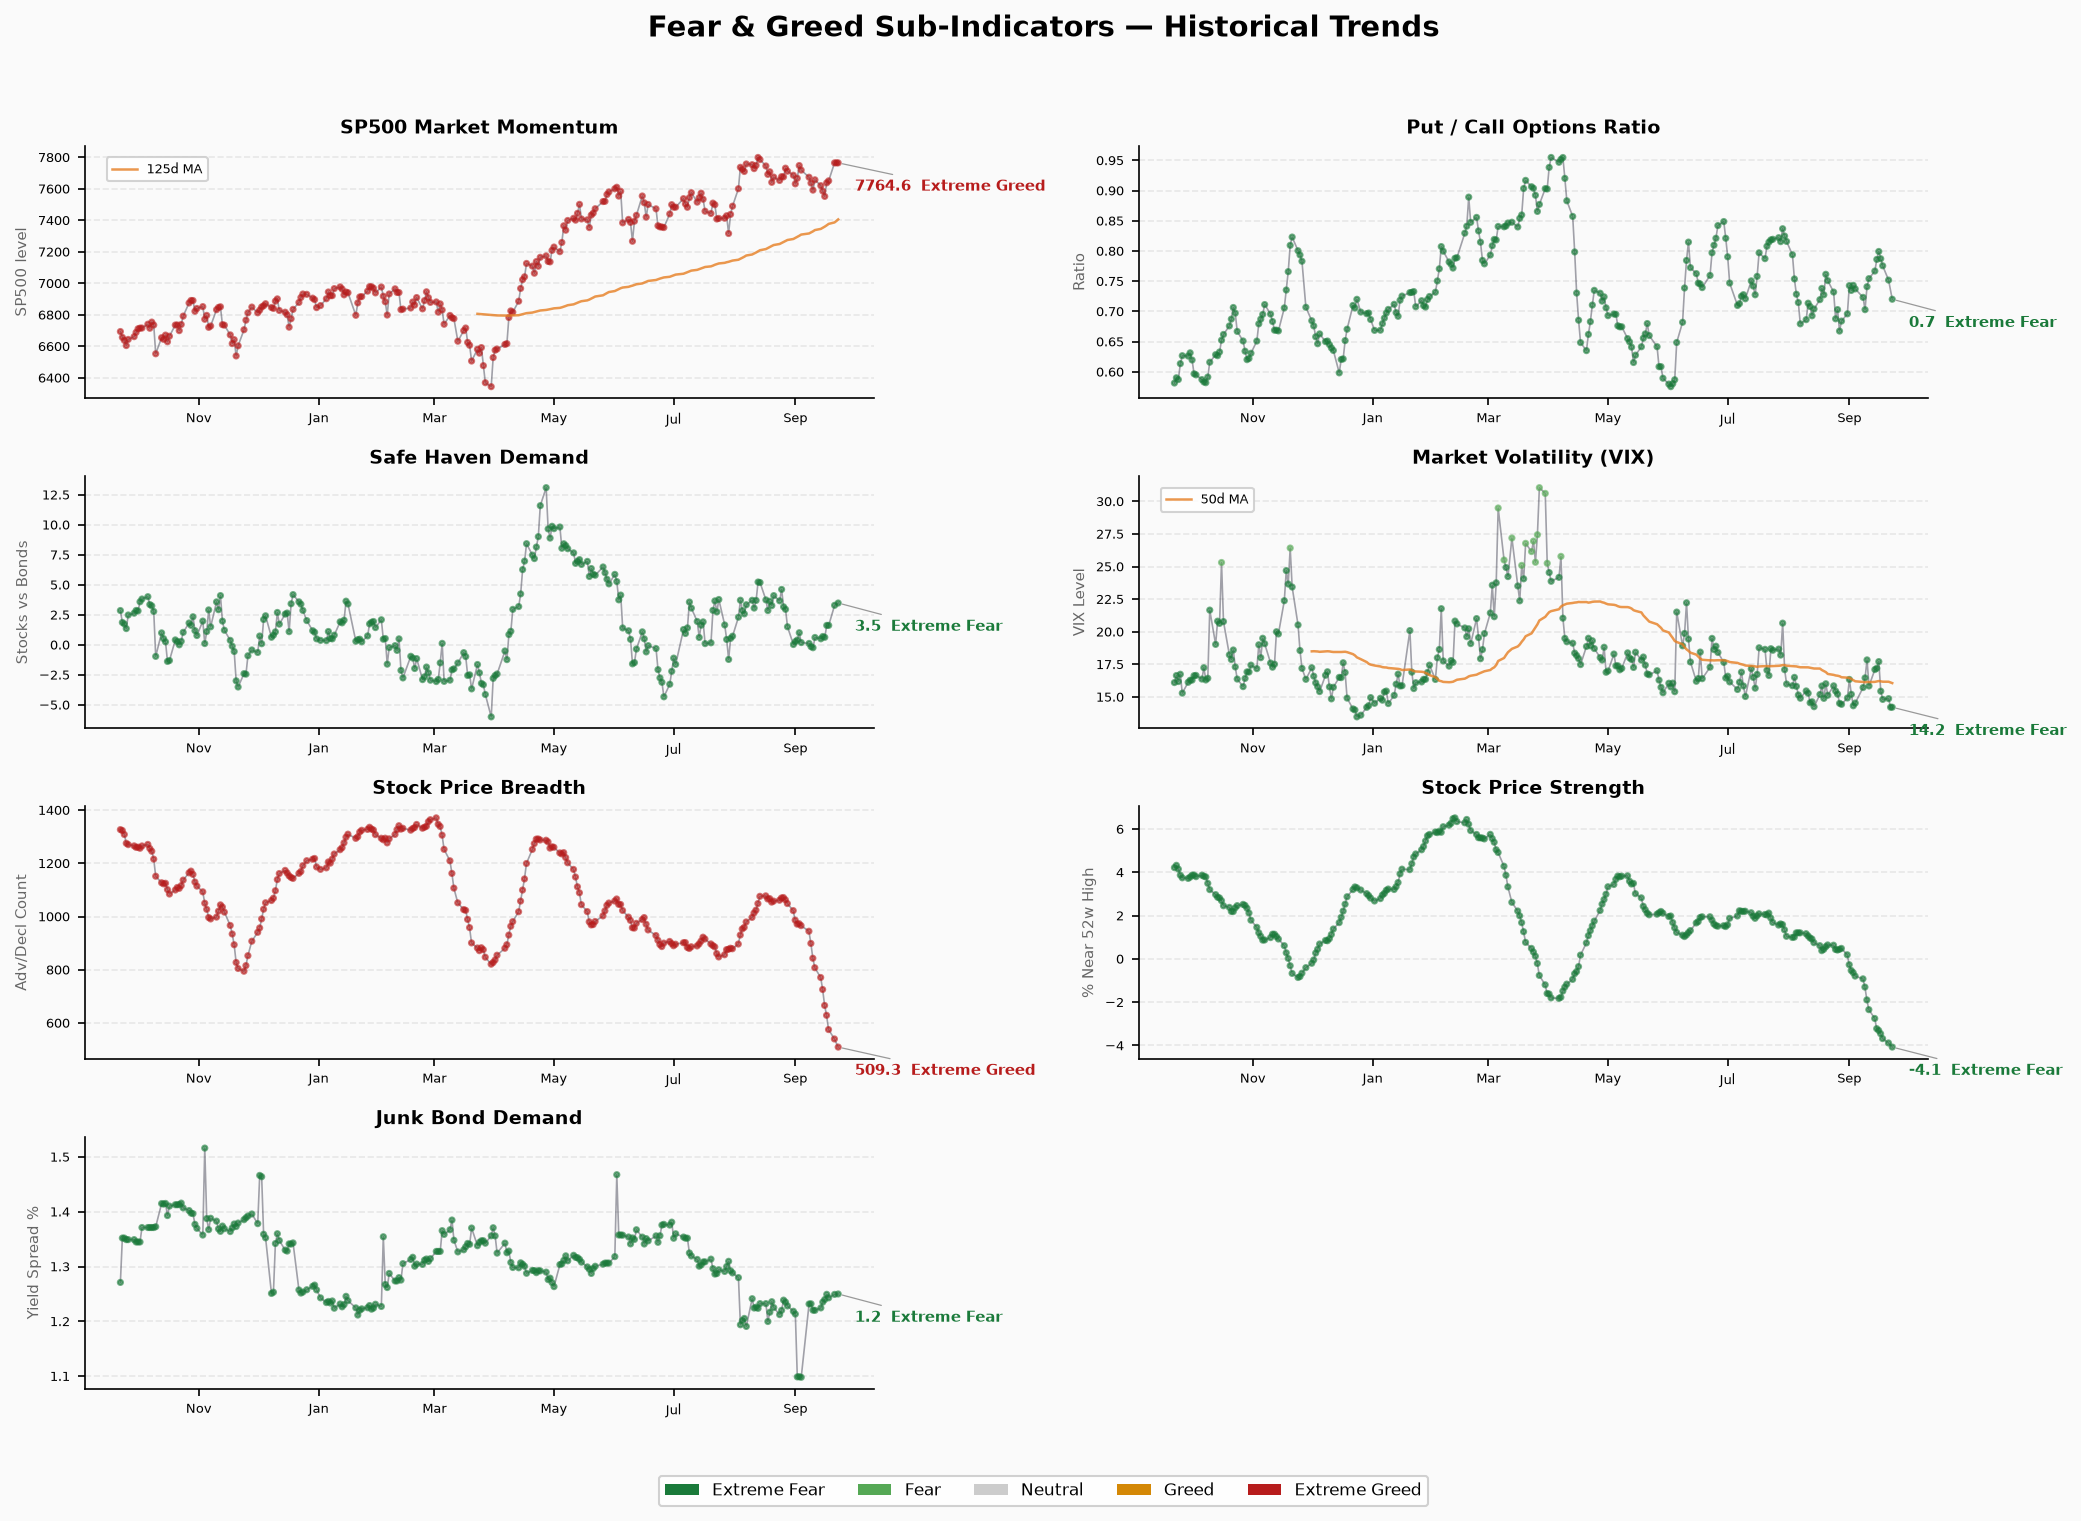
| S&P 500 Momentum (1mo) | 40 | Fear | 7,764.64 | Level | 2026-09-22 | Weak 1-month trend |
| S&P 125 Momentum (6mo) | 40 | Fear | 7,396.27 | Level | 2026-09-22 | Medium-term momentum weakening |
| Price Strength (Hi/Lo) | 2.4 | Extreme Fear | -4.07 | % | 2026-09-22 | Weakest sub-indicator |
| Price Breadth (Adv/Dec) | 0 | Extreme Fear | 509 | Advancers | 2026-09-22 | Breadth severely contracted |
| Put/Call Ratio | 48.4 | Neutral | 0.72 | Ratio | 2026-09-22 | Bearish but fair |
| VIX | 50 | Neutral | 14.21 | Index | 2026-09-22 | Low vol environment |
| VIX (50-day avg) | 50 | Neutral | 16.11 | Index | 2026-09-22 | 50-day mean |
Note: PCR, VIX, VIX-50, and junk bond ratings are derived from script-internal Score→rating mapping, not CNN official labels. The official rating column binds to Score only. VIX at 14.21 is historically low and does not map to fear.
Indicator Divergence
Significant divergence among sub-indicators:
- Price side全面恐慌: Strength (2.4) and Breadth (0) hit extreme fear; momentum at 40 also in fear—broad decline across S&P constituents with very few advancers.
- Volatility & credit neutral: VIX 14.21 (neutral), PCR 0.72 (neutral-ish bearish, not extreme), HY OAS 1.25 (neutral)—options market and bond market not issuing equally urgent signals.
Plausible explanation:
- Structural decline, not systemic panic: Breadth/strength collapse with low VIX commonly occurs when large-cap/weight stocks drag the index (e.g., tech weight pullback) rather than broad market sell-off.
- Options have priced in some risk: PCR 0.2 is not elevated; VIX at low range—participants not aggressively buying hedges.
- Bonds at ease: HY OAS 2.68% (cross-validation below) below 3% alert line; credit spreads not widening.
Falsification triggers:
- If VIX jumps from 14 to 20+, current “mild fear” may rapidly escalate to systemic panic.
- If breadth stays at zero (advancers <500), watch for decline spreading from mega-caps to small caps.
Credit / Rate / Leverage Cross-Validation
| Cross-Indicator | Value | As of | Status | Source |
|---|---|---|---|---|
| HY OAS | 2.68% | 2026-09-22 | 🟢 Normal | FRED / script |
| IG OAS | 0.77% | 2026-09-22 | 🟢 Normal | FRED / script |
| 10Y Yield | 4.96% | 2026-09-22 | — | FRED / script |
| 2Y Yield | 4.71% | 2026-09-22 | — | FRED / script |
| 30Y Yield | 5.29% | 2026-09-22 | — | FRED / script |
| 10Y-2Y Spread | +0.26% | 2026-09-22 | 🟢 Normal, flat | Same-source同日 calc |
| 10Y-30Y Spread | -0.33% | 2026-09-22 | 🟡 Long-end inversion | Same-source同日 calc |
| Margin Debt | $1.304T | 2026-04 | 🔴 Record zone | FINRA (monthly, 5mo lag) |
| IPO Count (YTD) | ~73 | 2026 YTD | 🔴 Active | Renaissance Capital |
| ETF Net Inflow (YTD) | $8,560B | 2026 YTD | 🔴 Record | Script aggregate |
Cross-validation conclusion:
- Credit intact: HY OAS 2.68% well below 3% alert; IG OAS 0.77% normal. Bond markets not forecasting default wave or liquidity crunch.
- Yield curve: short-end normal, long-end inverted: 10Y-2Y +26bp normal range (not recession signal), but 10Y-30Y -33bp signals long-end pricing more dovish / lower inflation expectations.
- Leverage risk needs verification: Margin debt $1.304T (Apr 2026 FINRA) at historical high range, but data is 5 months stale. If margin debt remains elevated while prices fall, margin call spiral risk exists.
- Record capital inflows: YTD ETF net inflow $8,560B and 73 IPOs indicate robust primary/secondary market fundraising—this is itself a “greed” signal, contrasting with current fear composite.
Reading the contradiction: Fear composite reflects price momentum and breadth weakness, while credit/IPO/ETF inflows reflect capital supply and credit environment health. Both can coexist—markets can operate in “ample liquidity but price pressure” environments (e.g., profit-taking, rotation to defensive sectors, or macro uncertainty compressing valuations).
Conditions for Risk Escalation
Any of the following would suggest current fear may升级为 broader risk event:
- VIX breaks 20 (current 14.21): Volatility enters anxiety zone.
- HY OAS breaks 3% (current 2.68%): Credit spreads widen, signaling default concerns.
- Breadth continues deteriorating: Advancers consistently below 300 (current 509), or decliner ratio >70%.
- Margin debt inflection: If next FINRA release (May/Jun 2026) shows margin debt declining while prices fall—deleveraging signal.
- 10Y-2Y turns negative and deepens: Current +26bp; sustained inversion re-prices recession odds.
Conditions for Risk De-escalation
- F&G back above 40: Exit fear zone, enter neutral.
- Breadth repair: Advancers回升 to 1,500+ (roughly half of S&P 500 constituents).
- Strength turns positive: Hi/Lo differential back to positive territory.
- VIX holds below 15: Volatility does not escalate.
Data Limitations
- CNN F&G data: Script-collected from public API, as of 2026-09-22. CNN.com may have updated values; not cross-verified.
- Sub-indicator raw ratings: PCR, VIX, junk bond ratings derived from script-internal Score→rating mapping, not CNN official ratings.
- Margin debt: FINRA monthly data lags ~5 months (latest Apr 2026), not real-time.
- IPO/ETF inflows: YTD data from Renaissance Capital and script aggregate, not daily real-time.
- Cross-validation indicators: FRED data as of 2026-09-22; weekends/holidays may have no update.
- Not included: CNN official F&G seven sub-indicator raw scores (script recalculates from price data); cannot逐项核对 with CNN website.