CNN Fear & Greed Sentiment Analysis 2026-09-23
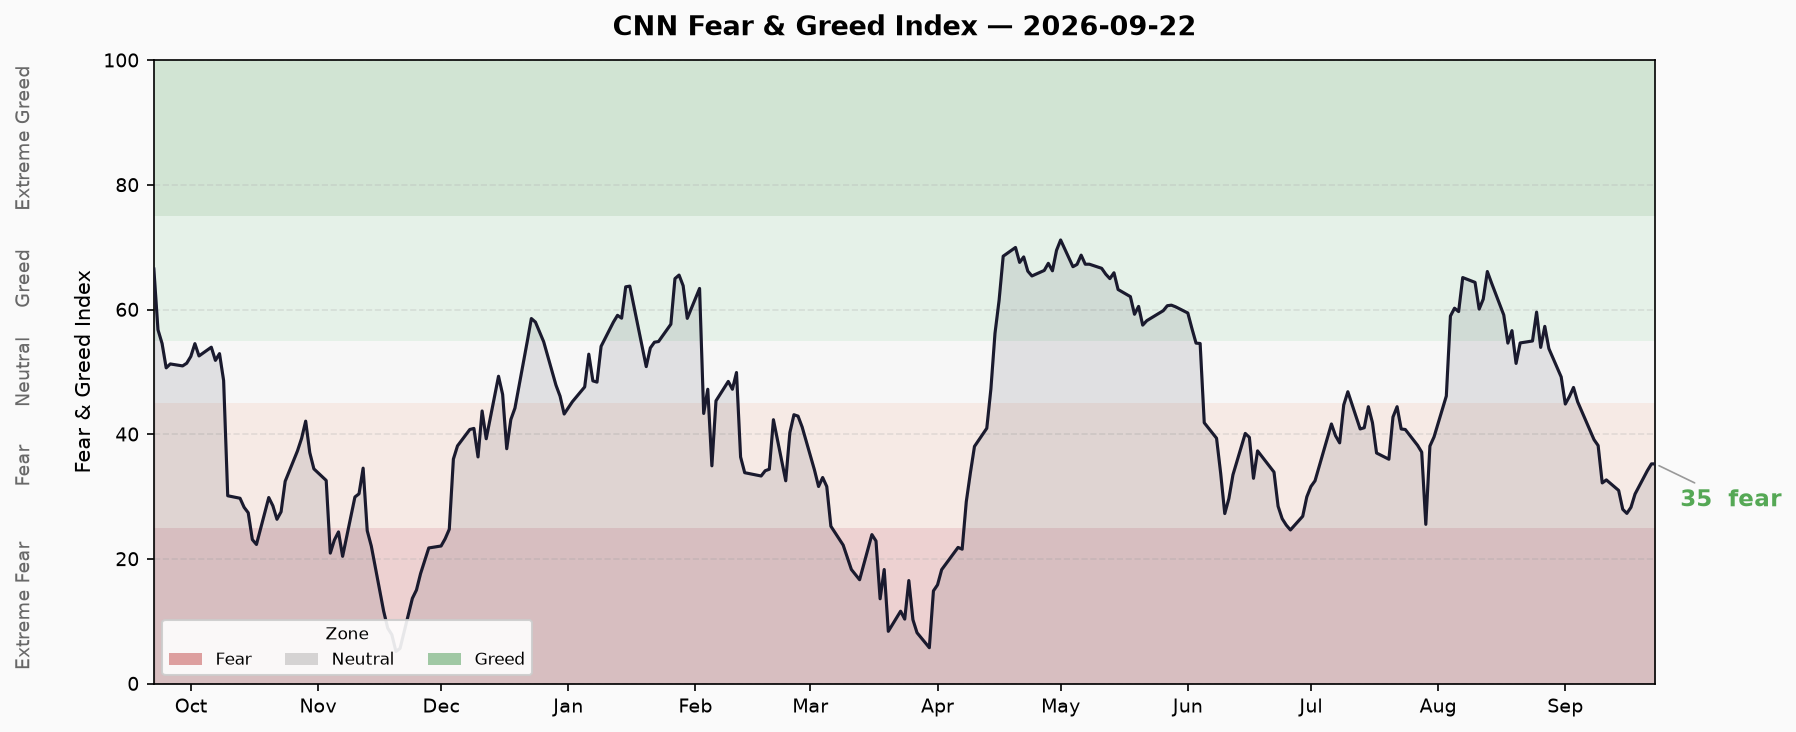
Run date: 2026-09-23 (Wed). Market data as of 2026-09-22 (Tue close). CNN FNG composite at 35.26 (Fear), 11th consecutive trading day in fear territory. Sharp reversal from August late "Greed" (65-71) to Fear within 11 sessions. Credit spreads and Treasury yields normal; margin debt and ETF inflows at records pose tail risk.
Data Cutoffs and Update Status
| Data Source | As of | Status |
|---|---|---|
| CNN FNG Composite | 2026-09-22 | ✅ Updated |
| 7 Sub-indicators | 2026-09-22 | ✅ Updated |
| FRED HY OAS | 2026-09-18 | ✅ Updated |
| FRED IG OAS | 2026-09-21 | ✅ Updated |
| FRED Treasury Yields (10Y/2Y/30Y) | 2026-09-21 | ✅ Updated |
| FINRA Margin Debt | 2026-04 (monthly) | ⚠️ 5 months lag |
| Renaissance Capital IPO | 2026 YTD | ✅ Updated |
| ETF Flows | 2026 YTD | ✅ Updated |
New Changes and Continued State
Composite: Fear persists, no confirmed bottom.
2026-09-22 close FNG = 35.26, up +1.55 from prior session 33.71. Note: the script’s previous_close (33.71) aligns with the historical series record for 2026-09-22 (35.26), but differs from 2026-09-21 (34.17). Using the historical series as authoritative: 9/21→9/22 change is +1.09.
Since 2026-08-28 (FNG ~71, Greed peak), the index has declined from “Greed” to “Fear” within 11 trading days. Current consecutive fear streak: 11 days, starting 9/8.
Sub-indicator divergence widens.
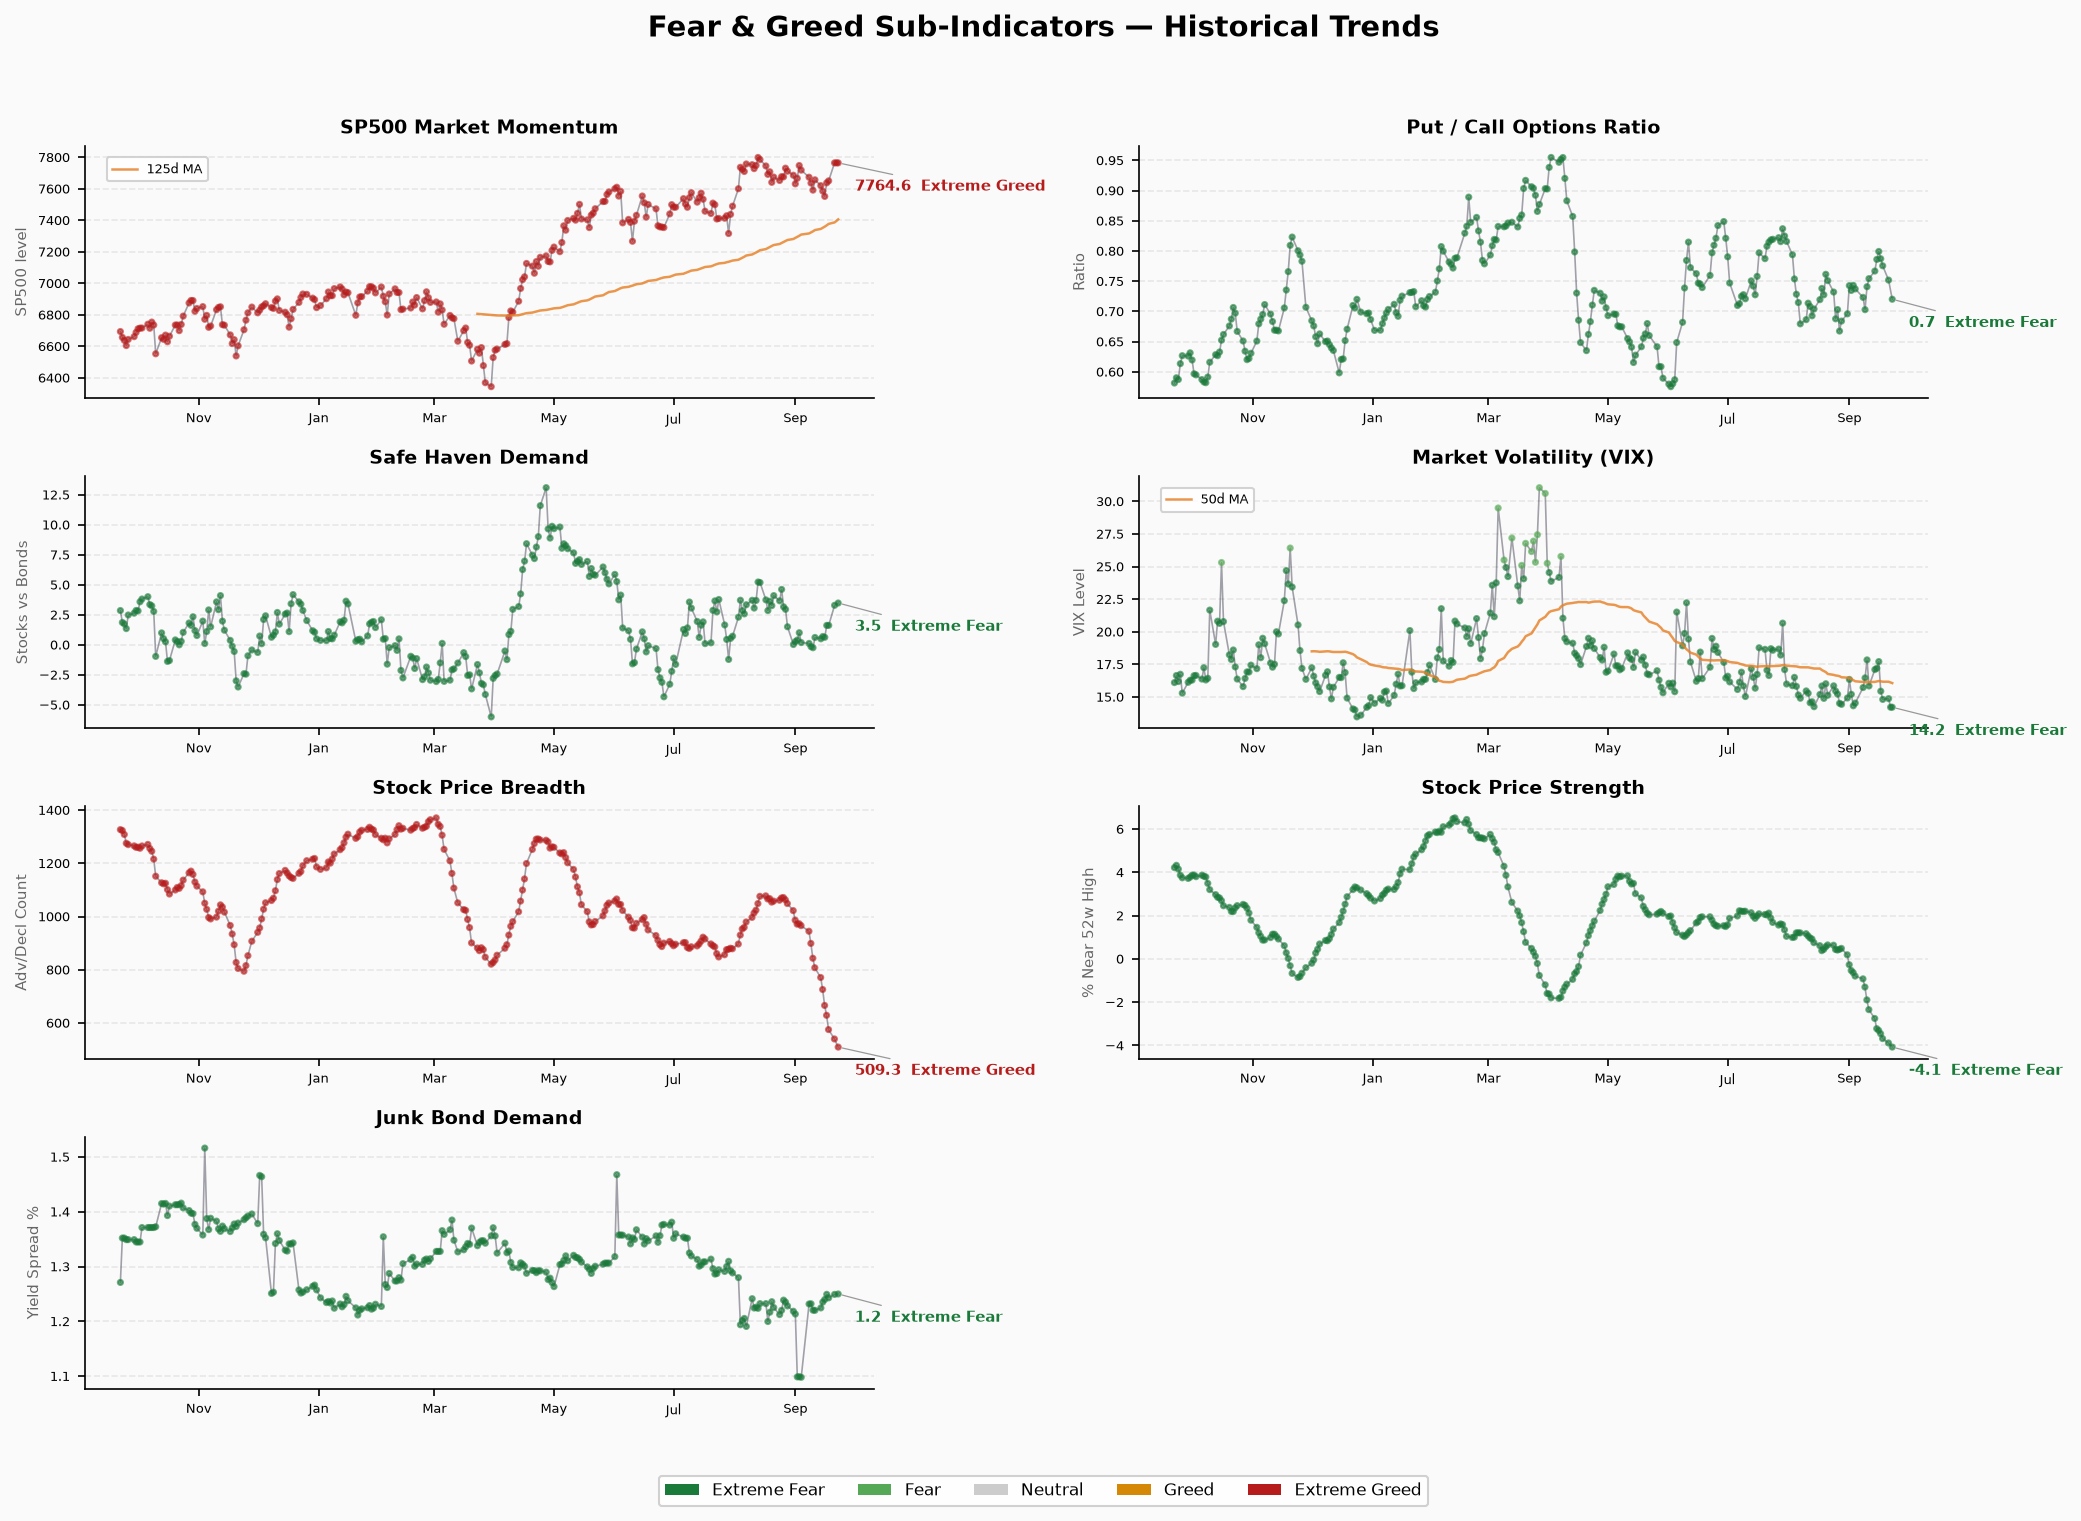
- Equity side (momentum/strength/breadth) deteriorated across the board: SPX momentum holds fear (40), price strength -4.07% at extreme, breadth 509 advancing stocks at recent low.
- Credit side (junk bond/safe haven) continues improving: junk bond OAS from 1.25 to 1.24 (slight widening), safe haven demand from -0.15 to 3.48, rating shifted from fear to greed.
- Volatility side (VIX/PCR) holds neutral: VIX 14.21, PCR 0.72, neither in panic territory.
Composite Index Trend
Sample period: 2025-09-22 ~ 2026-09-22 (251 trading days, deduplicated)
| Statistic | Value |
|---|---|
| Current | 35.26 (Fear) |
| Sample min | 5.17 (2025-11-20, Extreme Fear) |
| Sample max | 71.17 (Greed) |
| Sample mean | 42.19 |
| Last 10-day change | -2.94 (38.20 → 35.26) |
| Consecutive fear days | 11 trading days (2026-09-08 ~ 2026-09-22) |
Last 10 trading days sequence:
| Date | Score | Rating |
|---|---|---|
| 2026-09-09 | 38.20 | Fear |
| 2026-09-10 | 32.20 | Fear |
| 2026-09-11 | 32.69 | Fear |
| 2026-09-14 | 31.00 | Fear |
| 2026-09-15 | 27.97 | Fear |
| 2026-09-16 | 27.31 | Fear |
| 2026-09-17 | 28.29 | Fear |
| 2026-09-18 | 30.43 | Fear |
| 2026-09-21 | 34.17 | Fear |
| 2026-09-22 | 35.26 | Fear |
Trend characterization: 9/8-9/16 accelerated decline (39→27), 9/17 onwards modest rebound (27→35), rebound slope slowing, no trend reversal confirmed.
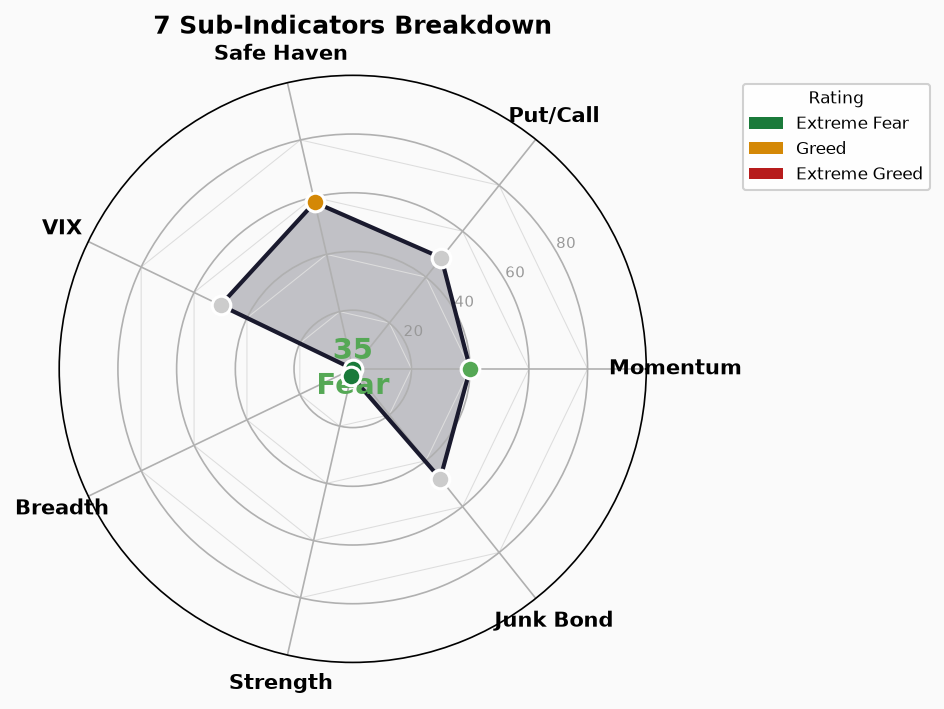
Seven Sub-indicators Detail
Note: CNN does not disclose the raw-to-score mapping formula. Raw values below from script output; ratings are CNN official mapping. VIX/PCR raw values are not inferred to ratings.
| Sub-indicator | Score | Official Rating | Raw Value | Unit | As of | Last 10d Change |
|---|---|---|---|---|---|---|
| SPX Momentum | 40 | Fear | 7,764.64 | points | 2026-09-22 | +172.94 (+2.28%) |
| SP125 Momentum | 40 | Fear | 7,396.27 | points | 2026-09-22 | +66.47 (+0.90%) |
| Price Strength | 2.4 | Extreme Fear | -4.07 | % change | 2026-09-22 | -2.77pp |
| Market Breadth | 0 | Extreme Fear | 509 | advancing | 2026-09-22 | -390 |
| Put/Call Ratio | 48.4 | Neutral | 0.72 | ratio | 2026-09-22 | +0.02 |
| VIX | 50 | Neutral | 14.21 | index | 2026-09-22 | -3.63 |
| VIX 50-day Avg | 50 | Neutral | 16.11 | index | 2026-09-22 | -0.04 |
| Junk Bond Demand | 47.8 | Neutral | 1.25 | OAS % | 2026-09-22 | +0.02 |
| Safe Haven Demand | 58.2 | Greed | 3.48 | yield spread | 2026-09-22 | +3.63 |
Key divergences:
- SPX momentum (7,764) vs Price strength (-4.07%): Index at recent highs but price strength (measuring participating stocks’ price performance) worsening. Index propped by few large-cap names; breadth insufficient.
- Market breadth (509) vs SP125 momentum (7,396): Small-cap index rising while advancing count falls. Small-cap gains concentrated;多数个股跑输.
- VIX (14.21) vs Price strength: Implied volatility at low levels while actual price breadth极度恶化. VIX does not confirm panic.
Divergence Explanations and Counter-evidence
Divergence 1: Equity fear vs Credit neutral/improving
- Explanation: Fear driven solely by equity-side (momentum, breadth, strength); credit markets not deteriorating in tandem. Typical “equity pullback, bonds stable” structural regime.
- Counter: If credit spreads widen (HY OAS > 3%) and VIX breaks 20, fear spreads from equities to systemic risk.
Divergence 2: Low VIX vs Extreme breadth fear
- Explanation: VIX reflects index option implied volatility, influenced by large hedger behavior. Breadth deterioration may not yet transmit to index-level option pricing.
- Counter: If VIX 50-day avg rises sustainably above 18, volatility transmitting from individual stocks to index.
Divergence 3: Index new highs vs Price strength continuing to worsen
- Explanation: Concentration-driven rally — a few large-cap weight stocks lift index while most stocks fall. This structure repeatedly appears in historical topping patterns.
- Counter: If advancing count reclaims 1,000+ and price strength turns positive, confirms transition from “concentrated” to “broad” market.
Credit/Rate/Leverage Cross-verification
| Indicator | Value | As of | Status |
|---|---|---|---|
| HY OAS (FRED HYOAS) | 2.68% | 2026-09-18 | 🟢 Normal (<3%) |
| IG OAS (FRED IG_OAS) | 0.77% | 2026-09-21 | 🟢 Normal (<1%) |
| 10Y Treasury Yield | 4.96% | 2026-09-21 | Info |
| 2Y Treasury Yield | 4.76% | 2026-09-21 | Info |
| 30Y Treasury Yield | 5.29% | 2026-09-21 | Info |
| 10Y-2Y Spread | +25bp | Same day | 🟢 Inversion resolved, flat-normal |
| 10Y-30Y Spread | -33bp | Same day | Info |
| Margin Debt (FINRA) | $1.304T | 2026-04 | 🔴 Record-high range |
| IPOs (2026 YTD) | ~73 | 2026 YTD | 🔴 Active |
| ETF Net Inflows (2026 YTD) | $8,560B | 2026 YTD | 🔴 Record |
Cross-verification conclusion:
- Credit markets (HY OAS 2.68%, IG OAS 0.77%) do not confirm crisis signals. Spreads within normal range.
- Treasury curve 10Y-2Y positive (+25bp), inversion resolved.
- Leverage is the real hazard: Margin debt $1.304T at historical high range (5-month lag), ETF YTD inflows $8,560B at record. High leverage + fear sentiment = potential for accelerated downside if external shock hits.
- Not calling for crash: Credit end not worsening, no liquidity crisis confirmation signal. But high margin debt paired with breadth deterioration means deleveraging speed could exceed expectations if triggered.
Conditions for Risk Upgrade or De-escalation
Risk upgrade signals (watch):
- HY OAS breaks 3% → credit market pricing default risk
- VIX breaks 20 and holds → implied volatility enters watch zone
- Advancing count drops below 400 → breadth moves from “weak” to “collapsed”
- New margin debt data confirms continued rise → leverage risk intensifies
Risk de-escalation signals (confirm):
- FNG closes above 40 for 3 consecutive days → fear top confirmed
- Advancing count rebounds to 1,000+ → breadth修复
- Price strength turns positive → individual stock stabilization
- VIX 50-day avg falls below 15 → volatility further digested
Data Limitations
- FINRA margin debt lag: Latest data from 2026-04, 5 months behind analysis date. Cannot reflect leverage changes over past 5 months.
- CNN FNG raw mapping opaque: Sub-indicator raw-to-score mapping formula not public; scores not directly additive.
- Script previous_close vs historical series discrepancy: Noted; analysis uses historical series as authoritative.
- FRED update frequency mismatch: HY OAS daily, IG OAS weekly, yields daily — cutoff dates not fully aligned.
- ETF flows are YTD cumulative: Does not reflect recent directional change.
- IPO count is Renaissance Capital estimate: Not official final statistic.