CNN Fear & Greed Sentiment Analysis 2026-09-18
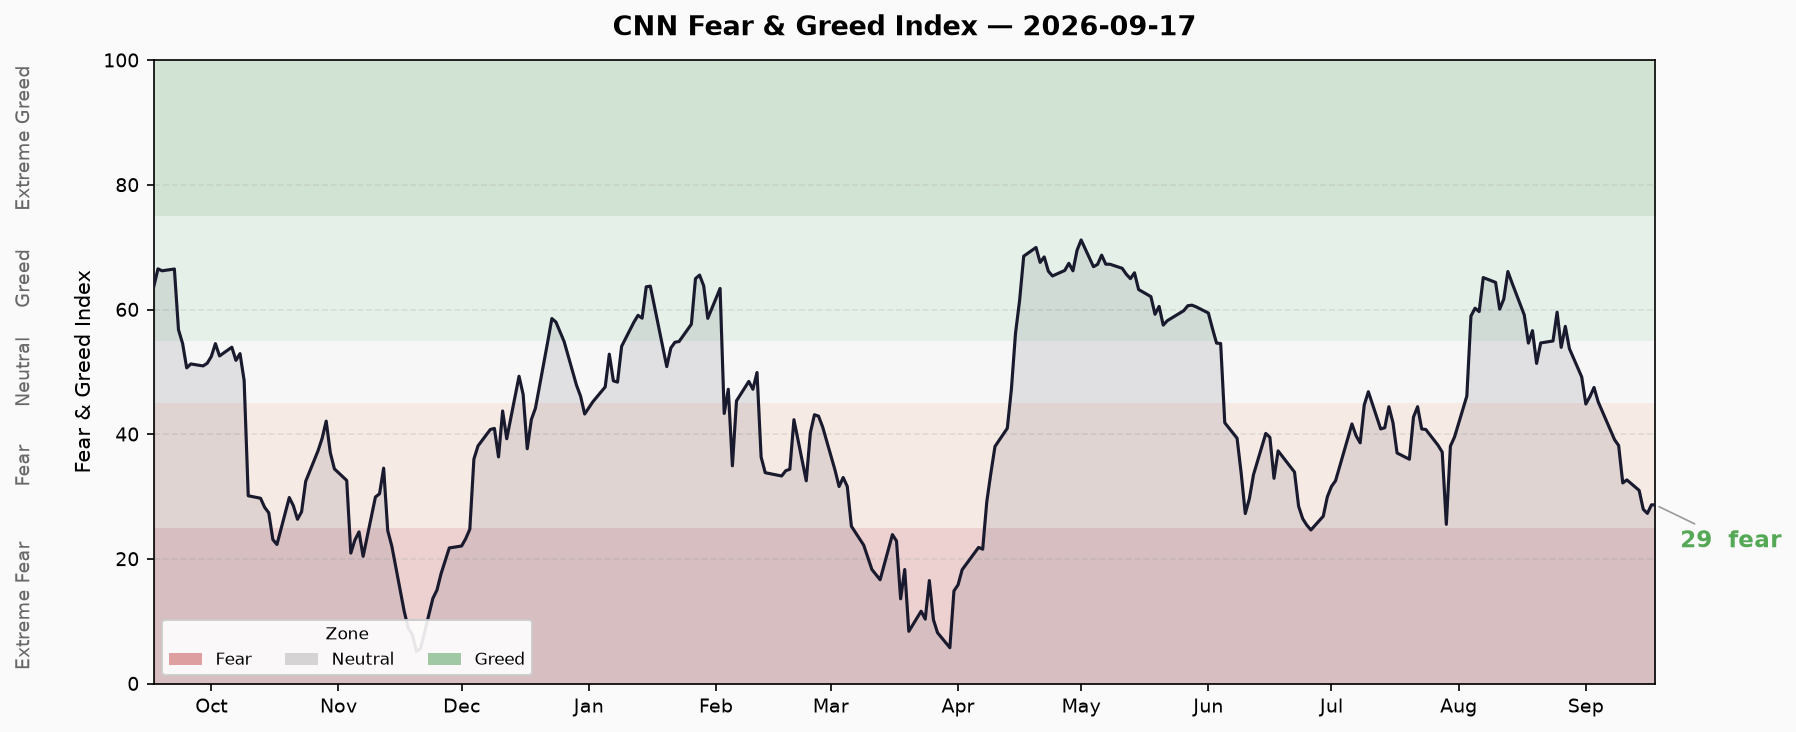
Run date: 2026-09-18 CST. Market data as of 2026-09-17 (US close). CNN F&G Composite: 28.69 (Fear), 9th consecutive trading day in fear zone. S&P 500 at ~7638 (near all-time high) but breadth/momentum sub-indicators deep in fear — narrow rally + high leverage + broad fear divergence structure.
CNN Fear & Greed Sentiment Cross-Verification Daily Report
Run Date: 2026-09-18 (Beijing Time CST) Market Data As Of: 2026-09-17 (US Eastern Close) Data Status: F&G composite and seven sub-indicator groups updated in real-time. Crisis cross-verification: HY OAS/IG OAS/treasuries as of 2026-09-16, margin debt as of 2026-04 (FINRA monthly), IPO/ETF flows are 2026 YTD cumulative.
1. Changes This Period & Carry-Forward Status
Composite Index: 28.69 (Fear), +2.20 points from prior day’s 26.49. Within this week, rebounded from 9/15 extreme fear at 22.33 back into fear zone, but has not returned to neutral.
Carry-forward status:
- Consecutive fear trading days: 9 days (since 9/8, no neutral-or-above day in between)
- One-week ago 32.20 → One-month ago 59.14 → One-year ago 63.77: monthly decline -51.5 points, showing sharp shift from greed to fear
- S&P 500 ~7638: absolute level in all-time high range, forming significant divergence with fear sentiment
2. Composite Index Trend
| Metric | Value |
|---|---|
| Current Composite | 28.69 (Fear) |
| Prior Day Close | 26.49 |
| Daily Change | +2.20 (+8.3%) |
| Consecutive Fear Days | 9 trading days |
| Sample Minimum | 5.17 (2025-11-20) |
| Sample Data Points | 252 trading days |
| Data Timestamp | 2026-09-17T22:10:56 UTC |
Last 10 Trading Days Sequence:
| Date | Composite | Rating |
|---|---|---|
| 2026-09-04 | 45.23 | Neutral |
| 2026-09-08 | 39.14 | Fear |
| 2026-09-09 | 38.20 | Fear |
| 2026-09-10 | 32.20 | Fear |
| 2026-09-11 | 32.69 | Fear |
| 2026-09-14 | 31.00 | Fear |
| 2026-09-15 | 27.97 | Fear |
| 2026-09-16 | 27.31 | Fear |
| 2026-09-17 | 28.69 | Fear |
Note: Gap between 9/4 and 9/8 due to weekend/holiday. 9/4 still neutral (45.23), 9/8 drops sharply to fear (39.14), indicating sentiment shift during 9/5-9/7.
Trend Assessment: Sustained decline since 9/4, from 45.23 (neutral-leaning-greed) to 28.69 (fear), down -16.5 points over 10 trading days. 9/15 hit stage low 22.33 (extreme fear) followed by slight rebound, but 9 consecutive days failed to return above neutral.
3. Seven Sub-Indicators Detail
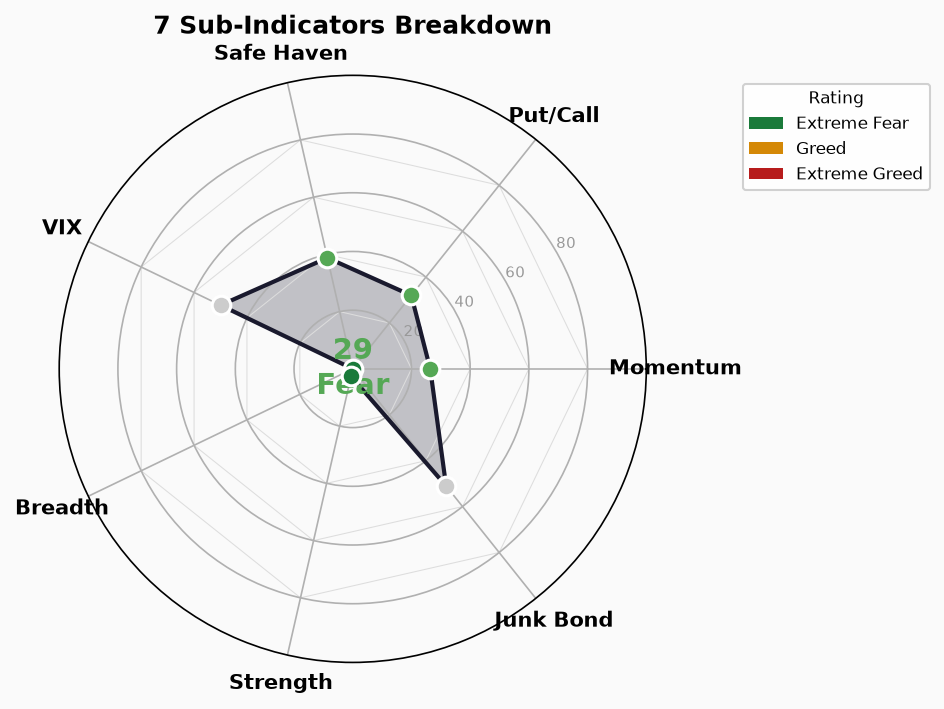
| Sub-Indicator | Score | Rating | Raw Value | Unit | As Of | Change |
|---|---|---|---|---|---|---|
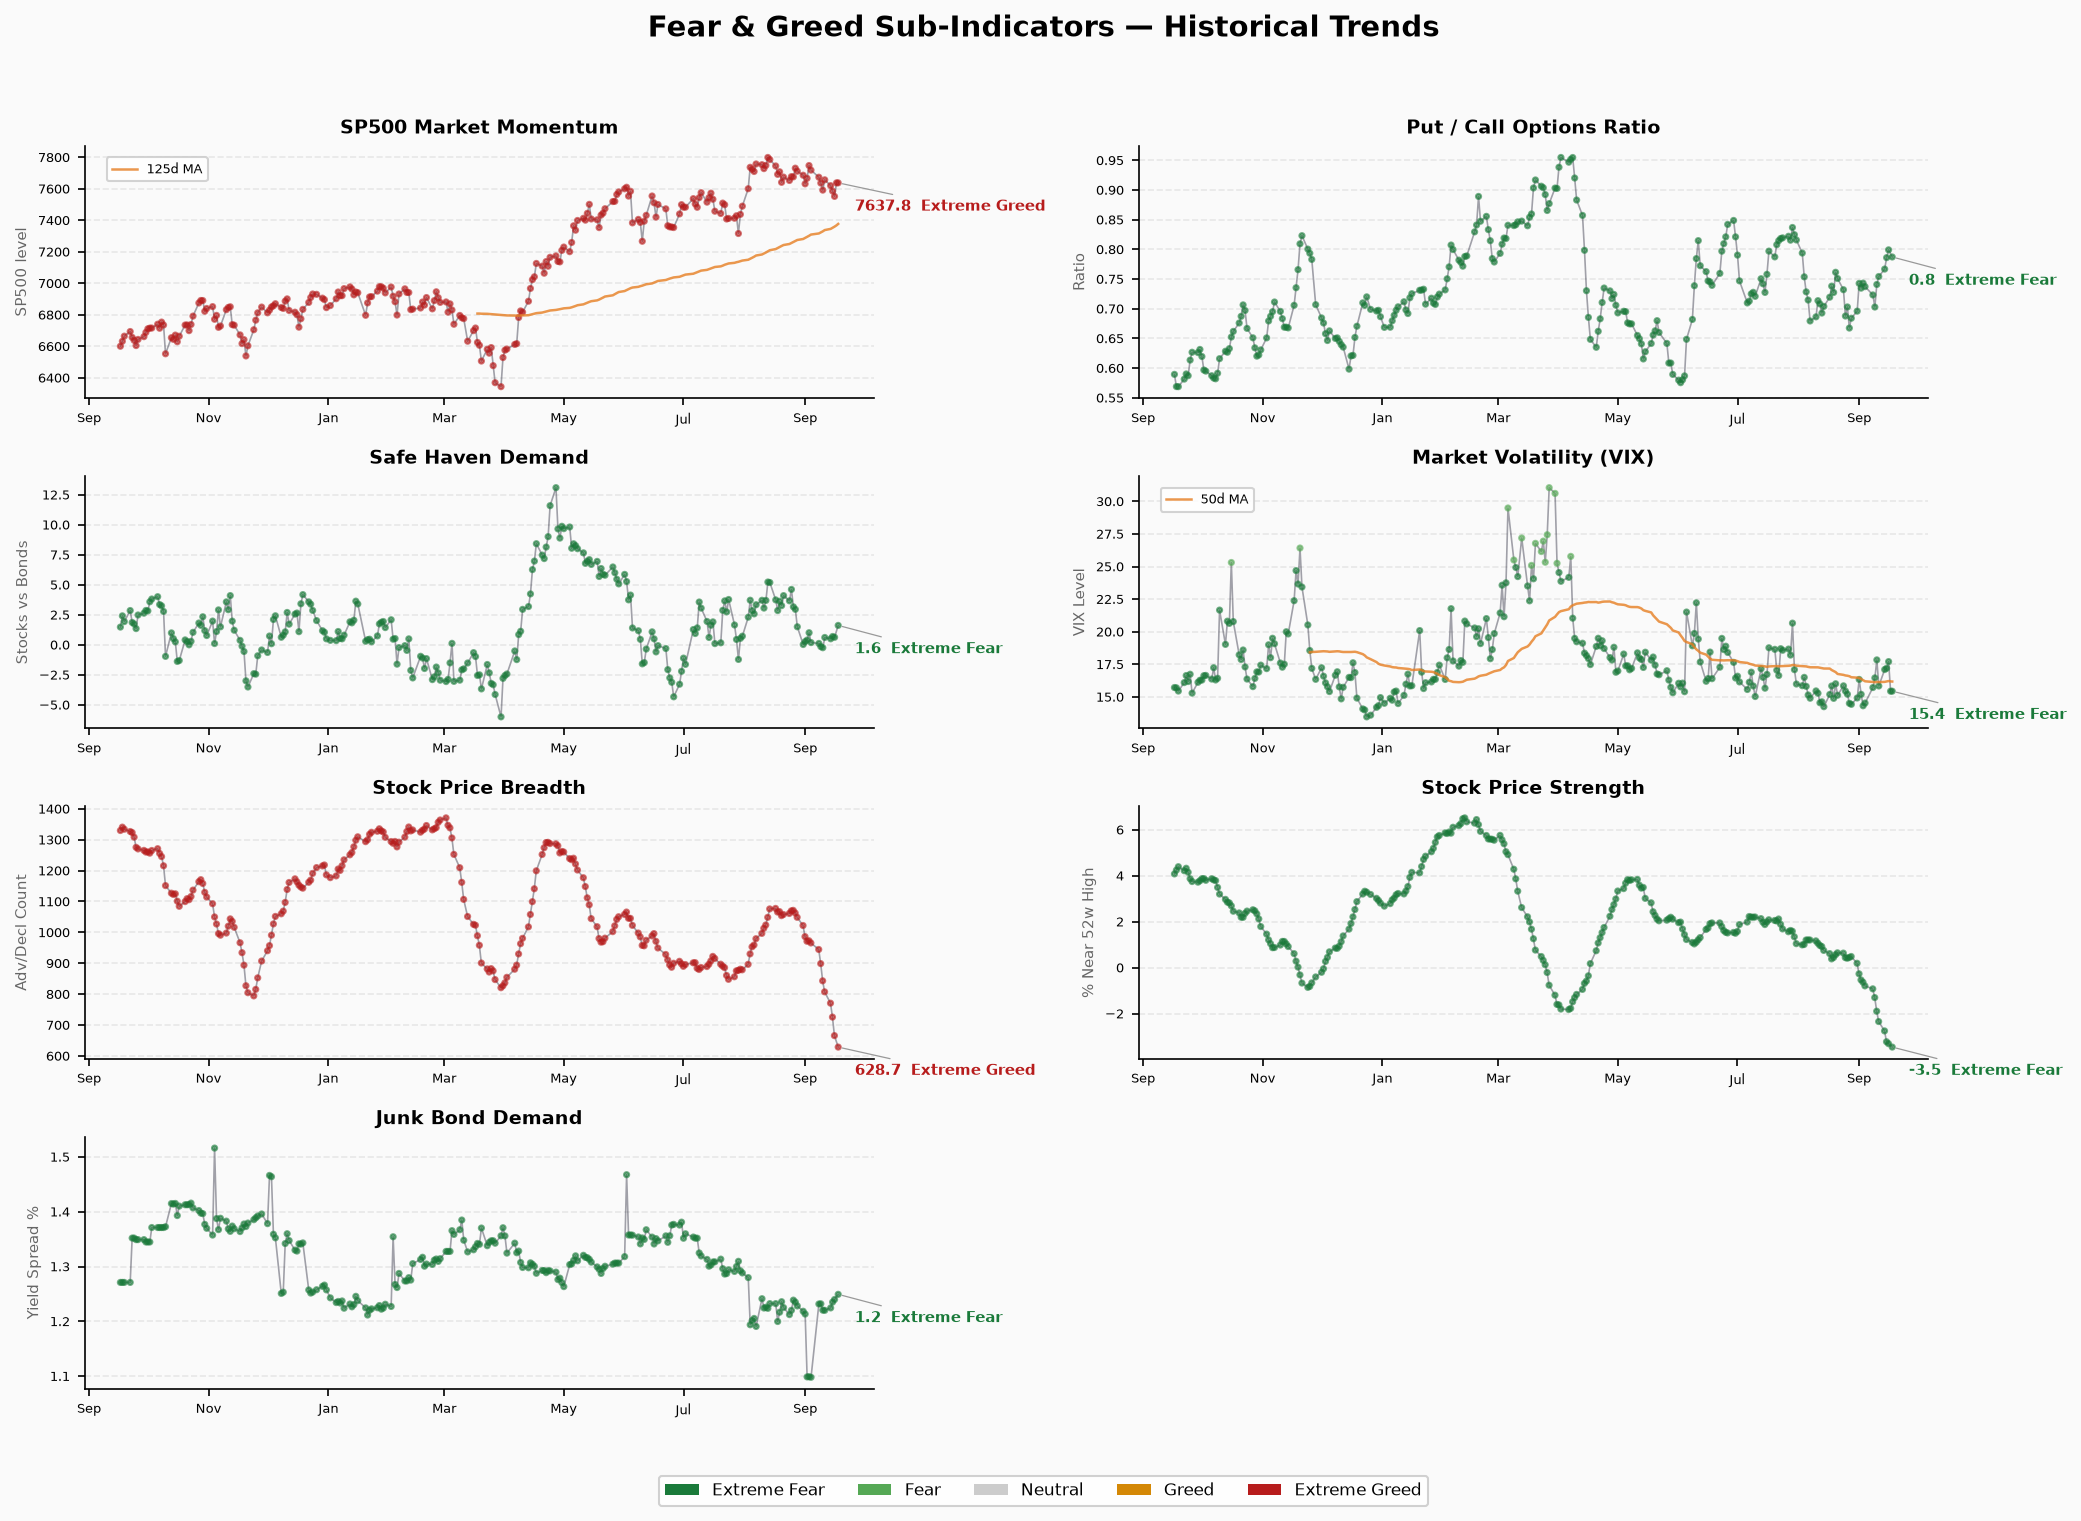
| S&P 500 Momentum | 26.4 | Fear | 7637.76 | Points | 2026-09-17 | — |
| S&P 125 Momentum | 26.4 | Fear | 7367.99 | Points | 2026-09-17 | — |
| Stock Price Strength | 2.6 | Extreme Fear | -3.46 | Strength | 2026-09-17 | — |
| Stock Price Breadth | 0.0 | Extreme Fear | 628.66 | Advancers | 2026-09-17 | — |
| Put/Call Ratio | 32.0 | Fear | 0.79 | PCR | 2026-09-17 | — |
| VIX Volatility | 50.0 | Neutral | 15.44 | Points | 2026-09-17 | — |
| VIX 50-Day Relative | 50.0 | Neutral | 16.19 | Points | 2026-09-17 | — |
| Junk Bond Demand | 51.0 | Neutral | 1.25 | OAS | 2026-09-17 | — |
| Safe Haven Demand | 38.8 | Fear | 1.62 | Treasury Spread | 2026-09-17 | — |
Score Mapping Reference: 0-10 Extreme Fear | 10-25 Fear | 25-45 Fear | 45-55 Neutral | 55-75 Greed | 75-90 Extreme Greed | 90-100 Extreme Greed
Key Observations:
- Breadth at floor (0.0): Only 628 advancers, score locked at extreme fear minimum. Core drag on this F&G drop.
- Strength -3.46 (Extreme Fear): Stock selection dimension broadly negative.
- VIX 15.44 (Neutral): Implied volatility still in low range, diverging from breadth fear — index weight support + stock divergence structure.
- PCR 0.79 (Fear): Put options relatively active, but not at extreme levels (>1.0 typically panic signal).
- Junk Bond OAS 1.25 (Neutral): Credit spreads not widening, corporate bond market showing no panic.
4. Divergence Explanations & Counter-Evidence
Core Divergence: S&P 500 ~7638 (all-time high range) vs. F&G 28.69 (fear)
Explanation 1 — Narrow Rally: Index driven by few large-cap weighted stocks, breadth only 628 advancers. Similar to Oct 2023 AI rally early phase (NVDA/MSFT pulling index but breadth weak) and early 2021 patterns.
- Supporting evidence: Breadth 0.0 (extreme fear) + Strength -3.46 + S&P 125 momentum consistently low
- Counter-evidence: VIX 15.44 not elevated — if narrow-rally pre-crack precursor, VIX usually rises first
Explanation 2 — Volatility Mean Reversion: VIX dropped from highs to ~15, options pricing has “digested” the volatility, but breadth/momentum hasn’t recovered.
- Supporting evidence: VIX 50-day relative 16.19, near recent mean
- Counter-evidence: Breadth persistently low — if short-term panic recovery phase, breadth should rebound first
Explanation 3 — Data口径 Differences: S&P 500 level is latest close, but breadth/strength data may come from different trading days or different statistical methodology.
- To verify: All sub-indicator timestamps are 2026-09-17, dates consistent. But need to confirm breadth data excludes non-S&P 500 constituents.
Current Assessment: Narrow rally is most likely explanation. Index at new high but breadth at floor — classic “breadth head” signal, historically appearing near阶段性 tops multiple times. But low VIX again means market hasn’t priced significant downside risk.
5. Credit/Rate/Leverage Cross-Verification
| Cross-Indicator | Value | As Of | Status | Source |
|---|---|---|---|---|
| HY OAS (High Yield Spread) | 2.70% | 2026-09-16 | 🟢 Normal | FRED / scripts |
| IG OAS (Investment Grade) | 0.78% | 2026-09-16 | 🟢 Normal | FRED / scripts |
| 10Y Treasury Yield | 5.01% | 2026-09-16 | — | FRED / scripts |
| 2Y Treasury Yield | 4.74% | 2026-09-16 | — | FRED / scripts |
| 30Y Treasury Yield | 5.35% | 2026-09-16 | — | FRED / scripts |
| 10Y-2Y Spread | +0.27% | Same-day calc | Re-steepening | Computed |
| 10Y-30Y Spread | -0.34% | Same-day calc | Long-end inversion | Computed |
| Margin Debt | $1.304T | 2026-04 | 🔴 All-time high | FINRA |
| IPO Count (YTD) | ~73 | 2026 YTD | 🟢 Below avg | Renaissance Capital |
| ETF Net Inflows (YTD) | $856B | 2026 YTD | 🔴 Record | ICI / scripts |
Cross-Verification Conclusion:
Credit markets calm: HY OAS 2.70% well below 3% warning line, IG OAS 0.78% normal. Corporate bond market not pricing rising default risk. — Inconsistent with F&G fear.
Yield curve mixed signals: 10Y-2Y +27bp shows short-end rate cut expectations (re-steepening), but 10Y-30Y -34bp long-end inversion still unresolved. — Recession signal partially eased but not eliminated.
Leverage risk prominent: Margin debt $1.304T at all-time high range (FINRA latest monthly 2026-04). High leverage + narrow rally = if breadth doesn’t expand, leveraged longs could become cascade source.
Passive capital record: ETF YTD inflows $856B record. — Passive buying can explain index new high but breadth weakness divergence.
IPO subdued: YTD only 73 deals, well below historical average (~350-450). — Primary market sentiment cold, consistent with secondary market fear.
Overall Cross-Verification Rating: Credit no alarm + Rates neutral + Leverage warning + Passive capital high = Structural risk accumulating, but no immediate crisis signal.
6. Conditions for Risk Upgrade or De-escalation
Signals to watch for risk upgrade:
- VIX spikes from 15 to above 20 rapidly
- Breadth continues below 500 advancers (width deterioration)
- HY OAS breaks above 3.5% from 2.70% (credit spread widening)
- Margin debt shows forced liquidation signals during breadth deterioration (margin call cascade)
Signals to watch for risk de-escalation:
- F&G returns to 45+ (neutral zone)
- Breadth rebounds to 1200+ advancers (majority of S&P 500 constituents up)
- VIX stabilizes at 15-18 without rising (volatility not amplifying)
- Junk bond OAS maintains 1.0-1.0 low range (credit market remains calm)
7. Data Limitations
- Margin debt lag: FINRA monthly release, latest is 2026-04, 5 months from current. Significant changes may have occurred.
- IPO/ETF are YTD cumulative: Do not reflect this week’s changes.
- CNN F&G raw values not publicly disclosed: Sub-indicator raw values computed by internal script formula, may deviate from CNN official methodology.
- S&P 500 breadth statistical scope: Script’s advancer/descender count may include non-S&P 500 constituents; needs cross-verification with CNBC/TicketData official data.
- Treasury yield same-source verification: 10Y-2Y spread computed from FRED data pulled by same script, consistent methodology, but not real-time (as of 9/16).
- VIX may differ from CNN official source: Script uses yfinance
^VIX, CNN official uses CBOE data — typically highly correlated but occasional discrepancies.