CNN Fear & Greed Sentiment Analysis 2026-09-16
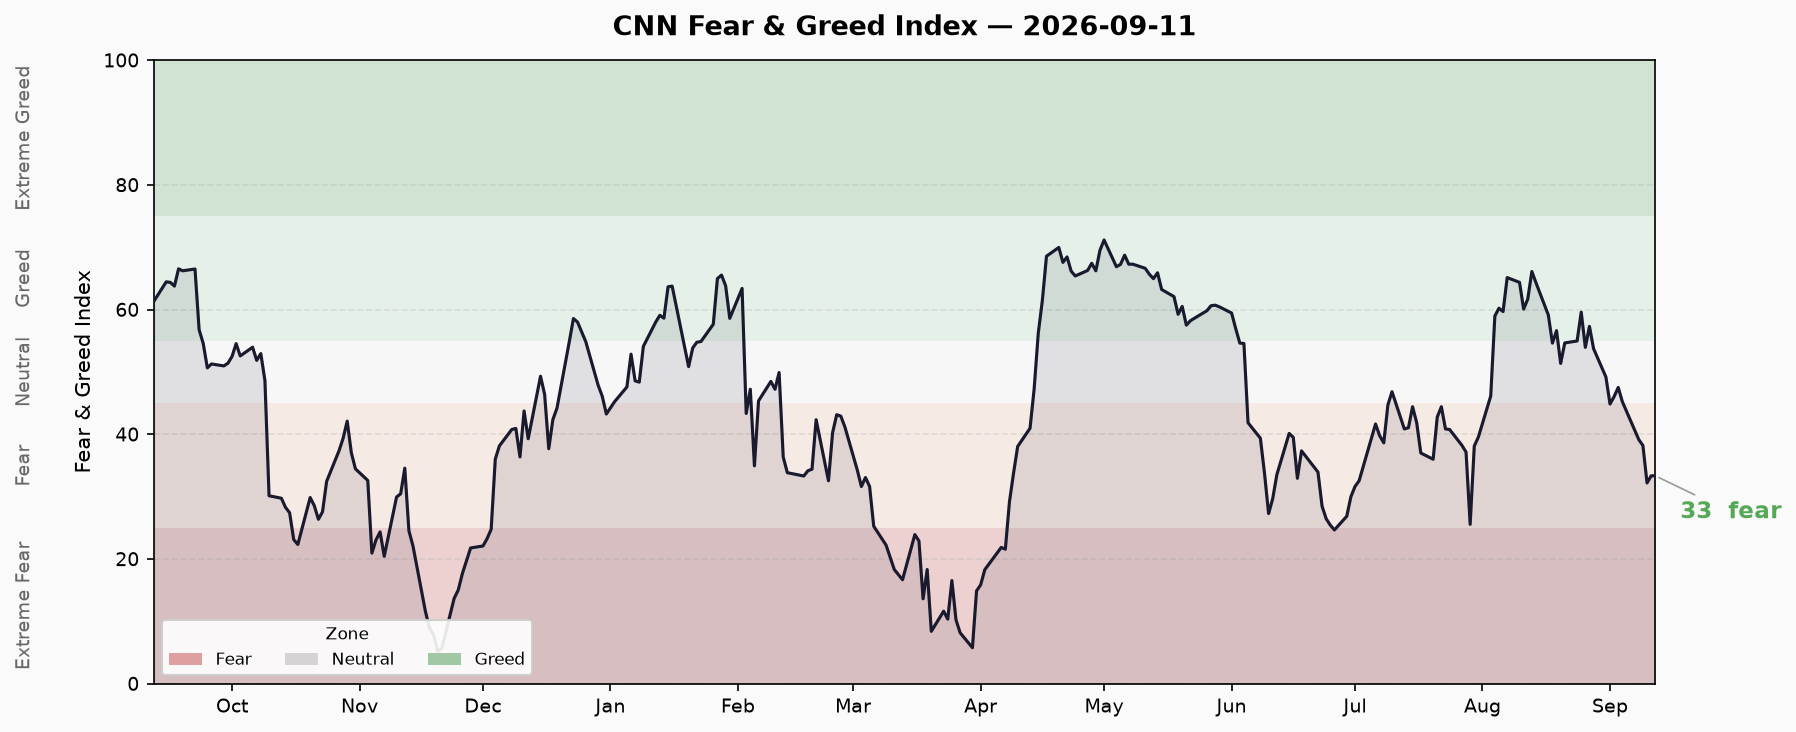
Run at 2026-09-16 06:30 CST. Data as of 2026-09-11 (US ET). CNN FNG composite at 33.3 (Fear), 4 consecutive fear days, down 31 points from 64.3 one month ago. Market momentum, stock strength, and breadth all declining; credit spreads easing offset by record leverage and ETF inflows.
CNN Fear & Greed Sentiment Analysis — 2026-09-16
Run Time: 2026-09-16 06:30 CST (Wednesday) Data As-of: 2026-09-11 (US ET, Thursday close) Sources: CNN Fear & Greed script + FRED + FINRA + Renaissance Capital Last Update: 2026-09-09 — This report covers 09-10 and 09-11 trading days
Changes Since Last Report and Continuations
Updated trading days: 09-10 (32.2), 09-11 (33.3). No new data for 09-12 (Friday) or the weekend; 09-11 values carried forward.
Key changes:
- FNG dropped from 53.7 (Neutral) on 08-28 to 33.3 (Fear) on 09-11, down 20.4 points in 10 trading days.
- Down 31 points from one month prior (08-14, 64.3, Greed), completing a full Greed-to-Fear transition.
- 09-11 marginally up from 09-10 (+1.1, 32.2 → 33.3), but still in Fear territory.
- Consecutive fear days: 4 trading days (09-08 through 09-11).
Continuations:
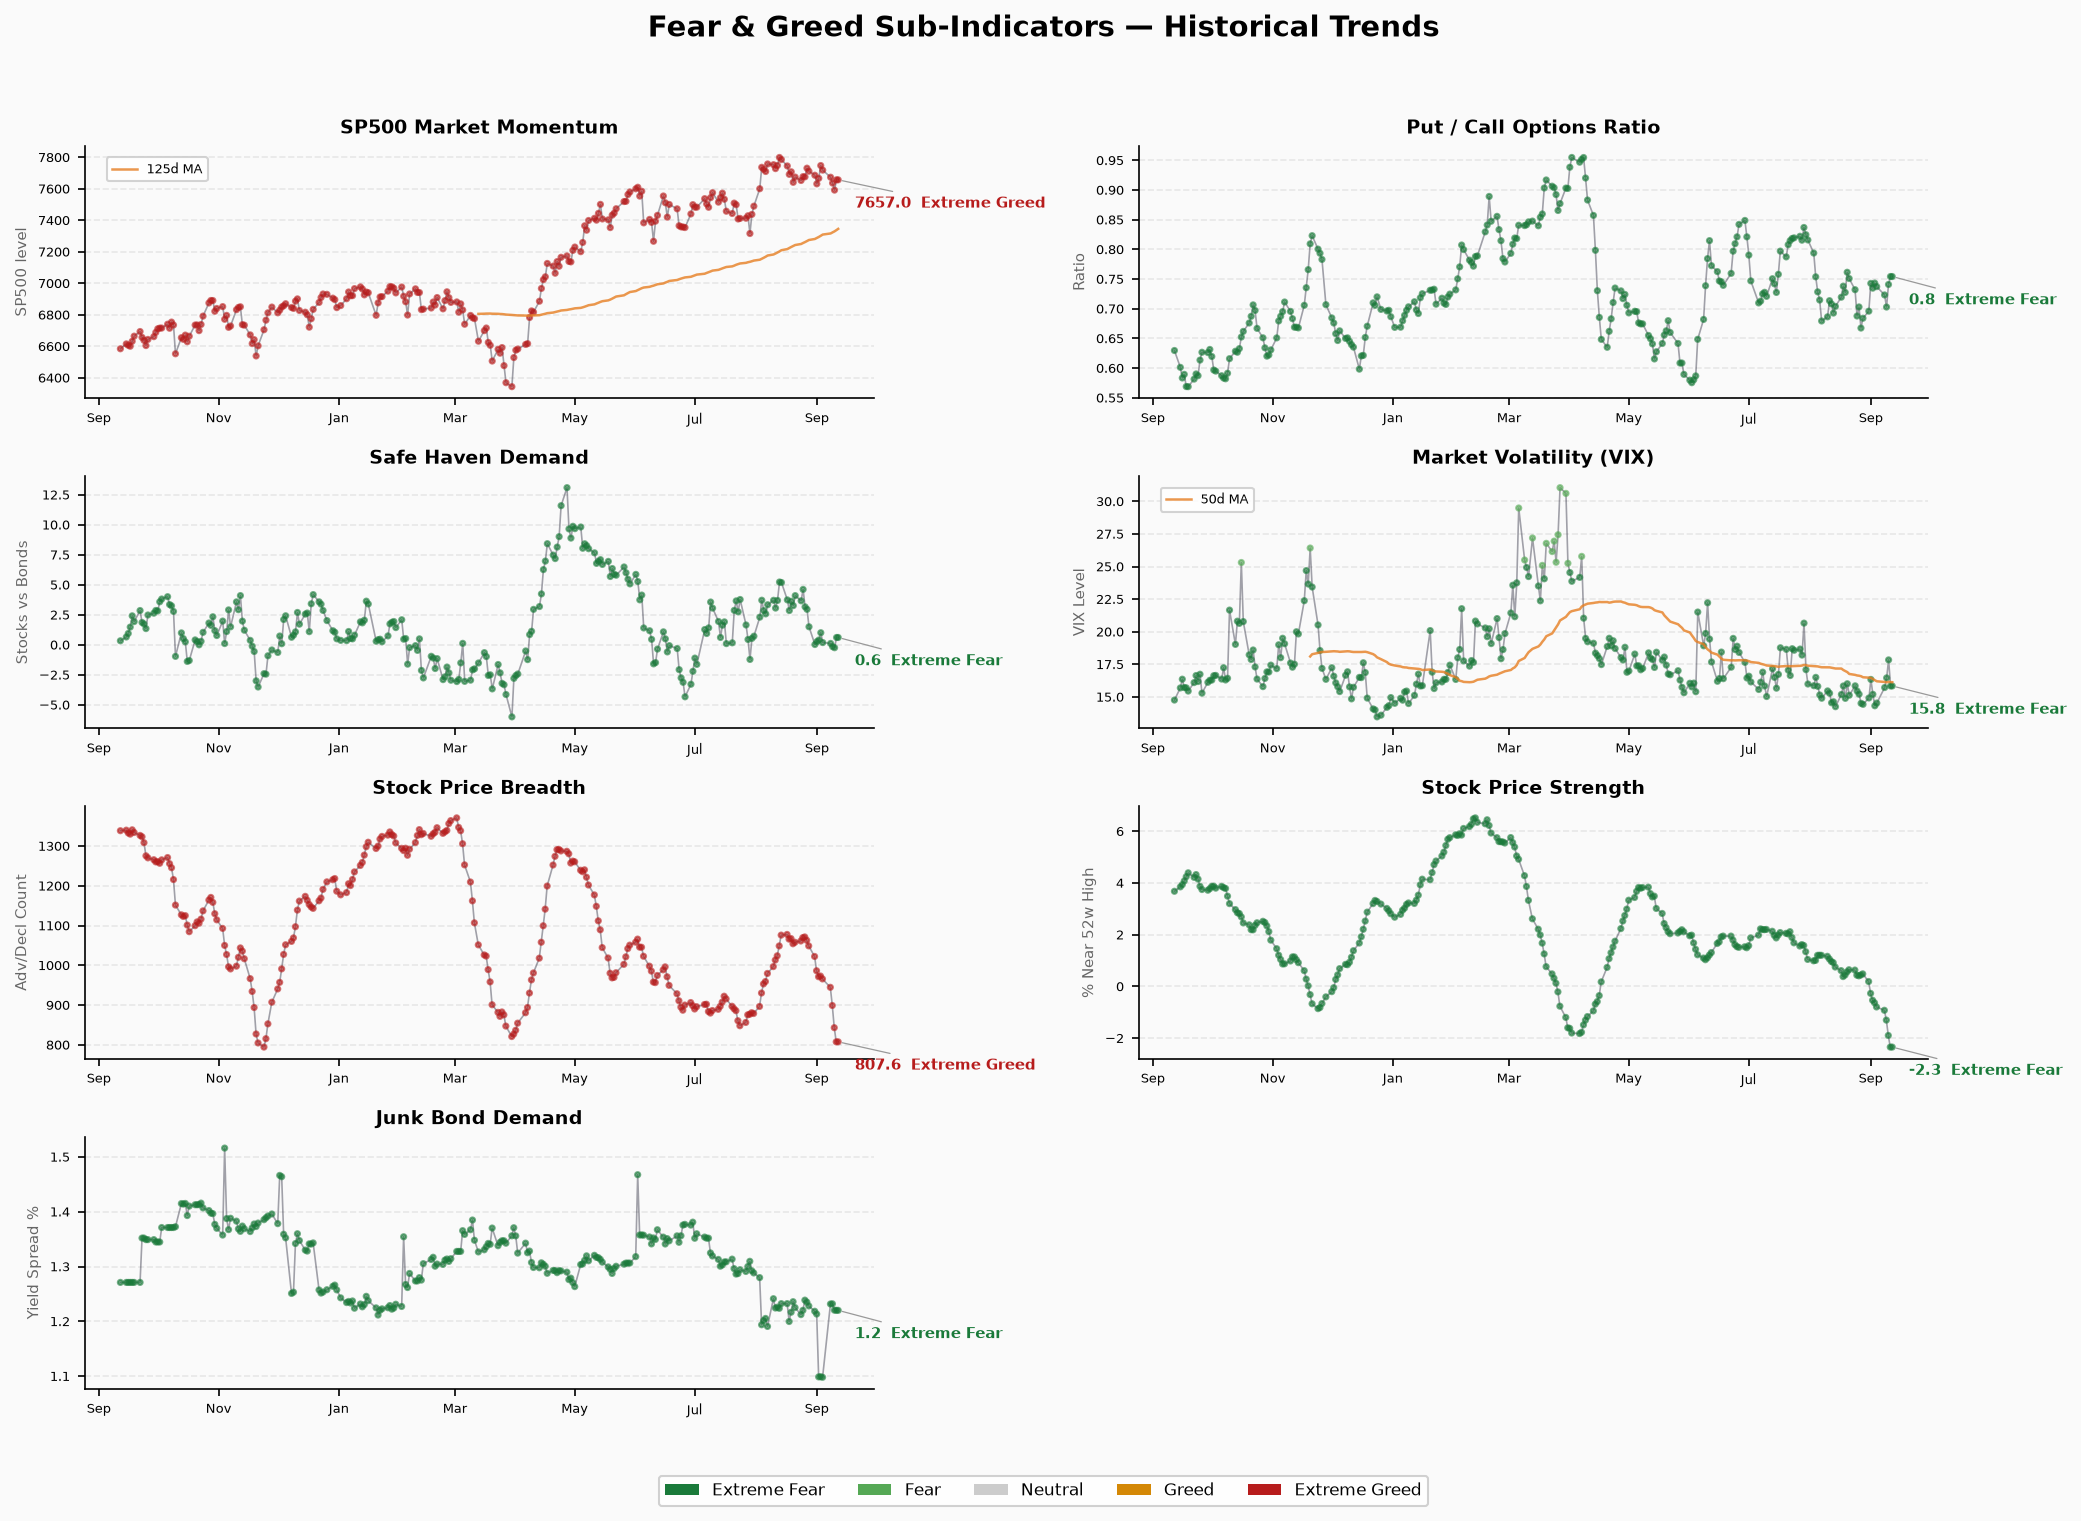
- Stock price strength continues deteriorating: -0.79 → -2.34, deepening in Extreme Fear.
- HY bond spread holds at 1.22% (Greed range), recovering since September 1 panic.
- VIX fell from 17.84 on 09-10 to 15.84, still above mid-August levels.
Composite Index Trend
| Metric | Value |
|---|---|
| Current Composite | 33.3 (Fear) |
| Previous Close | 33.1 |
| One Week Ago | 45.2 |
| One Month Ago | 64.3 |
| One Year Ago | 64.5 |
| Sample Min | 5.2 (2025-11-20) |
| Consecutive Fear Days | 4 days (09-08 ~ 09-11) |
| 10-Day Trend | Down 20.4 points |
Last 20 trading days:
| Date | Score | Rating |
|---|---|---|
| 08-14 | 64.3 | Greed |
| 08-17 | 59.1 | Greed |
| 08-18 | 54.6 | Neutral |
| 08-19 | 56.6 | Greed |
| 08-20 | 51.4 | Neutral |
| 08-21 | 54.7 | Neutral |
| 08-24 | 55.0 | Neutral |
| 08-25 | 59.6 | Greed |
| 08-26 | 53.9 | Neutral |
| 08-27 | 57.3 | Greed |
| 08-28 | 53.7 | Neutral |
| 08-31 | 49.2 | Neutral |
| 09-01 | 44.9 | Fear |
| 09-02 | 46.1 | Neutral |
| 09-03 | 47.5 | Neutral |
| 09-04 | 45.2 | Neutral |
| 09-08 | 39.1 | Fear |
| 09-09 | 38.2 | Fear |
| 09-10 | 32.2 | Fear |
| 09-11 | 33.3 | Fear |
FNG first dropped into Fear on 09-01, briefly bounced to Neutral on 09-02 to 09-04, then declined again from 09-08 and held.
Seven Sub-Indicator Table
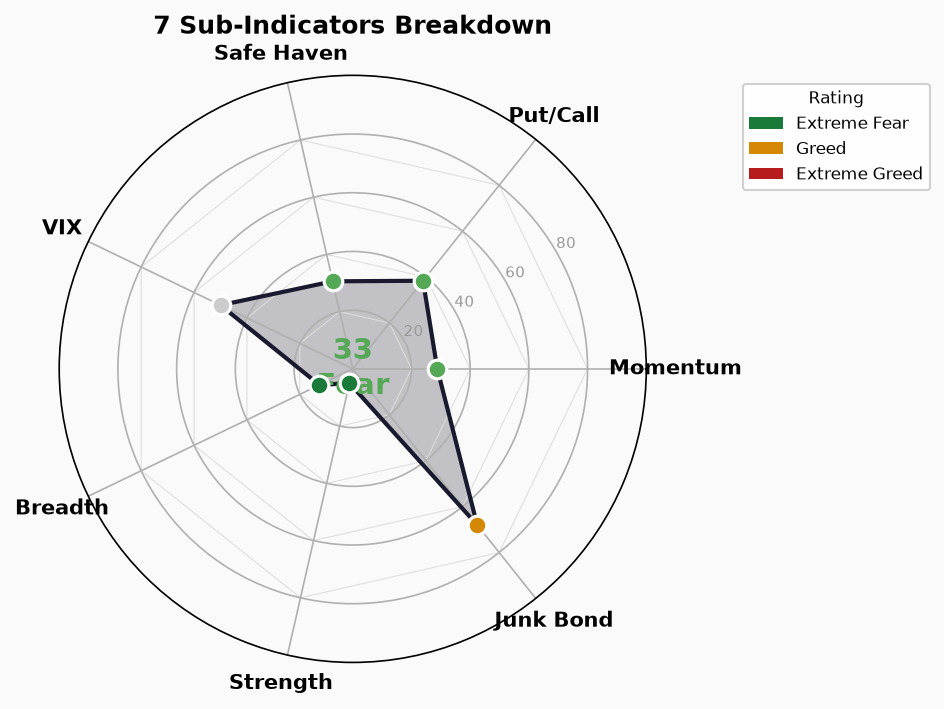
Data as of 2026-09-11. Individual indicator timestamps vary slightly (different collection times).
| Sub-Indicator | Score | Rating | Raw Value | Unit | As-of | 5d Change |
|---|---|---|---|---|---|---|
| SP500 Momentum | 28.8 | Fear | 7,656.98 | Index level | 09-11 | -61.6 ↓ |
| Stock Strength | 5.0 | Extreme Fear | -2.34 | % advance-decline | 09-11 | -1.55 ↓ |
| Stock Breadth | 12.6 | Extreme Fear | 807.56 | Advance count | 09-11 | -158.2 ↓ |
| Put/Call Ratio | 38.4 | Fear | 0.75 | Put/Call ratio | 09-11 | +0.02 ↑ |
| VIX Volatility | 50.0 | Neutral | 15.84 | VIX index | 09-11 | +1.31 ↑ |
| HY Bond Demand | 68.0 | Greed | 1.22 | OAS % | 09-11 | +0.12 ↑ |
| Safe Haven Demand | 30.6 | Fear | 0.61 | Relative return | 09-11 | +0.42 ↑ |
Divergence signals: HY bond demand (68, Greed) is the only sub-indicator in Greed, contrasting sharply with the other six in Fear/Extreme Fear. VIX at 15.84 (Neutral) is notably weaker than the Extreme Fear readings on stock strength and breadth.
Divergence Explanations and Counter-Evidence
1. Credit vs Equity Divergence (HY OAS 1.22% = Greed, Equities = Fear)
Explanation: HY OAS widened slightly from its September 1 extreme low (~1.10%) to 1.22%, still within the <3% normal range. Credit markets have not followed equity deterioration, suggesting no panic selling in credit, and corporate default risk pricing remains accommodative.
Counter-evidence: The HY OAS move from 1.10% to 1.22% is only 12bp, within noise. This is insufficient as definitive evidence of “healthy credit markets.” If equity weakness persists, credit spreads may widen subsequently.
2. VIX (15.84, Neutral) vs Stock Strength (-2.34, Extreme Fear)
Explanation: VIX at 15-16 is historically low, rated Neutral. But stock strength (advance-decline differential) has deteriorated to -2.34, showing severe internal divergence — index-level volatility is muted but individual stocks are broadly declining.
Counter-evidence: Low VIX may reflect options pricing a “short-term pullback but not crisis” scenario. Low VIX + weak breadth is a typical “moderate correction” signal, not a crash precursor. If VIX starts rising while breadth continues deteriorating, caution is warranted.
3. PCR (0.75, Fear) Relatively Stable
Explanation: PCR has narrowed between 0.70-0.75, showing consistently elevated put demand as market participants hedge tail risk. But PCR has not spiked further, indicating no new panic buying of puts.
Credit / Rate / Leverage Cross-Verification
| Indicator | Value | Date | Status | Source |
|---|---|---|---|---|
| HY OAS | 2.71% | 09-14 | 🟢 Normal | FRED |
| IG OAS | 0.80% | 09-14 | 🟢 Normal | FRED |
| 10Y Yield | 4.97% | 09-14 | — | FRED |
| 2Y Yield | 4.65% | 09-14 | — | FRED |
| 10Y-2Y Spread | +0.33% | 09-14 | 🟢 Normal, flat | Calculated |
| 30Y Yield | 5.34% | 09-14 | — | FRED |
| Margin Debt | $1.304T | Apr 2026 | 🔴 Record high | FINRA |
| IPOs (YTD) | ~73 | 2026 | 🔴 Active | Renaissance Capital |
| ETF Net Inflow (YTD) | $8,560B | 2026 | 🔴 Record | Script constant |
Cross-verification conclusion:
- Credit spreads (HY 2.71%, IG 0.80%) and yield curve (10Y-2Y +33bp) are in normal ranges, no rate-side stress signals.
- Margin debt at $1.304T (April 2026) at historical highs, combined with YTD ETF inflows of $8,560B at record levels, leverage and fund inflows are at extreme levels.
- This is a classic “bad sentiment in a good fundamental environment” setup — fundamentals and credit conditions have not deteriorated, but market sentiment has turned fearful. In this configuration, downside risk comes from leveraged unwinding, not credit events.
Conditions for Risk Upgrade or De-escalation
Risk upgrade signals (to watch):
- HY OAS breaks above 3% → credit markets begin pricing default risk
- VIX breaks above 20 → volatility enters警戒 range
- Stock breadth falls below 800 → breadth deterioration confirmed
- Margin debt rises further (latest is April data) → leverage continues accumulating
- FNG drops below 20 → approaching November 2025 extreme fear levels
Risk de-escalation signals (observable):
- FNG rises above 40 (back to Neutral) → sentiment recovery
- Stock breadth recovers to 900+ → breadth improvement
- VIX falls below 14 → volatility further cools
- HY OAS stays below 2% → credit remains accommodative
Data Limitations
- Margin Debt: FINRA latest only through April 2026 ($1.304T); subsequent months missing. Status annotation based on historical range inference.
- IPO/ETF Data: YTD figures from Renaissance Capital and script constants, not independently verified in real-time.
- CNN FNG Sub-Indicator Scores: Script internally maps raw values to 0-100 scores; ratings bind to score ranges. VIX raw 15.84 mapped to 50 (Neutral), PCR raw 0.75 mapped to 38.4 (Fear) — mapping logic is script constants, not independently verified.
- SPX Level: Script’s SP500 momentum raw value of 7,656.98 needs cross-verification with external source (no real-time SPX quote available for cross-check at this time).
- 09-12 (Friday) and Weekend: No new trading day data; FNG carries forward 09-11 values.