CNN Fear & Greed Sentiment Analysis 2026-09-15
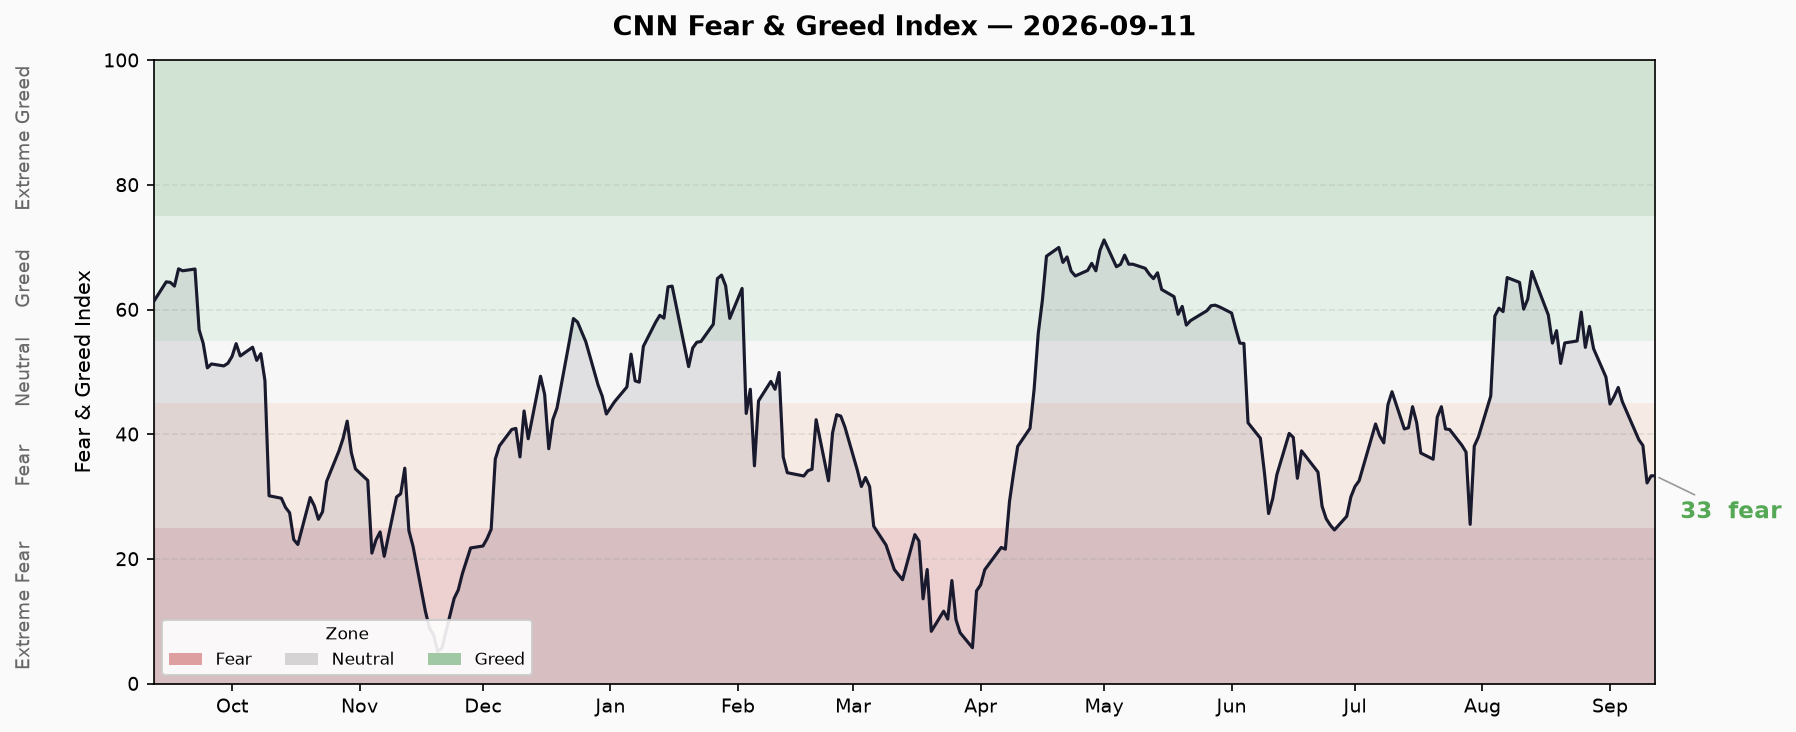
CNN Fear & Greed Index reading as of 2026-09-11: 33.34 (Fear), 9 consecutive trading days below 50. 10-day trend down -20.4 points from Neutral 64.45 on 8/28. Stock price strength (5, Extreme Fear) and breadth (12.6, Extreme Fear) weakest sub-indices; VIX at 15.84 in Neutral zone, but 50-day relative still flags Fear. Credit spreads normal (HY OAS 2.65%), but margin debt and ETF inflows at records signal leverage risk. Data as of 9/11; 9/14 reading not yet updated.
CNN Fear & Greed Sentiment Analysis — 2026-09-15
Run Date: 2026-09-15 (Tuesday, 06:30 Beijing Time) Data As Of: 2026-09-11 (Friday, US Eastern close) Note: The 9/14 FNG reading has not yet been written to the historical series. All figures below reflect the latest verifiable data as of 9/11.
1. Changes This Period & Sustained Signals
Composite Index: 33.34 (Fear), up +1.14 from the prior observation on 9/10 (32.20).
- The script reports
previous_close=33.11, which conflicts with the historical series value of 32.20 on 9/10. Using the deduplicated historical series as source of truth, 9/11 rose approximately +1.1 point from 9/10. - Ten trading days ago (8/28) the composite was 53.74 (Neutral). Cumulative decline: -20.4 points, a rapid descent from Neutral into Fear territory.
- Sample minimum: 5.17 (2025-11-20, Extreme Fear). The current reading remains ~28 points above the historical low.
Consecutive Fear Days: From 8/31 (49.20) to 9/11 (33.34), the composite stayed below 50 for 9 consecutive trading days. Of these, 9/1–9/11 carried a formal Fear rating (<40); 8/31 was borderline Neutral (49.20).
Sustained Signals:
- Market momentum (SP500/SP125) remains in Fear, unchanged.
- Stock price strength and breadth still in Extreme Fear.
- Credit spreads hold in the normal zone (green).
- Leverage signals (margin debt, ETF inflows) persist as red warnings.
2. Composite Index Trend
8/28  53.74  Neutral  ┐
8/31  49.20  Neutral  │
9/01  44.86  Fear     │  Rapid decline
9/02  46.06  Neutral  │
9/03  47.51  Neutral  │
9/04  45.23  Neutral  ├  Low-range consolidation
9/08  39.14  Fear     │
9/09  38.20  Fear     │
9/10  32.20  Fear  ──  Period low
9/11  33.34  Fear  ↑  Mild bounce
The 10-day trend is decisively down. After hitting a period low of 32.20 on 9/10, the composite bounced to 33.34 on 9/11, but remains in Fear territory—no confirmed trend reversal.
3. Seven Sub-Index Details
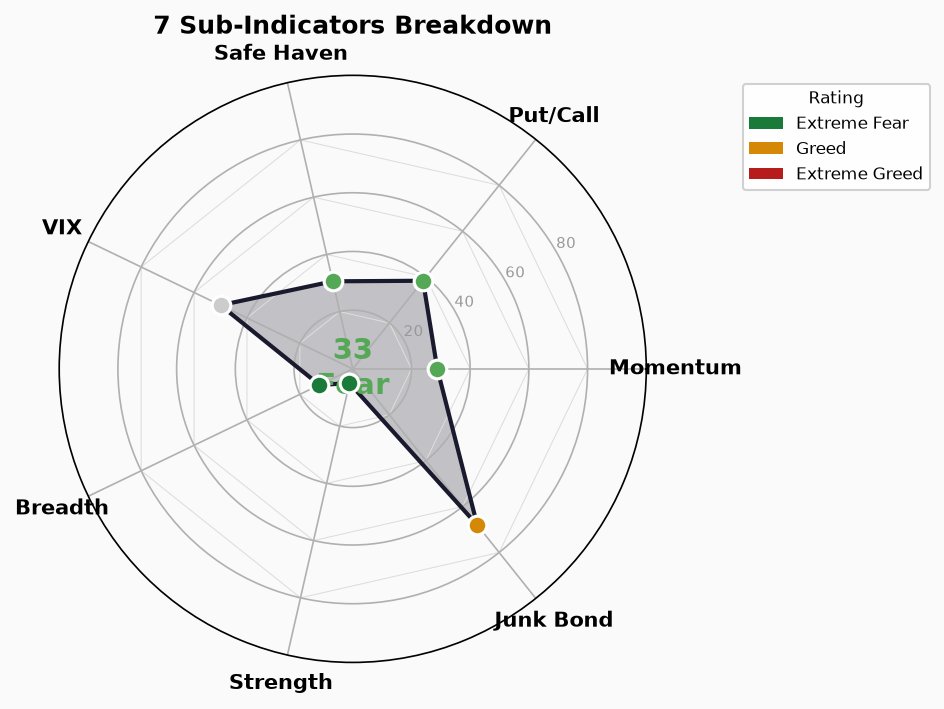
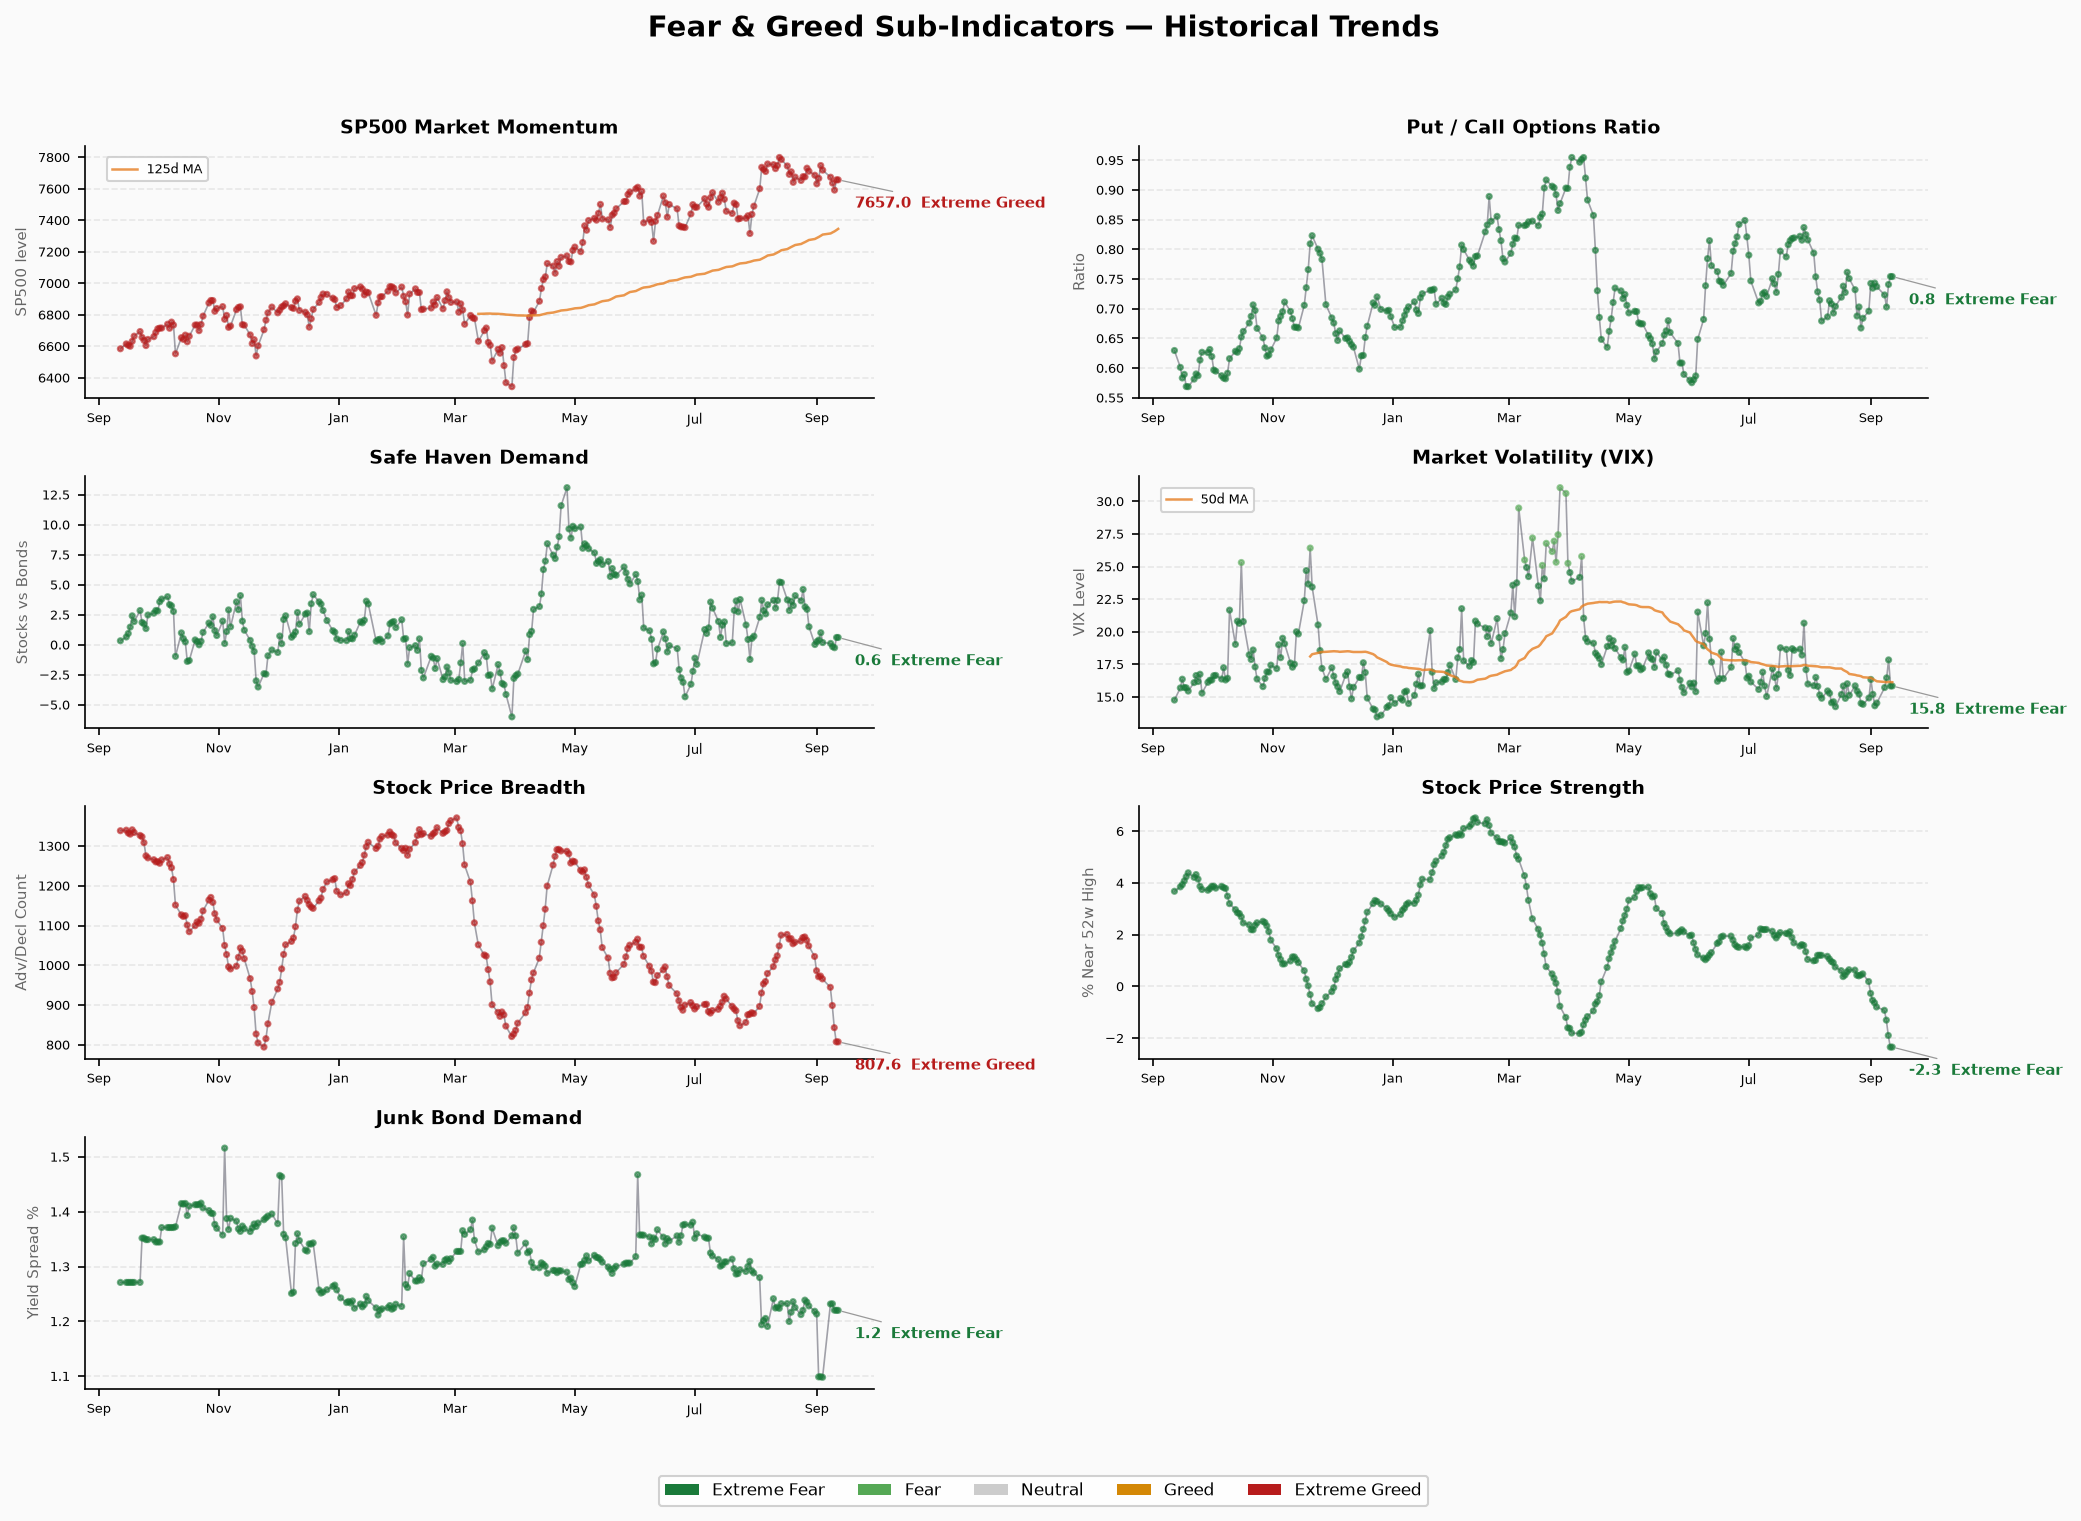
Data as of 2026-09-11. Ratings follow the official score thresholds; raw values are not re-rated.
| Sub-Index | Score | Rating | Raw Value | Unit | As Of | Change |
|---|---|---|---|---|---|---|
| SP500 Momentum | 28.8 | Fear | 7,656.98 | Level (1mo return mapped) | 9/11 | Sustained Fear |
| SP125 Momentum | 28.8 | Fear | 7,338.00 | Level (1mo return mapped) | 9/11 | Sustained Fear |
| Stock Price Strength | 5.0 | Extreme Fear | -2.34 | % relative performance | 9/11 | Sustained Ext. Fear |
| Stock Price Breadth | 12.6 | Extreme Fear | 807.56 | Advancing stocks | 9/11 | Sustained Ext. Fear |
| Options P/C Ratio | 38.4 | Fear | 0.754 | Put/Call Volume Ratio | 9/11 | Sustained Fear |
| VIX | 50.0 | Neutral | 15.84 | Index value | 9/11 | Sustained Neutral |
| VIX 50-day Relative | 50.0 | Neutral | 16.14 | VIX vs 50-day MA | 9/11 | Sustained Neutral |
| Junk Bond Demand | 68.0 | Greed | 1.220 | HY OAS mapped | 9/11 | Sustained Greed |
| Safe Haven Demand | 30.6 | Fear | 0.610 | Equity-bond correlation | 9/11 | Sustained Fear |
Notes:
- VIX at 15.84 sits in the 12–20 Neutral band, forming a clear divergence from most sub-indices in Fear/Extreme Fear.
- Junk bond demand flags Greed (HY OAS 1.22, narrow spread), diverging from Extreme Fear in equity breadth.
- Stock price strength at -2.34% is the weakest sub-index this cycle.
4. Divergences: Possible Explanations & Counter-Evidence
Divergence 1: VIX Neutral vs. Strength/Breadth Extreme Fear
Explanation: VIX at 15.84 does not signal volatility panic. The deterioration in breadth (only 807 SP500 stocks advancing) and strength (-2.34% relative) points to a structural adjustment—capital rotating out of certain sectors into defensive names—rather than systemic panic.
Counter-evidence: If VIX is genuinely not panicking, breadth/strength weakness may be sector rotation, not a crash precursor. However, the 10-day cumulative -20-point drop suggests the adjustment is broadening. Watch for VIX slipping from Neutral into Fear (<12) or breaking above 20.
Divergence 2: Junk Bond Greed vs. Breadth Extreme Fear
Explanation: HY OAS at 1.22 (narrow credit spread) means fixed income markets are still pricing low default risk. Equity breadth worsening while credit markets don’t follow may indicate: (1) corporate fundamentals have not materially deteriorated; (2) flight-to-quality arbitrage from equities into credit.
Counter-evidence: The lead/lag relationship between credit and equity spreads is contested. If equity dislocation deepens and earnings estimates come down, HY OAS will likely widen. Monitor the weekly direction of FRED HY_OAS.
5. Credit / Rate / Leverage Cross-Validation
| Indicator | Value | Source | As Of | Status |
|---|---|---|---|---|
| HY OAS | 2.65% | FRED / crisis_signals | 9/11 | 🟢 Normal |
| IG OAS | 0.80% | FRED / crisis_signals | 9/11 | 🟢 Normal |
| 10Y Yield | 4.96% | FRED / crisis_signals | 9/11 | Info |
| 2Y Yield | 4.63% | FRED / crisis_signals | 9/11 | Info |
| 30Y Yield | 5.35% | FRED / crisis_signals | 9/11 | Info |
| 10Y-2Y Spread | +0.32% | Homogeneous calc. | 9/11 | 🟢 Normal, flat |
| Margin Debt | $1.304T | FINRA | Apr 2026 | 🔴 Near record high |
| IPOs (YTD) | ~73 | Renaissance Capital | 2026 YTD | 🔴 Active |
| ETF Net Inflows (YTD) | $8,560B | Fund industry | 2026 YTD | 🔴 Record |
Interpretation:
- Credit spreads (HY/IG OAS) and the yield curve are in normal zones—no credit crisis signal.
- 10Y-2Y at +0.32% (de-inverted), but 10Y-30Y at -0.39% (long-end inversion). Curve geometry is complex.
- Margin debt at $1.304T (April 2026) sits near all-time highs, compounded by record ETF inflows—elevated leverage.
- High leverage + Fear sentiment = asymmetric downside risk. A trigger event (earnings downgrades, weak macro data) could amplify selling.
6. Conditions for Risk Escalation or De-escalation
Watch for escalation if:
- VIX breaks 20 and holds → implied volatility enters Fear zone
- HY OAS突破 3% → credit markets begin pricing default risk
- Breadth stays below 600 advancing stocks for 5 consecutive days → adjustment broadens from structural to systemic
- Margin debt increases quarter-over-quarter → leverage continues building
Watch for de-escalation if:
- Composite closes above 40 for 3 consecutive days → return to Neutral threshold
- Stock price strength turns positive (>0%) → relative performance improving
- Breadth recovers to 1,200+ advancing stocks → declining breadth收敛
- VIX drops below 14 → volatility compression resumes
7. Data Limitations
- Lag: The FNG historical series last records 9/11; the 9/14 (last Friday) reading has not been updated. 9/15 (today, Monday) is an open session—closing data is not yet available.
previous_closeconflict: The script returns 33.11; the historical series shows 32.20 on 9/10. The source of the discrepancy (intraday snapshot vs. close) is unknown. The historical series is used as the reference.- Margin debt is monthly: FINRA publishes monthly; the latest is April 2026. Interim changes are unknown.
- ETF inflows are YTD cumulative: They do not reflect recent flow velocity; a slowdown in weekly/monthly flows may already be underway.
- VIX data口径: The script uses
market_volatility_vix(absolute VIX) andmarket_volatility_vix_50(relative to 50-day MA). Both score 50 (Neutral), but the raw levels 15.84/16.14 require a longer lookback for context. - Sub-index raw-to-score mapping not independently verified: SP500/SP125 momentum point levels to score conversion depends on the script’s internal logic.
- Safe haven demand (equity-bond correlation) scoring thresholds are not publicly disclosed; score=30.6’s specific meaning requires reference to CNN’s original methodology document.