CNN Fear & Greed Sentiment Analysis 2026-09-12
Run date 2026-09-12 (Saturday, non-trading day). Fear & Greed data as of 2026-09-04, missing 9/5-9/11 sessions. Credit spreads and rates as of 2026-09-10; margin debt as of 2026-04. Composite index 41.86 (Fear), 4 consecutive fear days in sample. Sub-indicator/raw data contradictions are extensive. Credit spreads normal but margin debt and ETF flows at records.
CNN Fear & Greed Sentiment Analysis — 2026-09-12
Run Date: 2026-09-12 (Saturday, Beijing Time 06:30) Market Data As-of: 2026-09-04 (data failed to refresh to latest trading day) Cross-verification Data: Credit spreads/rates as of 2026-09-10; margin debt as of 2026-04
New Changes vs. Carry-forward Signals
This F&G run returned no new trading day data — the last record is still 2026-09-04. Five trading days from 9/5 (Friday) through 9/11 (Thursday) were not captured.
Key Data Conflict:
previous_close= 35.23, but the historical series last entry (9/4) shows 41.86 — these do not match. This indicatesprevious_closereferences a value from 9/3 or earlier, while the historical array was not synced to the same point.- Main section timestamp is
2026-09-04T23:59:43+00:00, confirming data cuts off at 9/4.
Old Signal Carry-forward: The fear trend from 9/1–9/4 persists from the previous report with no new reversal signal.
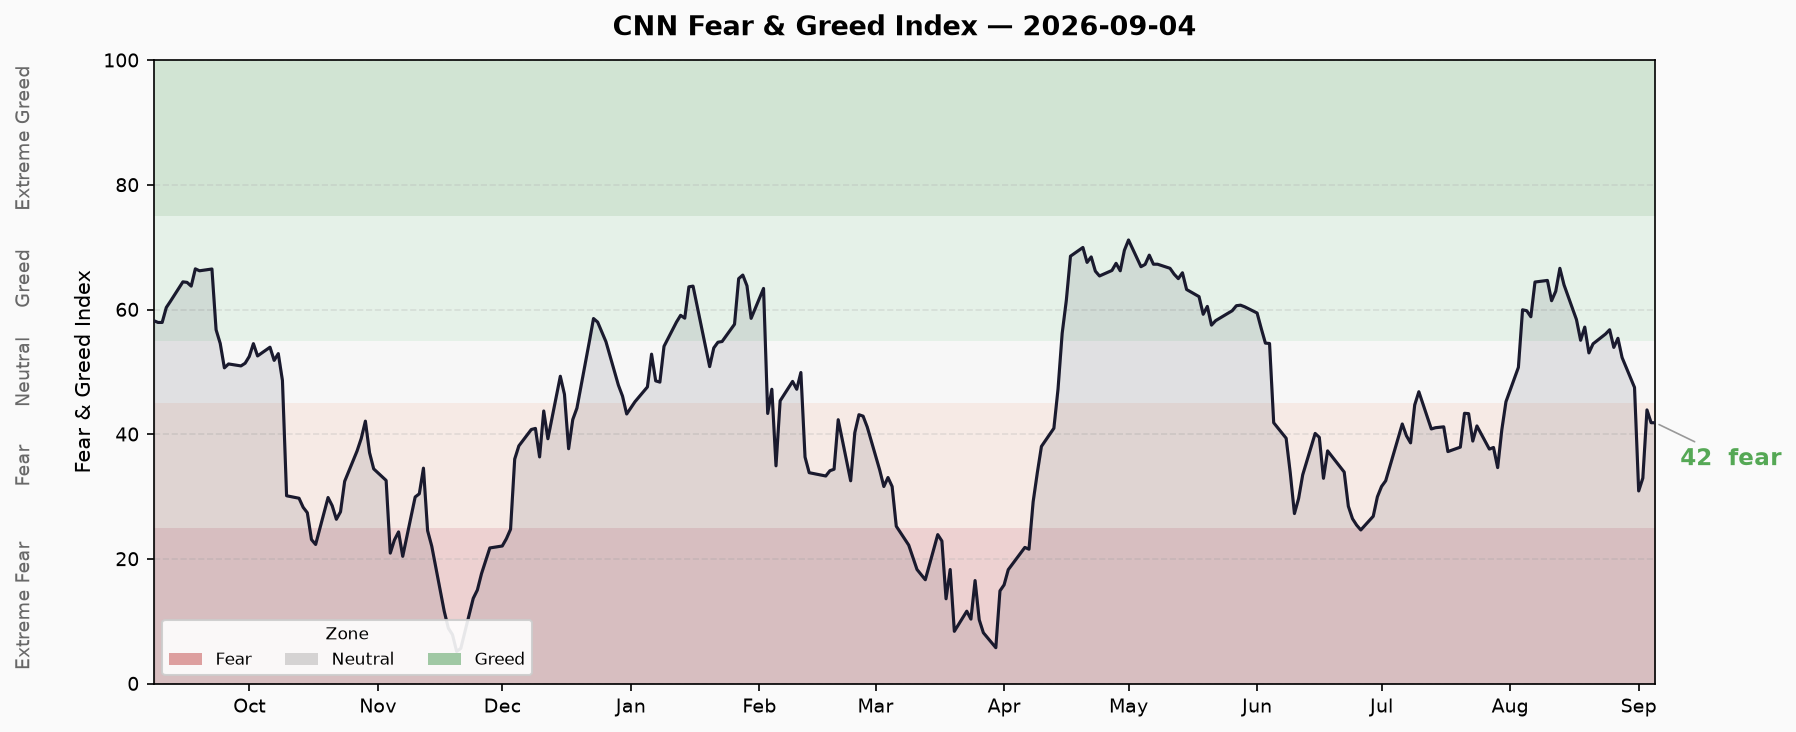
Composite Index Trend
| Item | Value |
|---|---|
| Current Score | 41.86 |
| Rating | Fear |
| As-of | 2026-09-04 |
| Previous Close | 35.23 (⚠️ conflicts with historical 9/4 value of 41.86) |
| 1 Week Ago | 52.31 |
| 1 Month Ago | 59.97 |
| 1 Year Ago | 61.17 |
Last 10 Trading Days (historical series):
| Date | Score | Rating |
|---|---|---|
| 2026-08-18 | 55.09 | Greed |
| 2026-08-19 | 57.20 | Greed |
| 2026-08-20 | 53.06 | Neutral |
| 2026-08-21 | 54.51 | Neutral |
| 2026-08-24 | 56.09 | Greed |
| 2026-08-25 | 56.77 | Greed |
| 2026-08-26 | 53.94 | Neutral |
| 2026-08-27 | 55.40 | Greed |
| 2026-08-28 | 52.31 | Neutral |
| 2026-08-31 | 47.51 | Neutral |
| 2026-09-01 | 30.91 | Fear |
| 2026-09-02 | 32.97 | Fear |
| 2026-09-03 | 43.91 | Fear |
| 2026-09-04 | 41.86 | Fear |
Trend Interpretation:
- Consecutive fear days: 4 (9/1 → 9/4). Slid from Neutral (8/28) into fear territory.
- Sample minimum: From the full 250-point history, the lowest score occurred earlier (reaching Extreme Fear in the single digits); September’s low so far is 30.91 (9/1).
- One-week change: 52.31 → 41.86, a drop of ~10.5 points, from Neutral to Fear.
- One-month change: 59.97 → 41.86, a drop of ~18 points, from near-Greed to mid-Fear.
Seven Sub-Indicator Table
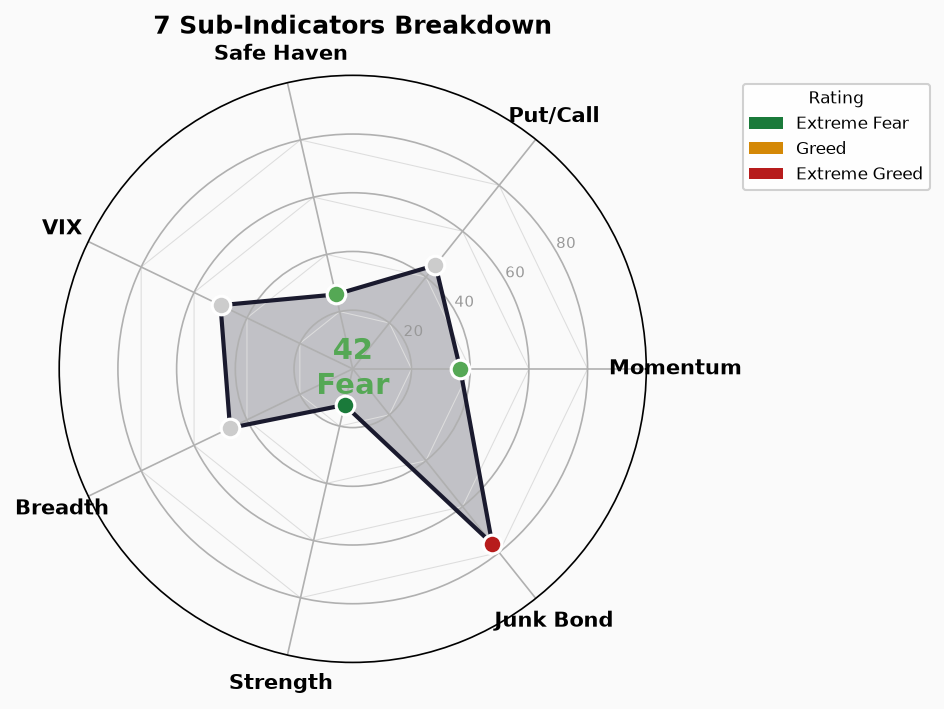
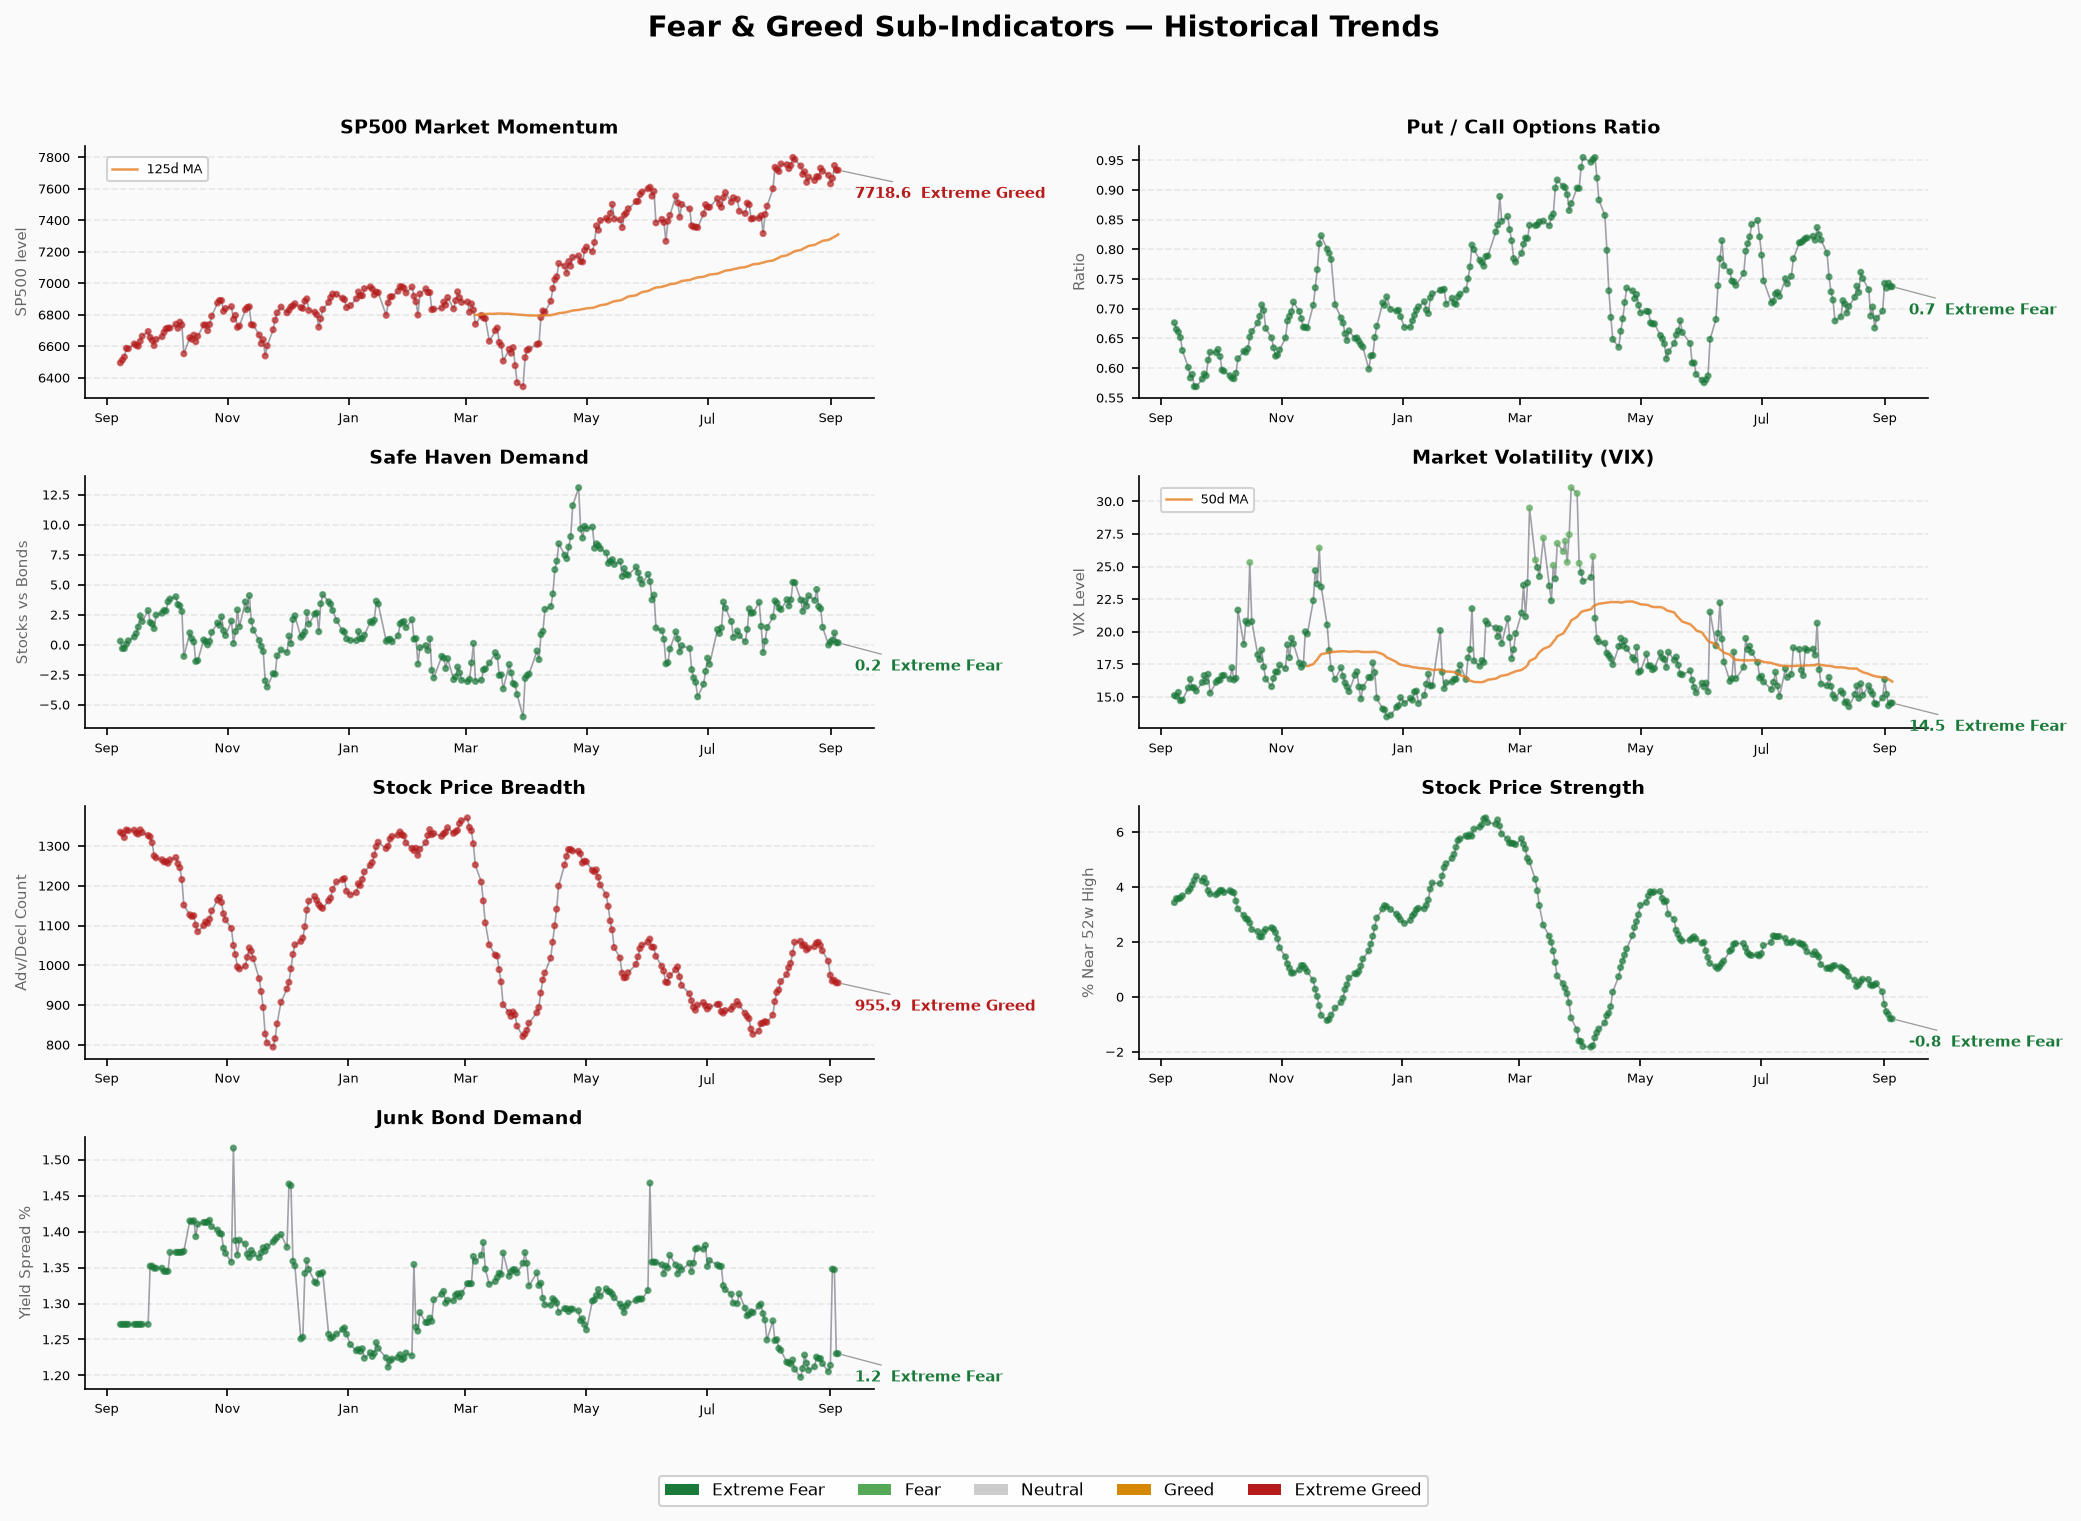
⚠️ All sub-indicator data as of 2026-09-04. The script outputs 9 sub-items mapped to CNN’s 7 standard indicator categories. Composite scores are computed by the script’s internal formula; sub-ratings are raw-value mappings. Extensive contradictions exist between composite ratings and raw data sub-ratings — noted.
| Indicator | Composite Score | Composite Rating | Raw Value | Raw Rating | Status |
|---|---|---|---|---|---|
| Momentum (S&P 500) | 36.6 | Fear | 7718.6 | Extreme Greed | ⚠️ Contradiction |
| Momentum (S&P 125) | 36.6 | Fear | 7302.8 | Extreme Greed | ⚠️ Contradiction |
| Price Strength | 12.6 | Extreme Fear | -0.79 | Extreme Fear | ✓ Consistent |
| Price Breadth | 46.4 | Neutral | 955.9 | Extreme Greed | ⚠️ Contradiction |
| Put/Call Options | 45.2 | Neutral | 0.74 | Extreme Fear | ⚠️ Contradiction |
| Volatility (VIX) | 50.0 | Neutral | 14.53 | Extreme Fear | ⚠️ Contradiction |
| Volatility (VIX 50) | 50.0 | Neutral | 16.26 | Extreme Fear | ⚠️ Contradiction |
| Junk Bond Demand | 76.2 | Extreme Greed | 1.23 | Extreme Fear | ⚠️ Contradiction |
| Safe Haven Demand | 26.0 | Fear | 0.17 | Extreme Fear | ⚠️ Partial contradiction |
Key Interpretations:
Price Strength is the only indicator consistent with the composite rating (12.6 Extreme Fear, raw also points to Extreme Fear). This means the magnitude of stock pullbacks from highs is at extreme levels within the sample.
Momentum indicators (S&P 500/125) contradiction is the most notable: composite reports Fear (36.6), but raw momentum values 7718.6 / 7302.8 are self-rated as Extreme Greed by the script. Possible reasons: the composite formula’s interaction with other sub-factors (like strength) drags the overall score down, or the raw value rating mapping is inconsistent with the composite formula.
VIX series (14.53 / 16.26) raw rating is Extreme Fear, but composite is Neutral (50). VIX at 14-16 typically does not signal panic; the script’s raw rating mapping may be incorrect.
Junk Bond Demand (76.2 Extreme Greed) completely contradicts its raw value (1.23 Extreme Fear). This is the highest composite score among all indicators, suggesting the credit market is actually optimistic — a divergence from equity fear.
Safe Haven Demand (26 Fear) aligns directionally with overall fear, but the raw value of 0.17 is at a very low level, indicating capital has not massively flowed into gold/JPY/US Treasuries. Safe-haven sentiment is not extreme.
Indicator Divergences: Possible Explanations & Counter-evidence
Divergence 1: Equity Fear vs. Junk Bond Greed
- Price Strength Extreme Fear + composite 41.86 Fear, but junk bond demand 76.2 Extreme Greed.
- Explanation: Equity market experiencing a technical pullback or sector-specific sell-off (e.g., the sharp drop on 9/1), but credit spreads did not widen同步, meaning the credit market does not interpret this decline as a fundamental deterioration signal.
- Counter-evidence: Check actual HY OAS value (see cross-verification below). If HY OAS < 3%, then the bond market is indeed not panicked.
Divergence 2: VIX Neutral vs. Price Strength Extreme Fear
- VIX at 14-16 (composite Neutral), but price strength -0.79 (Extreme Fear).
- Explanation: Implied volatility (VIX) has not spiked, meaning the options market is not pricing significant downside risk; yet现货 market breadth (advancing vs. declining stocks, new highs vs. lows) is severely deteriorated. This is a “decline without panic” structure — the sell-off is driven by a few large-cap stocks or structural factors, not systemic fear.
Divergence 3: Low Safe Haven Demand vs. Composite Fear
- Safe haven composite 26 (Fear), but raw value 0.17 at very low levels.
- Explanation: The safe-haven indicator’s composite calculation may be dragged by other factors, but the raw data shows capital has not massively rotated into safe-haven assets. Fear is primarily equity-internal, not spilling into safe-haven assets.
Credit / Rates / Leverage Cross-verification
| Indicator | Value | As-of | Status |
|---|---|---|---|
| HY OAS (High Yield Spread) | 2.70% | 2026-09-10 | 🟢 Normal (<3%) |
| IG OAS (Investment Grade Spread) | 0.80% | 2026-09-10 | 🟢 Normal (<1%) |
| 10Y Treasury Yield | 4.95% | 2026-09-10 | Info |
| 2Y Treasury Yield | 4.56% | 2026-09-10 | Info |
| 30Y Treasury Yield | 5.37% | 2026-09-10 | Info |
| 10Y-2Y Spread | +0.33% | 2026-09-10 | 🟢 Normal, flat |
| 10Y-30Y Spread | -0.42% | 2026-09-10 | Inversion |
| Margin Debt | $1.304T | 2026-04 | 🔴 All-time high |
| IPOs (2026 YTD) | ~73 | 2026 | 🔴 Active |
| ETF Net Inflows (2026 YTD) | $8,560B | 2026 | 🔴 Record |
Cross-verification Conclusion:
Credit market calm: HY OAS at 2.70% is in normal range, forming a clear divergence from F&G fear. Credit pricing does not reflect equity market tension — this is not a credit-driven decline.
Yield curve: 10Y-2Y at +0.33% (positive, not inverted), but 10Y-30Y at -0.42% (bear steepening). Short-end rates (2Y 4.56%) below long-end (10Y 4.95%), market still pricing rate cut expectations, but long-end suppressed by supply or inflation concerns.
Leverage risk overhead: Margin debt at $1.304T, all-time high (April 2026 data). In a high-leverage environment, any decline could trigger forced liquidation (margin calls) — this is a potential downside accelerator, not a current crisis signal.
Capital inflows persist: Active IPOs + record YTD ETF inflows indicate institutional and retail capital inflows have not reversed despite the equity pullback. This hedges the fear signal.
Red/Yellow/Green count: Green 2 (HY OAS, IG OAS), Yellow 0, Red 2 (margin debt, ETF/IPO overheating).
⚠️ No uncatalyzed crisis probability output. Above are分项 statuses, not a综合 warning.
Conditions for Risk Escalation or De-escalation
Watch for risk escalation if:
- HY OAS breaks above 3% → credit spreads widen, credit market starts pricing risk
- VIX breaks above 20 → implied volatility enters警戒 zone
- Price Strength recovers from Extreme Fear to below -0.5 → stock breadth improves
- Consecutive fear days exceed 10 trading days
- Margin debt increases > 2% QoQ → margin adding fuels泡沫ization
Watch for risk de-escalation if:
- F&G composite index recovers above 50 (Neutral threshold)
- Price Strength recovers from -0.79 to above -0.3
- VIX falls below 13
- Junk bond demand’s raw value improves from Extreme Fear rating (confirms credit stability)
Data Limitations
- F&G data is stale: As of 2026-09-04, missing 5 trading days from 9/5–9/11. The market may have changed significantly during this period (escalation or de-escalation); this report cannot reflect that.
- previous_close conflicts with historical series: 35.23 vs. 41.86; the true daily change cannot be confirmed.
- Sub-indicator contradictions: 6 of 7 sub-indicators have inconsistent composite ratings vs. raw data ratings. The script’s internal scoring logic is opaque — interpret with caution.
- Margin debt is lagged: FINRA publishes monthly; latest is April 2026, unable to reflect the past 5 months’ change.
- Crisis signals’ ETF/IPO data are YTD cumulative values, not daily readings.
- 10Y-2Y spread comes from the crisis_signals script’s sourced data, not manually cross-verified.