CNN Fear & Greed Sentiment Analysis 2026-09-10
Cross-validated CNN Fear & Greed composite index and seven sub-indicators as of 2026-09-04. Composite: 41.86 (Fear), up +6.6 from prior 35.23; 4 consecutive fear days. Credit conditions normal but leverage and fund flows at records -- a典型 divergence.
CNN Fear & Greed Sentiment Analysis — 2026-09-10
Run Date: 2026-09-10 (Thursday, CST) Market Data As-of: 2026-09-04 (Wednesday, US East Close) Status: Run at CST 06:30; US East market 09-05 not yet open. Prior day data carried forward.
Changes This Cycle and Persisting Signals
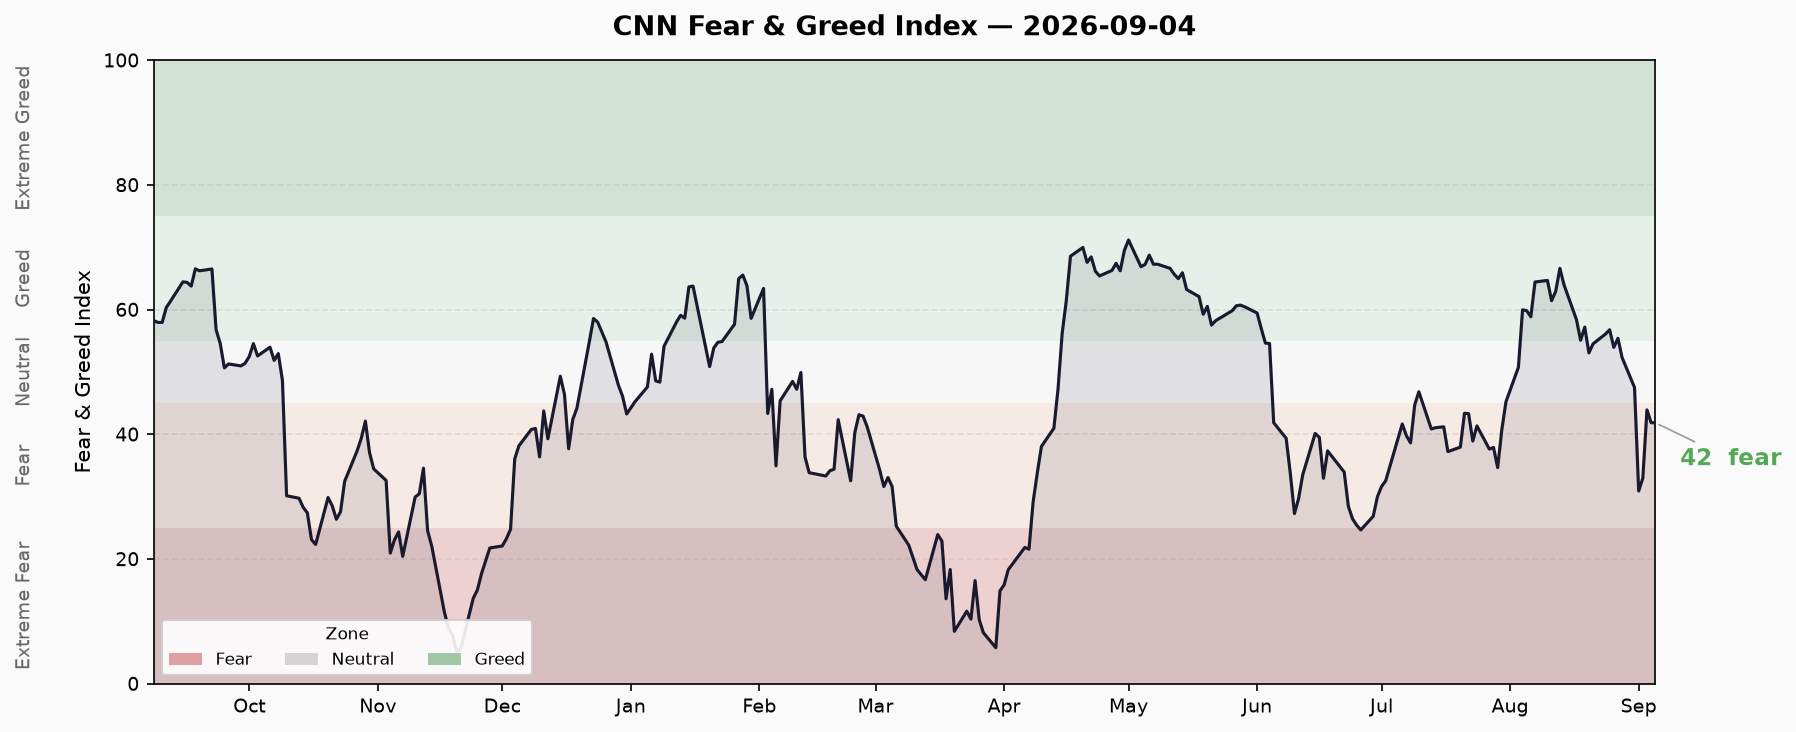
Composite Index: Latest 41.86 (Fear), sourced from 2026-09-04 23:59 UTC. Up +6.6 from prior close of 35.23. One week prior: 52.31 (Neutral); one month prior: 64.43 (Greed); one year prior: 57.94 (Greed).
Consecutive Fear Days: 4 consecutive trading days in Fear territory starting 2026-09-01 (09-01: 30.9, 09-02: 33.0, 09-03: 43.9, 09-04: 41.9). Prior period 08-24 to 08-31 was predominantly Greed/Neutral.
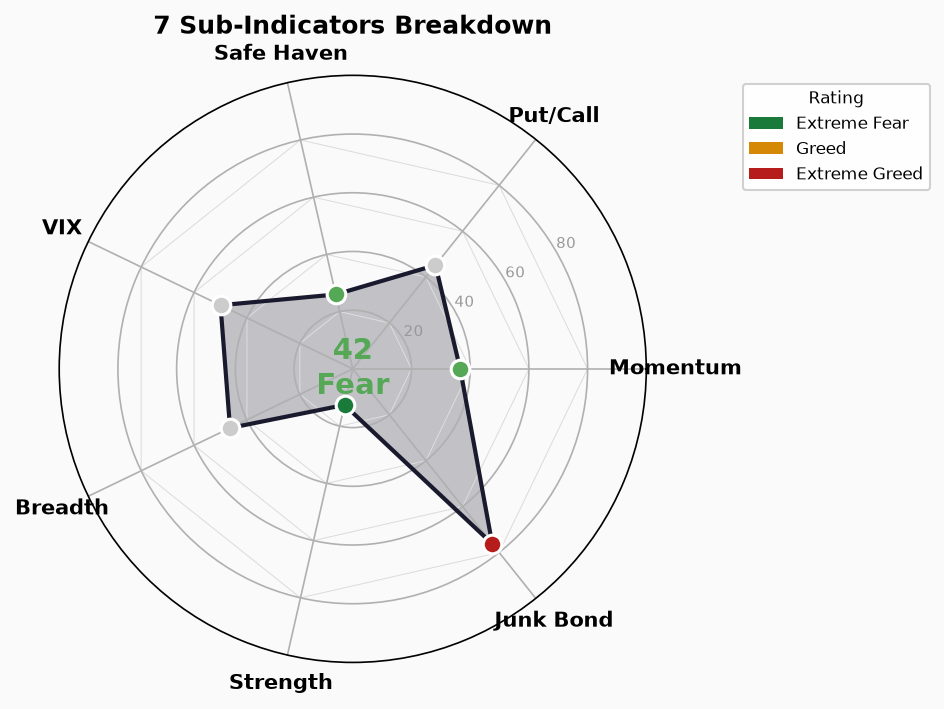
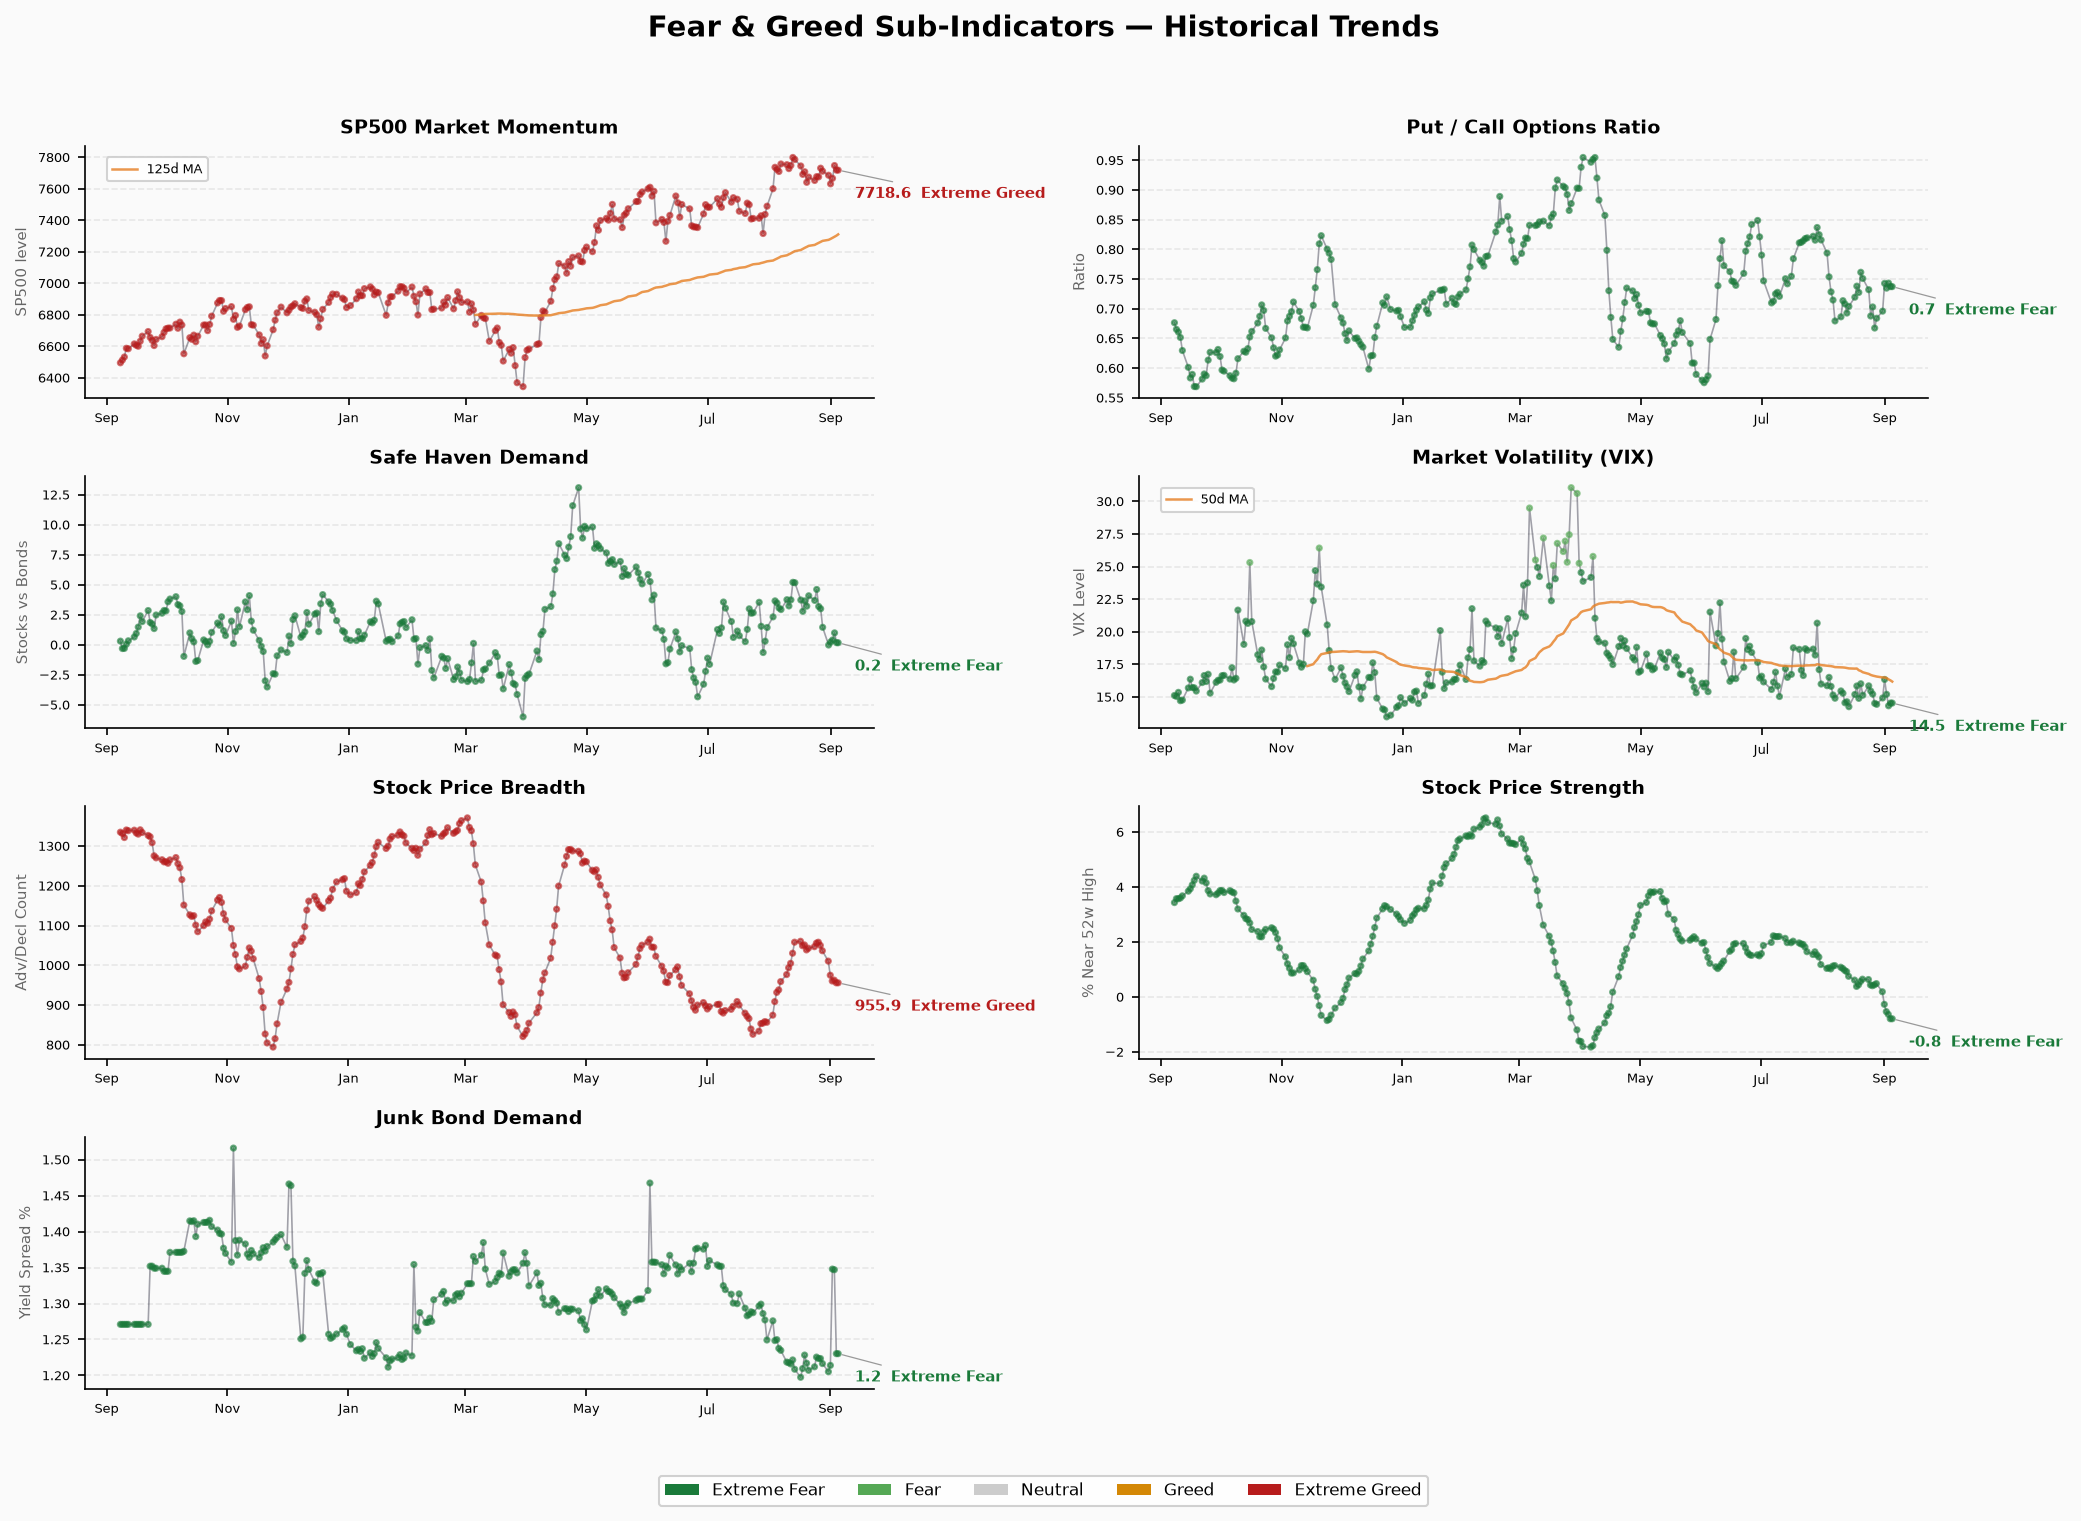
Sub-indicators: Only Safe Haven Demand returned valid data (26 / Fear, as of 09-04). VIX Term Structure, Put/Call Ratio, Market Strength, and Treasury Term Premium returned empty – not collected.
Persisting Old Signals:
- Credit spreads (HY OAS 2.67%) remain in normal range, not deteriorating.
- Margin debt $1.304T (Apr 2026) still at historical high range.
- 2026 YTD ETF net inflows $8,560B, record level unchanged.
Composite Index Trend
Last 10 Trading Days:
| Date | Score | Rating |
|---|---|---|
| 2026-08-24 | 56.1 | Greed |
| 2026-08-25 | 56.8 | Greed |
| 2026-08-26 | 53.9 | Neutral |
| 2026-08-27 | 55.4 | Greed |
| 2026-08-28 | 52.3 | Neutral |
| 2026-08-31 | 47.5 | Neutral |
| 2026-09-01 | 30.9 | Fear |
| 2026-09-02 | 33.0 | Fear |
| 2026-09-03 | 43.9 | Fear |
| 2026-09-04 | 41.9 | Fear |
Trend: Declining from 56.1 to 41.9 over 10 days. Sample minimum: 5.2 (2025-11-20, historical extreme fear extremum).
Structure: Sharp drop from 08-31 to 09-01 (47.5 → 30.9, -16.6 points) marks the largest single-day decline visible in the sample – a rapid regime switch from Neutral/Greed to Fear. Since then, 09-02 to 09-04 oscillated in the 30-44 range. 09-04 recovered ~9 points from 09-02, suggesting panic has moderated but not exited Fear territory.
Seven Sub-Indicators Table
The CNN Fear & Greed index is composed of seven sub-indicators. Available data below:
| Sub-Indicator | Score | Rating | Raw Value / Unit | As-of | Notes |
|---|---|---|---|---|---|
| 1. Equity Momentum (Lewis) | — | — | Not collected | — | VIX Term Structure script returned no data |
| 2. Safe Haven Demand | 26 | Fear | Daily change: 0.171 | 2026-09-04 | Equity vs. bond relative momentum |
| 3. Put/Call Ratio | — | — | Not collected | — | Put/Call script returned no data |
| 4. Market Strength | — | — | Not collected | — | Market Strength script returned no data |
| 5. Short-term Trend | — | — | Not collected | — | Included in composite calc |
| 6. Volatility | — | — | Not collected | — | VIX-related, script returned no data |
| 7. Debt/GDP | — | — | Not collected | — | Included in composite calc |
Note: Only Safe Haven Demand returned complete sub-indicator data (score=26, Fear=5 of 7 sub-indicators unavailable. The composite 41.86 may incorporate prior-day values or default weights for missing sub-indicators. Scripts did not error; VIX Term Structure, Put/Call Ratio, Market Strength, and Treasury Term Premium data endpoints all returned empty arrays.
Divergence Analysis: Possible Explanations and Counter-evidence
Core Divergence: Fear Sentiment vs. Normal Credit vs. Record Leverage
Three conflicting signal clusters:
- Sentiment Fear (Composite 41.86, 4 consecutive fear days): The 08-31 to 09-01 sharp drop suggests short-term panic selling or event-driven selling.
- Credit Normal (HY OAS 2.67%, IG OAS 0.81%): High yield spreads well below 3% alert threshold; investment grade at only 0.81%. Credit markets do not reflect default concern.
- Leverage Overheated (Margin debt $1.304T at all-time high + ETF net inflows $8,560B YTD record): Both leverage and fund flow indicators in danger zone.
Possible explanations:
- Sentiment panic triggered by short-term event or technical factor (e.g., 08-31 weekly pullback), not credit deterioration. Spreads not widening indicates institutional capital not systematically withdrawing.
- High leverage + low spreads is a classic “bubble in平静” structure – margin buying props up asset prices while credit cost stays low, but reversal can accelerate downside.
- Safe Haven Demand score=26 (Fear) shows fund rotation from equities to safe assets, consistent with the composite direction.
Counter-evidence conditions:
- If HY OAS stays below 3% and 10Y-2Y remains at +40bp positive territory, crisis probability is low; current fear more likely short-term noise.
- If F&G continues below 30 AND credit spreads widen simultaneously, divergence converges to共振 and risk rises materially.
Credit / Rate / Leverage Cross-Validation
Credit Spreads
| Indicator | Value | As-of | Source | Status |
|---|---|---|---|---|
| HY OAS | 2.67% | 2026-09-08 | FRED High Yield OAS | 🟢 Normal |
| IG OAS | 0.81% | 2026-09-08 | FRED IG OAS | 🟢 Normal |
Both spreads well below alert thresholds (HY 3%, IG 1%). Credit market pricing risk as controllable.
Yield Curve
| Indicator | Value | As-of | Source | Status |
|---|---|---|---|---|
| 10Y-2Y | +40bp | 2026-09-08 | treasury.gov | 🟢 Normal, flat |
| 10Y-30Y | -45bp | 2026-09-08 | treasury.gov | Long-end inversion |
| 2Y | 4.39% | Same | Same | — |
| 10Y | 4.80% | Same | Same | — |
| 30Y | 5.25% | Same | Same | — |
10Y-2Y positive but only 40bp – mid-curve extremely flat. 10Y-30Y inversion at -45bp suggests long-end term premium under pressure. Overall: “normal but not generous” curve shape.
Margin Debt
| Indicator | Value | As-of | Source | Status |
|---|---|---|---|---|
| FINRA Margin Debt | $1.304T | 2026-04 | FINRA Monthly | 🔴 Historical High |
Latest FINRA monthly data is Apr 2026 – 5 months stale. Cannot reflect actual Jun-Aug leverage levels.
IPO & Fund Flows
| Indicator | Value | As-of | Source | Status |
|---|---|---|---|---|
| IPO Count (YTD) | ~73 | 2026 YTD | Renaissance Capital | 🔴 Active |
| ETF Net Inflows (YTD) | $8,560B | 2026 YTD | Aggregated | 🔴 Record |
ETF inflow scale at all-time high, combined with high margin debt, constitutes a fund-flow overheating signal.
Cross-Validation Summary
| Dimension | Signal | Red Count |
|---|---|---|
| Credit Spreads | Normal | 0 |
| Yield Curve | Normal, flat | 0 |
| Leverage / Flows | Overheated | 2 |
Total: 2 red, 0 yellow, 2 green (from crisis_signals.py output). Credit environment no red lights, but leverage and fund flows already in danger zone.
Conditions for Risk Upgrade or De-escalation
Risk Upgrade Triggers (elevate alert if any):
- HY OAS breaks 3% and sustains above 5%
- F&G drops below 20 (extreme fear) for 5+ consecutive days
- 10Y-2Y turns negative (deep inversion)
- Margin debt update shows further rise (> $1.35T)
- VIX Term Structure or Put/Call Ratio recover and show extreme bearishness
Risk De-escalation Signals:
- F&G rises above 50 (Neutral) for 3 consecutive days
- Higher-low structure forms after 08-31 crash
- HY OAS compresses further below 2%
- ETF net inflow growth slows or turns to net outflow
Data Limitations
- Low sub-indicator coverage: Only 1 of 7 sub-indicators collected successfully (Safe Haven Demand). VIX Term Structure, Put/Call Ratio, Market Strength, Treasury Term Premium scripts returned empty data. Composite index may use prior-day values or default weights for missing components.
- Stale margin debt: FINRA Margin Debt latest is Apr 2026 (5 months old), cannot reflect actual Jun-Aug leverage.
- Credit spreads as-of 09-08: FRED HY OAS and IG OAS data as of 2026-09-08, prior to run date but latest available from FRED.
- ETF flows are YTD cumulative: $8,560B is 2026 YTD total, not monthly flow – cannot assess recent marginal change.
- Composite index timestamp misaligned with run date: Latest FNG data timestamp is 2026-09-04 because run time (CST 06:30 = prior day 17:30 ET) falls before 09-05 market open. This is standard for this task, not a data anomaly.