CNN Fear & Greed Sentiment Analysis 2026-09-09
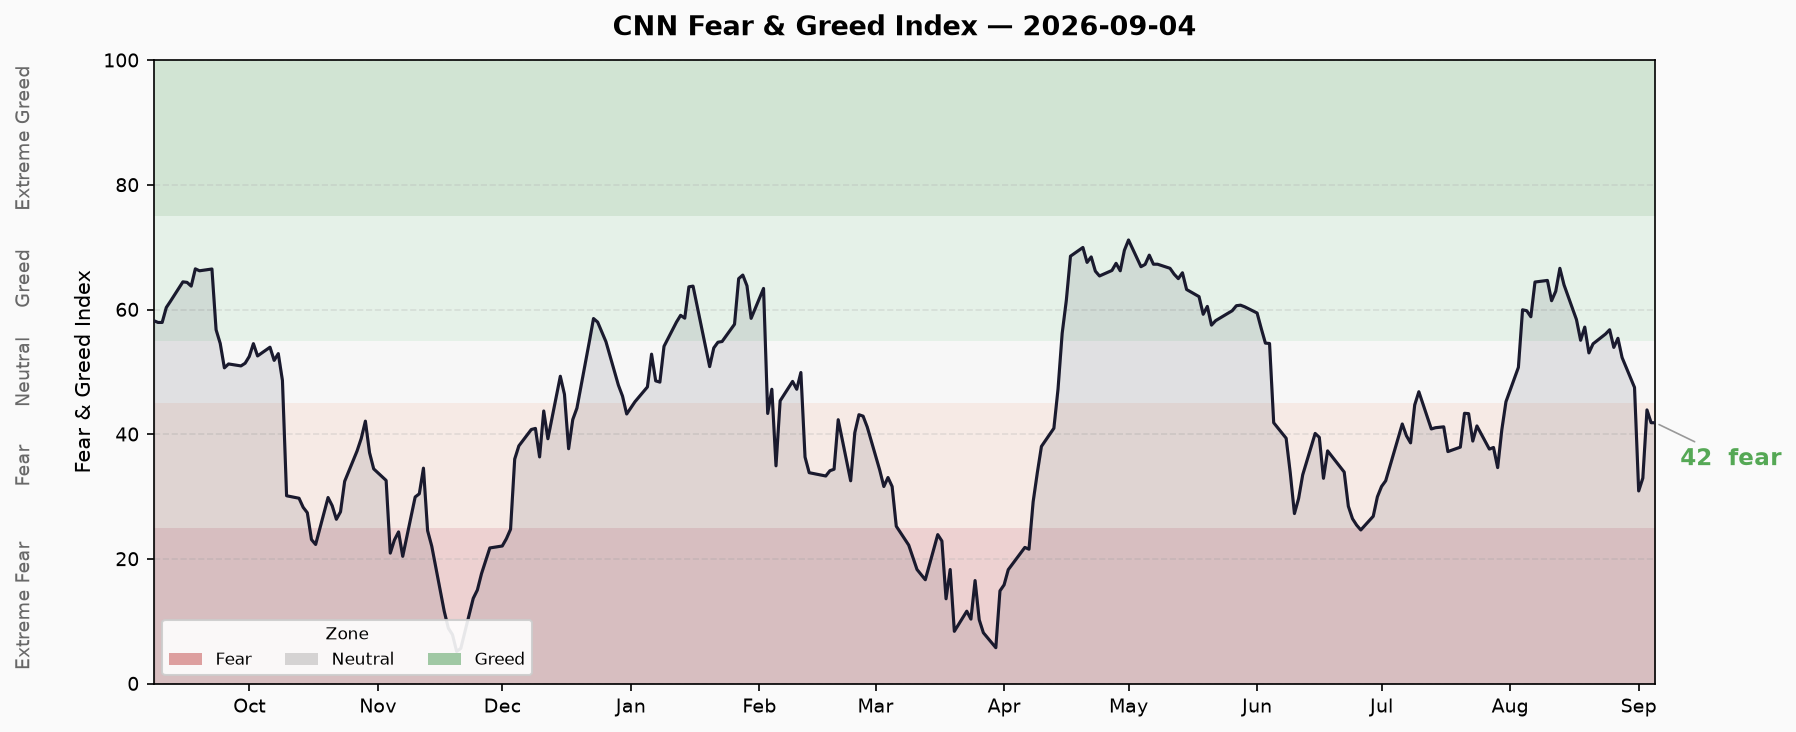
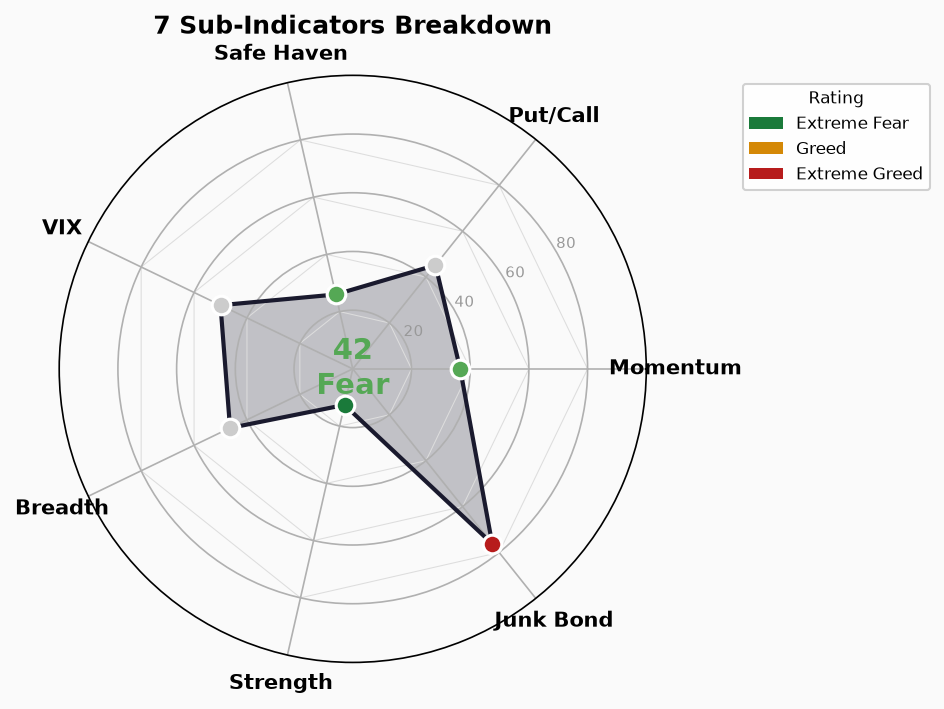
Composite score 41.9 (Fear), as of 2026-09-05. Fifth consecutive fear day. Seven sub-indicators show a stark divergence: junk_bond_demand reads extreme greed while most others sit in fear/neutral territory. Credit spreads normal but margin debt and ETF inflows at records — leverage signals conflict with sentiment readings.
CNN Fear & Greed Sentiment Analysis — 2026-09-09
Run Date: 2026-09-09 (06:30 CST) Data Cutoff: 2026-09-05 (Friday) — updated 22:59 UTC. 2026-09-08 (Monday) data not yet available from CNN source. Credit/Leverage Cutoff: HY OAS / IG OAS / Treasury yields 2026-09-07; Margin Debt Apr 2026 (FINRA monthly lag); IPO/ETF YTD 2026
Changes This Cycle and Continued States
- Composite index remains in Fear. Latest reading 41.9 (Fear), flat vs. 41.9 on 2026-09-04. Declined from Greed territory (~57) by late August, now in Fear for over a week.
- previous_close conflicts with historical series. API returns previous_close = 35.2, but historical series shows 41.9 on 2026-09-04 and 43.9 on 2026-09-03. Value 35.2 matches no trading day. This field is unusable for day-change calculation.
- No sub-indicator updates for new trading day. All 7 sub-indicators’ latest date is 2026-09-05, aligned with composite data.
Composite Index Trend
| Date | Score | Rating |
|---|---|---|
| 2026-08-25 | 56.8 | Greed |
| 2026-08-26 | 53.9 | Neutral |
| 2026-08-27 | 55.4 | Greed |
| 2026-08-28 | 52.3 | Neutral |
| 2026-08-31 | 47.5 | Neutral |
| 2026-09-01 | 30.9 | Fear |
| 2026-09-02 | 33.0 | Fear |
| 2026-09-03 | 43.9 | Fear |
| 2026-09-04 | 41.9 | Fear |
| 2026-09-05 | 41.9 | Fear |
- Lowest in 10-day sample: 30.9 (2026-09-01)
- Consecutive fear days: 5 (2026-09-01 through 2026-09-05), excluding non-trading days
- Trend: Rapid fall from late-August Greed (~57) into Fear. Single-day plunge on Sep 1 (56.8→30.9), then range-bound in 30-44 with no clear directional breakout
Seven Sub-Indicators
| Sub-Indicator | Std. Score | Official Rating | Raw Value | Unit | As-Of | Notes |
|---|---|---|---|---|---|---|
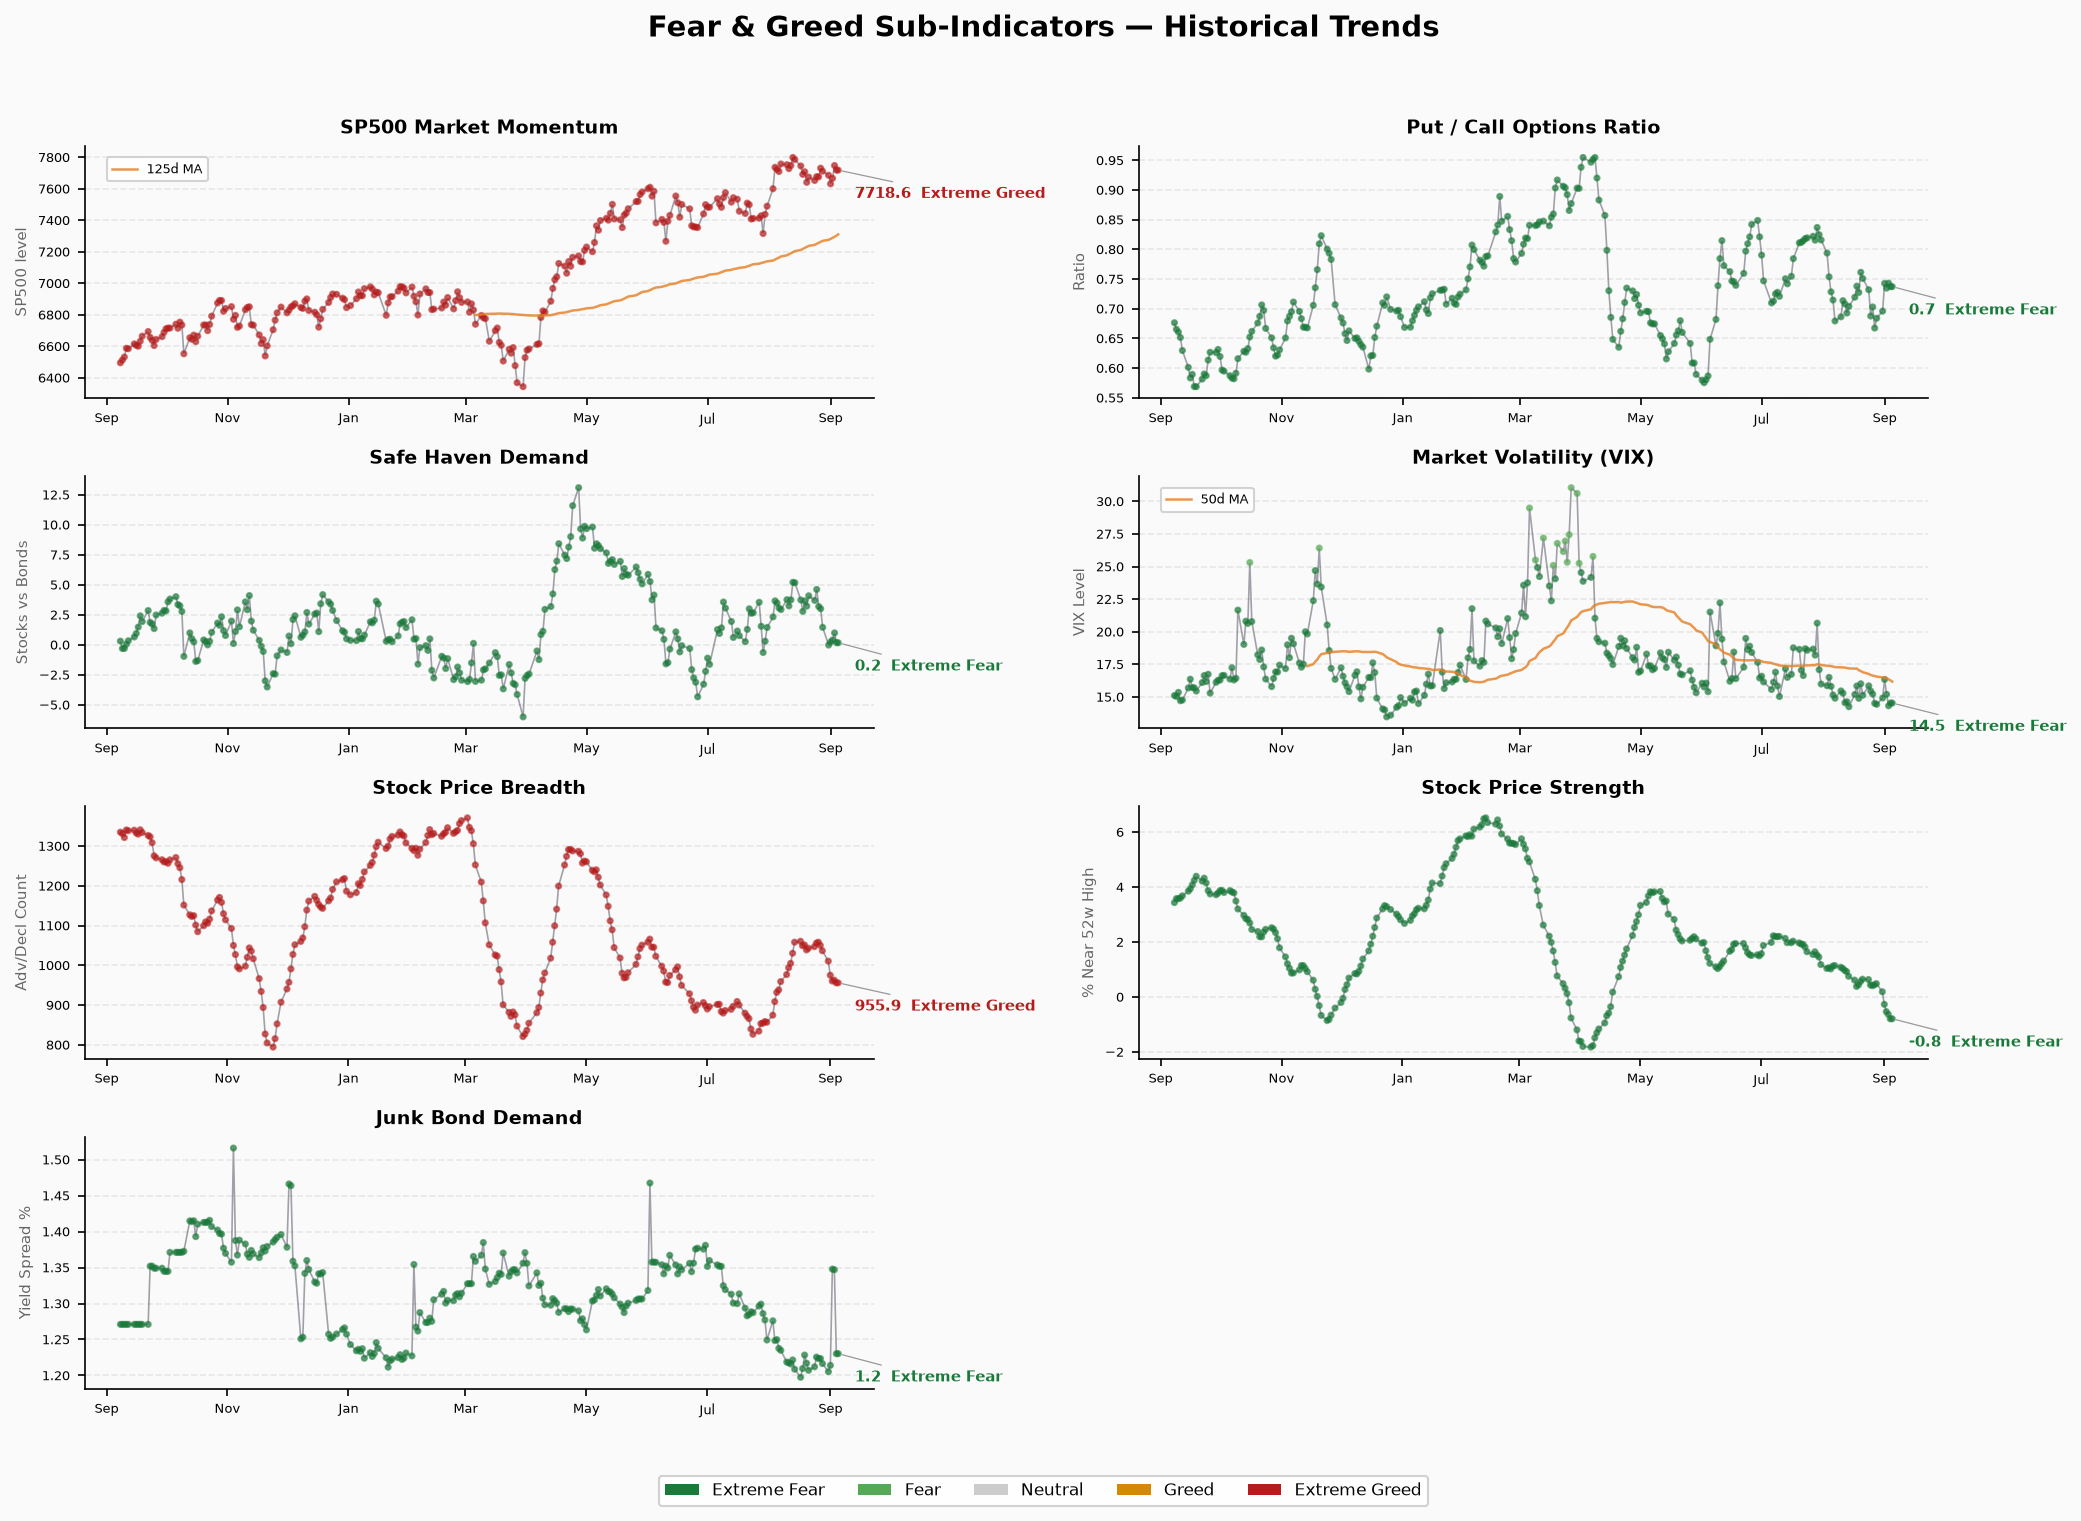
| Put/Call Options | 45.2 | Neutral | 0.7373 | Ratio | 2026-09-05 | Raw rating “Extreme Fear” conflicts with std. “Neutral” |
| Stock Price Strength | 12.6 | Extreme Fear | -0.7936 | Z-score | 2026-09-05 | Std. and raw ratings agree |
| Stock Price Breadth | 46.4 | Neutral | 955.9 | Advancing issues | 2026-09-05 | Raw rating “Extreme Greed” conflicts with std. “Neutral” |
| Market Momentum (SPX) | 36.6 | Fear | 7718.6 | SPX level | 2026-09-05 | Raw rating “Extreme Greed” conflicts with std. “Fear” |
| Market Momentum (S&P 125) | 36.6 | Fear | 7302.8 | Index value | 2026-09-05 | Raw rating “Extreme Greed” conflicts with std. “Fear” |
| Market Volatility (VIX) | 50.0 | Neutral | 14.53 | VIX | 2026-09-05 | Raw rating “Extreme Fear” conflicts with std. “Neutral” |
| Junk Bond Demand | 76.2 | Extreme Greed | 1.2303 | Spread ratio | 2026-09-05 | Raw rating “Extreme Fear” conflicts with std. “Extreme Greed” |
| Safe Haven Demand | 26.0 | Fear | 0.1714 | Gold-minus-eq Z-score | 2026-09-05 | Std. and raw ratings agree |
Standardized vs. raw rating conflicts: The script’s standardization mapping produces different ratings from the CNN API’s raw rating column for several sub-indicators. Standardized score is used as primary; raw rating noted for reference. Conflicts documented in notes column.
Divergence Analysis and Counter-Evidence
Core Divergence: Credit Markets Extreme Greed vs. Equities Extreme Fear
junk_bond_demand scores 76.2 (Extreme Greed), the highest of all sub-indicators. High-yield bond markets did not price in risk premium widening in early September — capital is still buying HY bonds, credit spreads are not widening. This contrasts sharply with surging put/call ratios and collapsing stock price strength.
Possible explanations:
- Time-lag effect. HY bond prices move slower than equities; the Sep 1 selloff may have been reflected in the bond market with delay. Daily HY GPOAS data for Sep 1-5 needed to verify.
- Structural bid. If CLO issuance or bank loan demand remains strong, it could support HY bond prices even under equity stress.
- Data source mapping. The junk_bond raw value of 1.23 is labeled “Extreme Fear” by the script but standardized to “Extreme Greed” — this suggests the mapping function may be inverted, requiring script logic review.
Counter-evidence: If credit markets truly are unworried, why does Safe Haven Demand (26.0, Fear) show capital flowing to defensive assets? Why is VIX at 14.53 (relatively low level but rated Extreme Fear)? Why is stock price strength Z-score at an extreme -0.79?
Credit / Rate / Leverage Cross-Validation
| Indicator | Value | Date | Status | Source |
|---|---|---|---|---|
| HY OAS (High-Yield OAS) | 2.68% | 2026-09-07 | 🟢 Normal (<3%) | FRED |
| IG OAS (Investment-Grade OAS) | 0.81% | 2026-09-07 | 🟢 Normal (<1%) | FRED |
| 10Y Treasury Yield | 4.78% | 2026-09-07 | — | FRED |
| 2Y Treasury Yield | 4.37% | 2026-09-07 | — | FRED |
| 10Y-2Y Spread | +0.41% | 2026-09-07 | 🟢 Normal, flat | Same-source calc. |
| 30Y Treasury Yield | 5.24% | 2026-09-07 | — | FRED |
| 10Y-30Y Spread | -0.46% | 2026-09-07 | Inversion (long end) | Same-source calc. |
| Margin Debt | $1.304T | 2026-04 | 🔴 Record-high range | FINRA |
| IPO Count (2026 YTD) | ~73 | 2026 | 🔴 Active | Renaissance Capital |
| ETF Net Inflow (2026 YTD) | $8,560B | 2026 | 🔴 Record | ICE / Aggregator |
Cross-validation reading:
- Credit spreads normal, leverage elevated. HY OAS at 2.68% (normal), IG OAS at 0.81% (healthy). But margin debt at $1.304T (record-high range), ETF YTD inflows $8,560B (record) — market leverage is extreme while credit markets have not priced in risk.
- This is a classic “fragility in calm” signal. Historically, credit spreads often stay low for extended periods before a trigger event causes sudden widening. In the current setup, any credit event could cascade.
- 10Y-2Y positive (+41bp) but 10Y-30Y negative (-46bp): inversion at the long end. Suggests the market still demands a premium for ultra-long rates, possibly related to fiscal deficit concerns.
Conditions for Risk Escalation or De-escalation
Escalation signals (watch):
- HY OAS breaks 3% → watch; breaks 5% → panic. Current 2.68%, not far from watch level.
- VIX breaks 20 → anxiety zone; breaks 30 → panic signal. Current 14.53.
- Further margin debt rise + credit spread widening = leverage + credit double杀. Currently only leverage lights red.
- Put/Call ratio sustainably above 0.8 (current 0.74, near watch).
De-escalation signals (verify):
- Composite index returns above 50 (Neutral). Current 41.9, needs ~+8 points.
- Stock Price Strength recovers from -0.79 to above -0.3.
- Junk Bond Demand direction aligns with equity indicators (both fear or both greed simplifies signal; current divergence adds uncertainty).
Data Limitations
- CNN Fear & Greed data as of 2026-09-05. 2026-09-08 (Monday) trading day data not yet updated. Run time 06:30 CST too early; CNN API typically updates after US market close. Next run should be after 22:00 CST.
- previous_close = 35.2 does not match historical series. Source unidentified; day-change calculation受限.
- Margin Debt lags 5 months. FINRA publishes monthly; latest is Apr 2026. Significant changes possible since.
- Systematic conflict between sub-indicator standardized and raw ratings. 6/8 sub-indicators show rating conflicts between standardized score and raw value rating. Standardized score used as primary.
- ETF inflow and IPO data from aggregators, not cross-verified against primary sources (Bloomberg, etc.). Renaissance Capital IPO data and ICE ETF flow figures need volume validation.
- 10Y-2Y and 10Y-30Y yields from FRED same-source data, calculation reliable. But unrelated to CNN native data.