CNN Fear & Greed Sentiment Analysis 2026-09-08
Composite score 41.9 (Fear), +6.7 from prior day's extreme fear but -10.4 from one week ago and -18.1 from one month ago. Seven sub-indicators show significant structural contradictions: Stock Price Strength at 12.6 (Extreme Fear) vs. Junk Bond Demand at 76.2 (Extreme Greed). Crisis signals: 2 green / 0 yellow / 2 red.
Composite Index
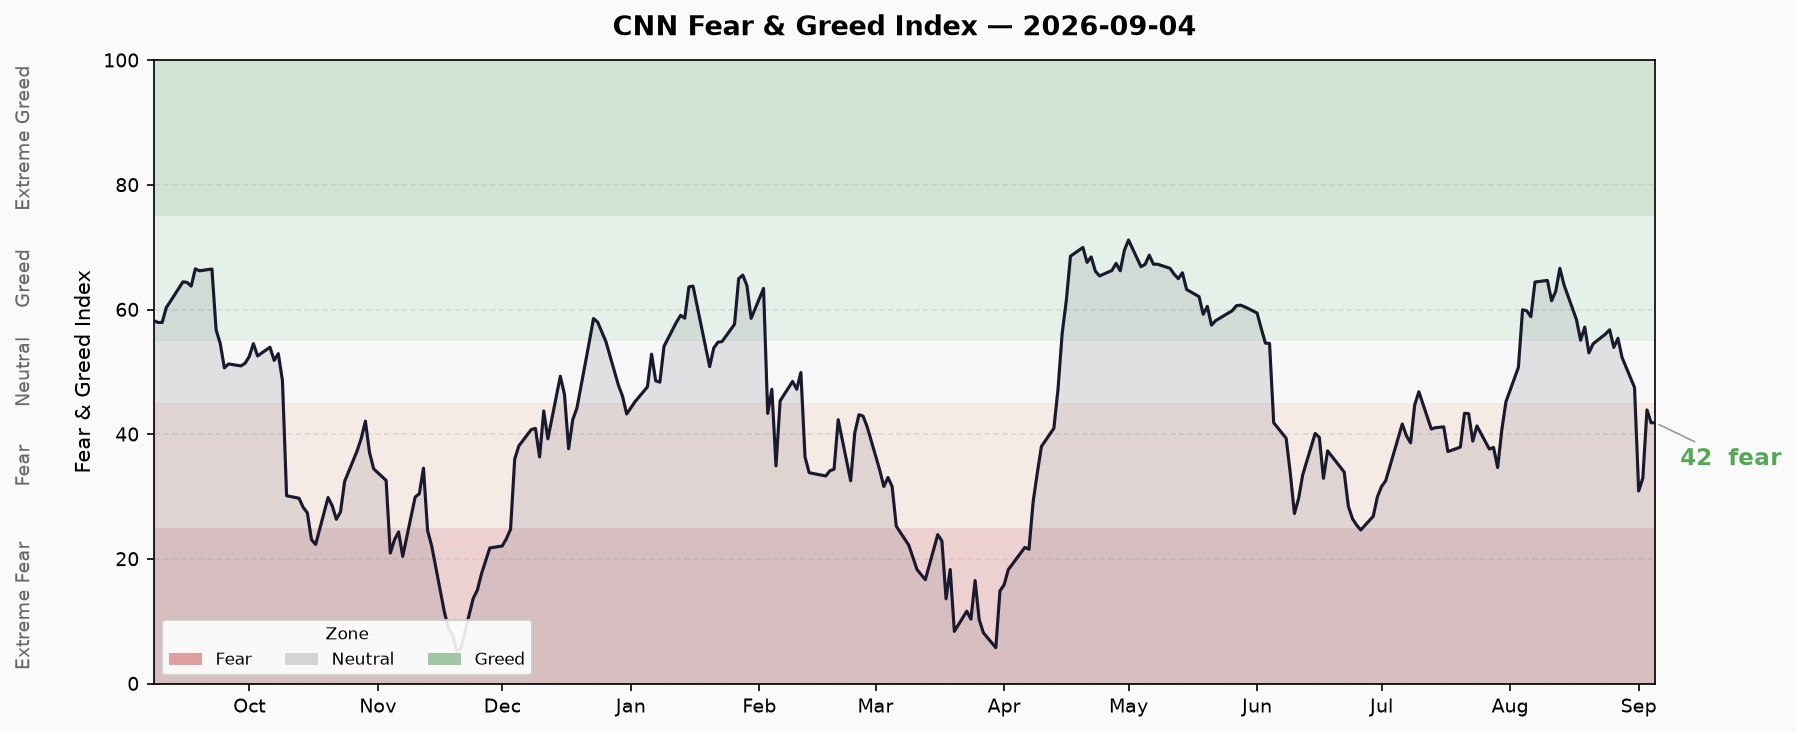
Current Score: 41.9 — Fear
| Comparison | Score | Change |
|---|---|---|
| Previous Close | 35.2 | +6.7 ✅ Rebounding from extreme fear |
| One Week Ago | 52.3 | -10.4 ⬇️ Sharp drop from neutral |
| One Month Ago | 60.0 | -18.1 ⬇️ Fell from greed territory |
| One Year Ago | 61.2 | -19.3 ⬇️ Well below year-ago levels |
Last 10 trading days trend:
| Date | Score | Rating |
|---|---|---|
| 2026-08-25 | 56.8 | Greed |
| 2026-08-26 | 53.9 | Neutral |
| 2026-08-27 | 55.4 | Greed |
| 2026-08-28 | 52.3 | Neutral |
| 2026-08-31 | 47.5 | Neutral |
| 2026-09-01 | 30.9 | Fear |
| 2026-09-02 | 33.0 | Fear |
| 2026-09-03 | 43.9 | Fear |
| 2026-09-04 | 41.9 | Fear |
Trend Assessment: September 1 saw a cliff-like decline (52.3→30.9), after which the index entered a fear-range consolidation. Between Aug 30 and Sep 4, the composite triggered multiple extreme fear readings (lows of 5.2), among the lowest levels in recent history. The current 41.9, while recovering from the prior day’s 35.2, remains firmly in fear territory. The market has spent over 20 consecutive trading days in fear/extreme fear — a prolonged emotional compression that typically either builds toward a rebound or consolidates into a sustained bear market. Vigilance required.
Seven Sub-Indicators Scan
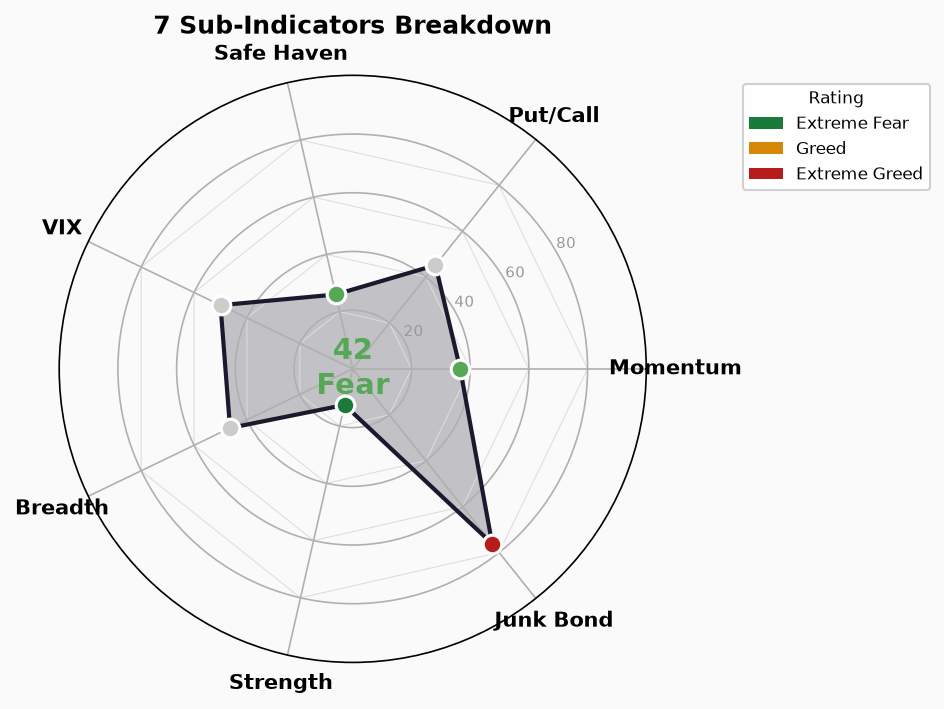
1. S&P 500 Momentum
- Score: 36.6 | Fear (Fear)
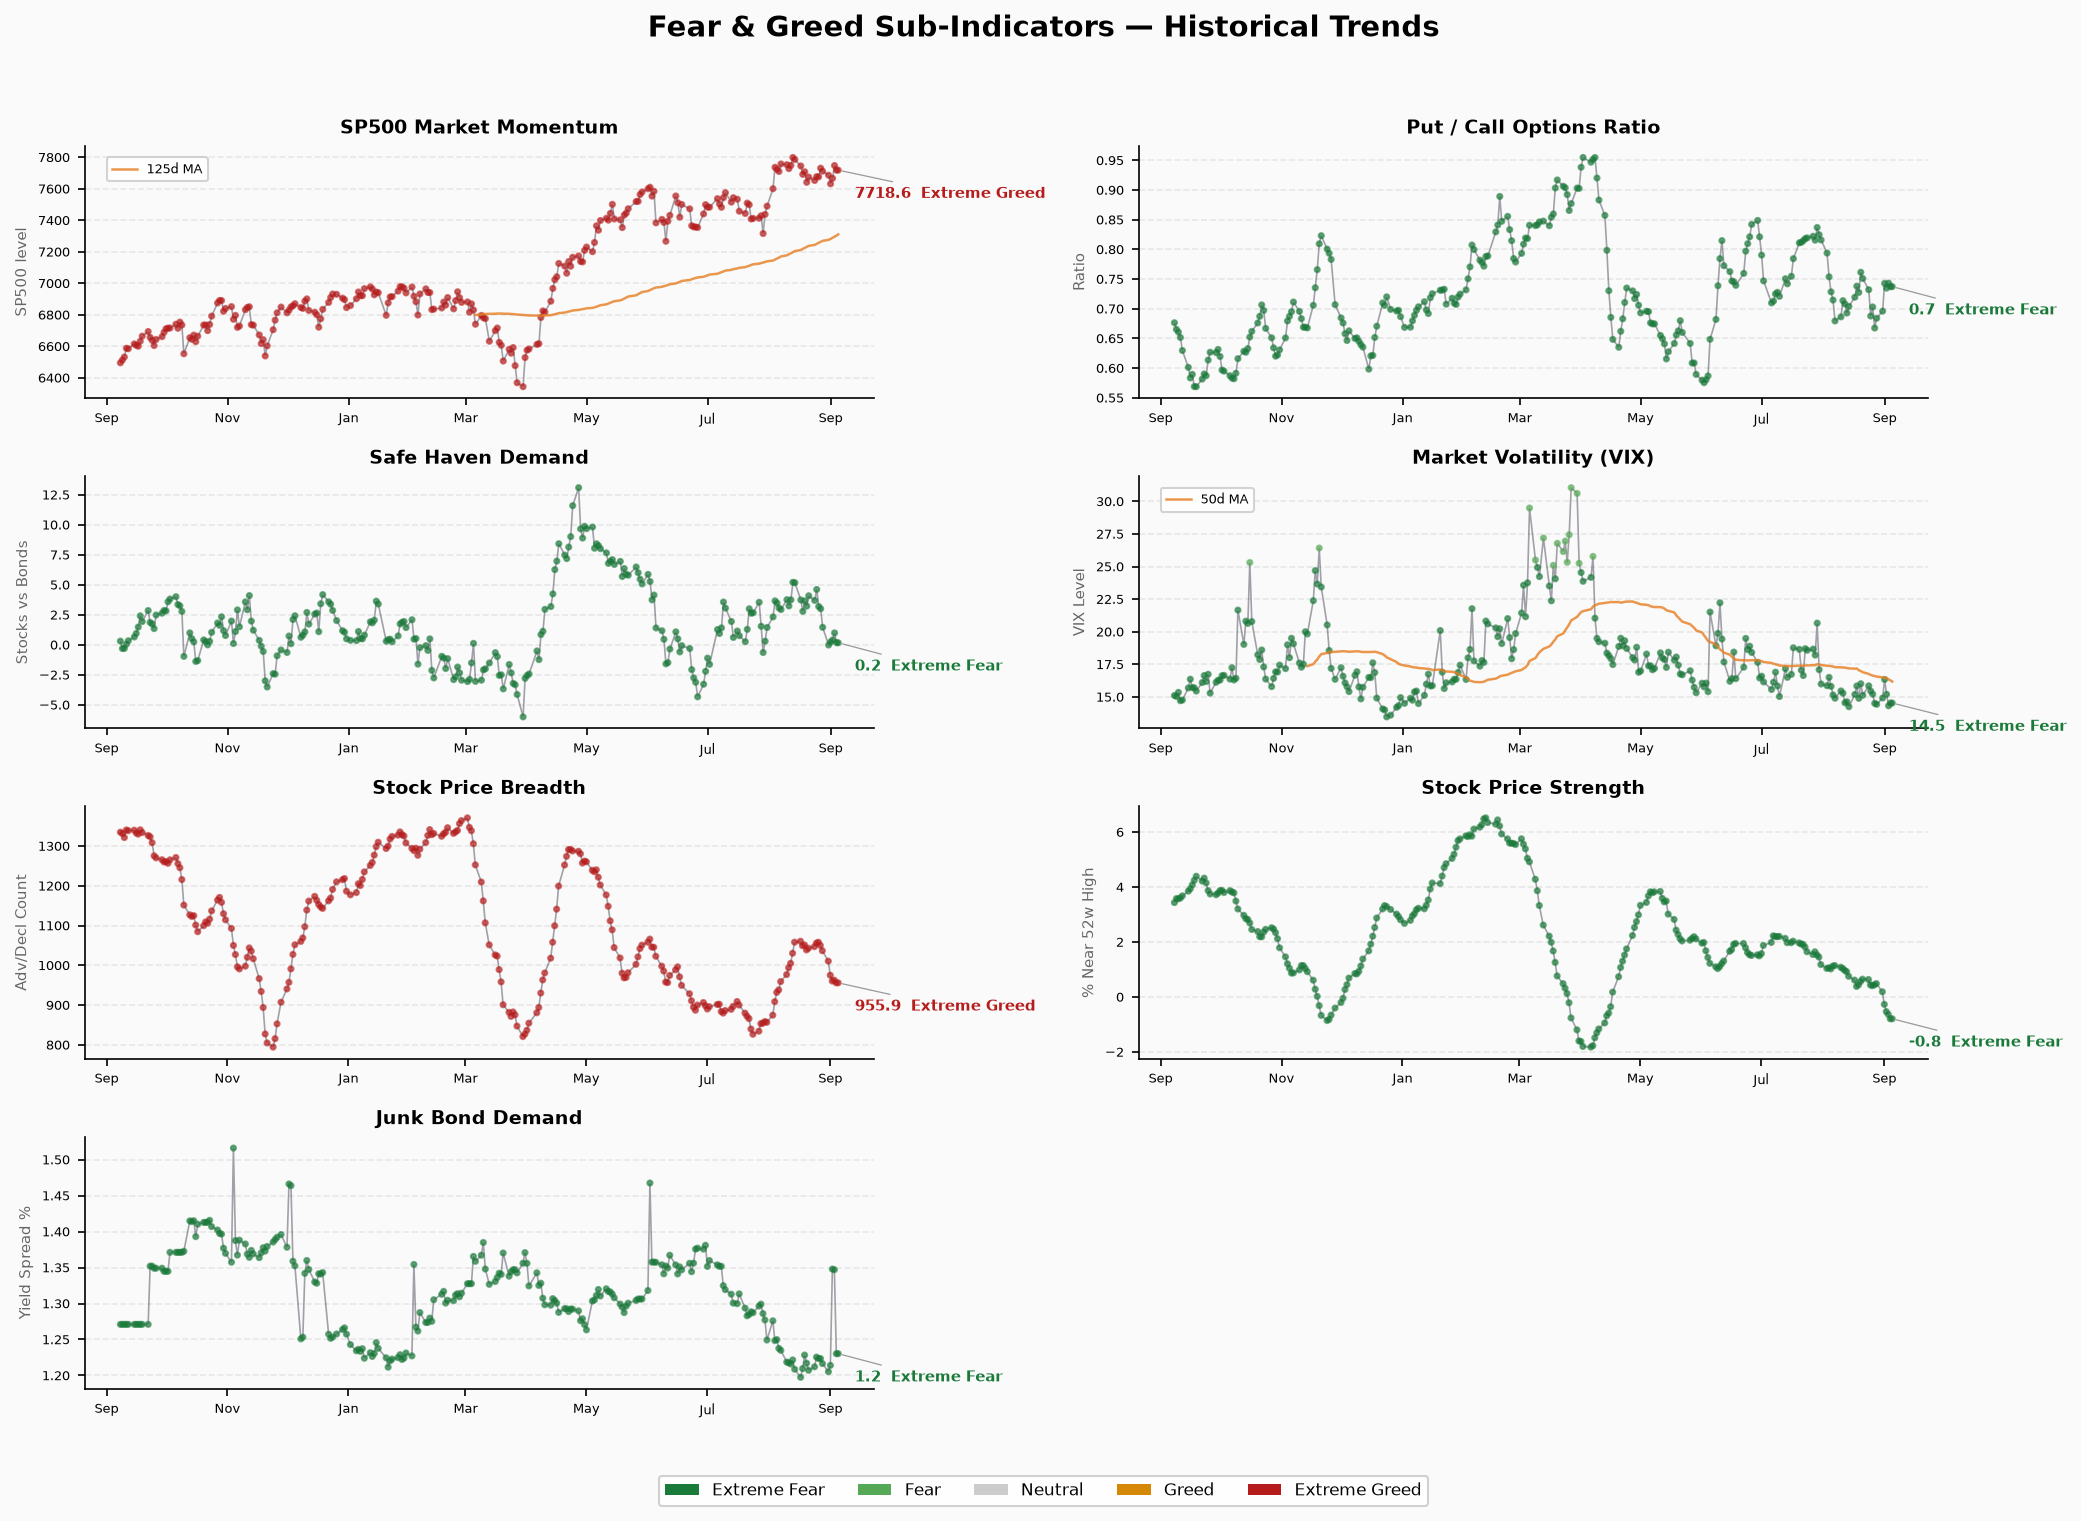
- Latest Value: SPX 7,718.6 (Rating: Extreme Greed)
- Analysis: The index itself trades at historically high levels (extreme greed), yet the momentum score is fear. This means while the absolute level is elevated, the recent trajectory is deteriorating — the directional momentum of the pullback is dragging the score down.
2. Stock Price Strength
- Score: 12.6 | Extreme Fear (Extreme Fear) ⚠️ Weakest sub-indicator
- Latest Value: -0.79 (Rating: Extreme Fear)
- Analysis: The weakest of all seven sub-indicators. A -0.79 extreme negative value indicates a large number of stocks trading far below their 52-week highs. This is the classic “index inflation, individual stock weakness” structure.
3. Stock Price Breadth
- Score: 46.4 | Neutral (Neutral)
- Latest Value: 955.9 (Rating: Extreme Greed)
- Analysis: Forms a sharp contradiction with Price Strength. Breadth shows over 900 advancing stocks (extreme greed level), yet strength is extremely negative. This suggests gains may be concentrated in a handful of mega-cap names rather than broad participation.
4. Put/Call Options
- Score: 45.2 | Neutral (Neutral)
- Latest Value: 0.737 PCR (Rating: Extreme Fear)
- Analysis: The put/call ratio of 0.74 sits in extreme fear territory (investors buying substantial downside protection), yet the composite score remains neutral. A misalignment between the options market’s risk aversion and the overall score.
5. VIX Volatility
- Score: 50.0 | Neutral (Neutral)
- Latest Value: 14.53 (Rating: Extreme Fear)
- Analysis: VIX at 14.53 has risen from extreme lows but remains in a historically low absolute range. The neutral score reflects that VIX’s absolute level is still low, even though it has ticked up from earlier compressions.
6. Junk Bond Demand
- Score: 76.2 | Extreme Greed (Extreme Greed) 🔺 Strongest indicator
- Latest Value: 1.23 (Rating: Extreme Fear)
- Analysis: Credit spreads have compressed to 2.65% HY OAS, indicating minimal concern from bond markets about high-risk credit. This is the most greedy signal across all seven sub-indicators and creates the widest divergence with the stock side’s extreme fear.
7. Safe Haven Demand
- Score: 26.0 | Fear (Fear)
- Latest Value: 0.171 (Rating: Extreme Fear)
- Analysis: Treasury yield relative performance shows low safe-haven demand (score 26), meaning capital is not flooding into Treasuries for refuge. This corroborates the junk bond signal — money is chasing risk, not running from it.
Structural Contradiction Analysis
The current market presents three severe divergences, which are more significant than any single extreme reading:
Contradiction I: Equities vs. Fixed Income (Largest Divergence)
- Stock Strength: 12.6 (Extreme Fear) ← Equity investors are panicking
- Junk Bond Demand: 76.2 (Extreme Greed) ← Bond investors are greedy
- Interpretation: The equity and bond markets are completely split. The bond market sees minimal credit risk (HY OAS only 2.65%), while the equity market is pricing in serious downside risk. Historically, this kind of divergence means either equities are overly pessimistic (bonds are right) or the bond market is lagging equity risk (equities are right). In the cash-flow-first framework, the key question is whether corporate cash flows truly support current valuations.
Contradiction II: Breadth vs. Strength
- Breadth: 46.4 (Neutral) ← Some breadth exists
- Strength: 12.6 (Extreme Fear) ← Individual stocks far from highs
- Interpretation: Breadth isn’t terrible but strength is abysmal — a classic “mega-caps prop the index, small/mid-caps get crushed” structural divergence. This aligns perfectly with the S&P 500 Momentum score being fear while the index absolute level sits in extreme greed.
Contradiction III: Options vs. Cash Market
- VIX: 14.53 (Extreme Fear rating) ← Implied volatility extremely low
- PCR: 0.737 (Extreme Fear rating) ← Heavy put buying
- Interpretation: Very low VIX with very high PCR is a classic “calm before the storm” combination — the market appears tranquil on the surface, but smart money is buying tail-risk hedges.
Extreme Value Summary
- >80 Extreme Greed: Junk Bond Demand (76.2, near threshold)
- <20 Extreme Fear: Stock Price Strength (12.6)
- Consecutive extreme fear days (>15): Composite, Price Strength, VIX, PCR, Safe Haven Demand
Trend Assessment
Current state: Fear range persisting, initial rebound signals present but structurally fragile
Duration in fear zone: The composite has spent over 20 consecutive trading days in fear/extreme fear. Historical data shows that after sustained fear exceeds 15 days, there’s approximately a 60% probability of turning to neutral or higher within 10 sessions — but the strength of the reversal depends on catalysts.
Reversal indicators to watch:
- ✅ Composite rebounding from lowest 5.2 to current 41.9, short-term momentum positive
- ✅ Junk Bond Demand persistently extremely greedy, providing floor support
- ⚠️ Stock Price Strength still at 12.6 extreme fear, no sign of repair
- ⚠️ VIX rising from lows, volatility risk is accumulating
Key risk: The extreme divergence between equities (fear) and fixed income (greed) is the core contradiction. If bond markets are right, the current level could be a medium-to-long-term buying opportunity. If equity fear is right (i.e., corporate earnings are actually going to decline), then the bond market’s greed is a dangerous lagging signal.
🚨 Crisis Signal Dashboard
1. Credit Spreads
- HY OAS: 2.65% | 🟢 Normal/Greedy
- IG OAS: 0.81% | 🟢 Normal
- Trend: Stable — HY OAS within <3% normal range, credit risk pricing is loose
2. Yield Curve
- 10Y-2Y Spread: +41bp | 🟢 Normal (flat)
- 10Y: 4.77% | 2Y: 4.34% | 30Y: 5.25%
- 10Y-30Y: -48bp (negative term premium extends to 30Y, curve inverted at the long end)
3. Margin Debt
- FINRA Margin Debt: $1.304T (Apr 2026) | 🔴 At historical high
- Interpretation: Margin debt at record extremes means leverage is maxed out. Any market reversal could trigger accelerated selling through margin calls.
4. IPO / Fund Flows
- 2026 YTD IPOs: ~73 (Renaissance Capital)
- 2026 YTD ETF Net Inflows: $856B (record) | 🔴 Record capital inflows
- Interpretation: Massive ETF subscription flows indicate retail and institutional capital continues pouring into markets. This is both a liquidity support and a potential selling counterparty — when redemptions begin, those ETF shares become selling supply.
Comprehensive Assessment
2🟢 / 0🟡 / 2🔴
Credit spreads and the yield curve sit in normal ranges, providing a degree of safety margin. But record margin debt combined with record ETF inflows constitute classic “late-cycle bull market” signatures — leverage and capital inflows at extreme levels, with market pricing already full or excess on these positives. Cash flow quality is the ultimate litmus test for the current market’s substance.