CNN Fear & Greed Analysis 2026-09-05
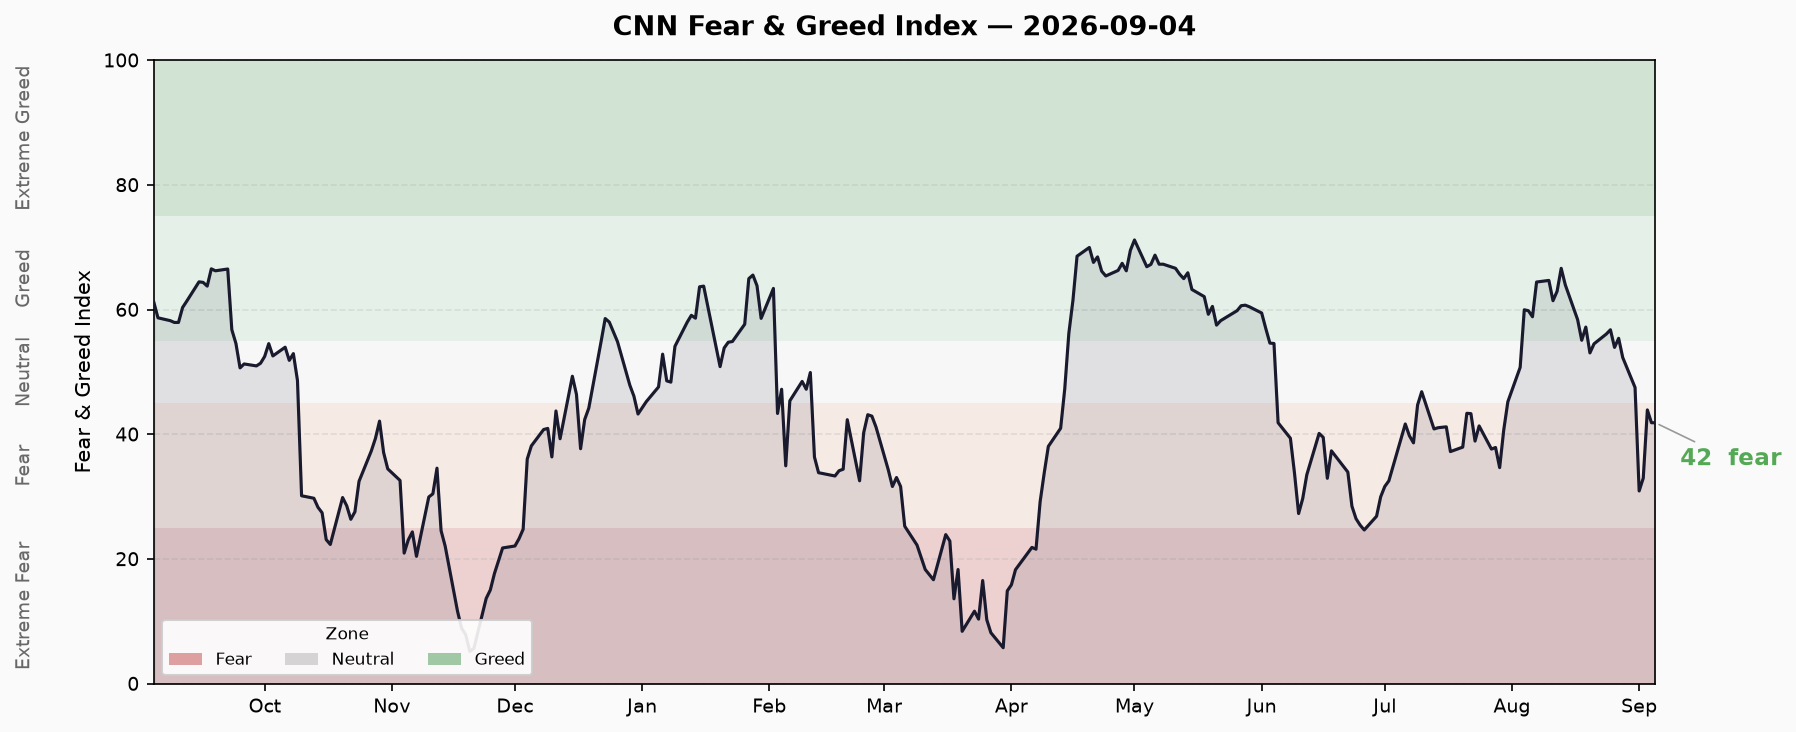
Saturday morning snapshot (9/5): CNN FNG updated through the Friday 9/4 close at 41.86 (fear). IMPORTANT: CNN has retroactively revised the 9/2-9/3 history today (continuation of the junk-bond indicator algorithm revision) — 9/3 was revised up from 35.26 (as reported yesterday) to 43.91 (+8.65), 9/2 from 33.23 to 32.97 (-0.26), while the API's previous_close field (35.23) still shows the pre-revision value and is deprecated. On the revised basis, 9/4 (41.86) is down -2.05 pts from 9/3 (43.91), and the composite has rebounded +10.95 pts (+35.4%) in three sessions from the 9/1 low of 30.91 — a materially stronger rebound than yesterday's data suggested. S&P 500 fell -0.38% on 9/4 (7,747.71 → 7,718.60), momentum pulled back (42.6 → 36.6); stock price strength made new cycle lows (-0.7936, score 12.6 extreme fear); safe-haven demand collapsed (0.9931 → 0.1714, score 26.0) — equity-side risk-off is deepening. Junk bond demand flipped violently: the HY/IG spread ratio tightened from 1.3470 to 1.2303 (-8.7%), score flipping from yesterday's 12.2 (extreme fear) to 76.2 (extreme greed), partly due to the algorithm revision. Structure shows a rare "credit warming vs equity breakdown" divergence. Crisis dashboard (FRED 9/3): HY OAS 2.65% (-1.0bp), IG OAS 0.81% both normal, 10Y-2Y +41bp normal-flat (-2bp); margin debt $1.417T July (MoM -5.6%, record largest monthly drop, RED), IPO 2026 proceeds $145.8B (105 deals) +542% (YELLOW), ETF inflows YTD >$1.4T record (RED). Summary 3 GREEN / 1 YELLOW / 2 RED.
Composite Index Overview
- Latest Score: 41.86 — Fear
- Data Through: 9/4 (Friday) US close
- Previous Close (revised): 43.91 — Fear (9/3, revised up +8.65 by CNN today)
- Daily Change (revised): -2.05 pts
- Weekly Change: -10.45 pts (vs 52.31 on 8/28)
- Monthly Change: -18.11 pts (vs CNN 1-month baseline 59.97)
- Yearly Change: -19.31 pts (vs CNN 1-year baseline 61.17)
⚠️ Data Revision Note (must read): CNN performed a second round of retroactive revisions on the historical series between 9/4 and 9/5 (continuation of the junk-bond indicator algorithm revision). Revisions: 9/2 from 33.23 to 32.97 (-0.26), 9/3 from 35.26 to 43.91 (+8.65); the 9/1 low of 30.91 is unchanged. The API’s previous_close field still shows the pre-revision 35.23 (not synced) — computing the daily change from that field (+6.63) is an artifact of the revision mismatch; this report uses the revised basis throughout. Sub-indicator raw values (S&P level, strength, breadth, put/call, VIX, spread ratio) for 9/2-9/3 are unchanged — the revision stems entirely from CNN’s remapping of the junk-bond sub-indicator normalization.
After Friday’s 9/4 close, CNN updated the composite to 41.86 (fear), down -2.05 pts from the revised 9/3 reading of 43.91. S&P 500 slipped -0.38% to 7,718.60, momentum fell from 42.6 to 36.6 (-6.0); stock price strength made new cycle lows (-0.7936, score 12.6 extreme fear); safe-haven demand dropped sharply from 0.9931 to 0.1714 (score 26.0) — equity-side risk-off is deepening. The composite sits in the upper band of the fear zone (41.86 within 25-45), only 3.1 pts from the neutral line at 45, but is up +10.95 pts (+35.4%) from the 9/1 low of 30.91 — the “bottoming” read from yesterday’s data should be upgraded to “consolidating near the top of the fear zone after a fast repair.”
Last 10 Trading Days Trend
| Date | Score | Rating |
|---|---|---|
| 8/24 | 56.09 | Greed |
| 8/25 | 56.77 | Greed |
| 8/26 | 53.94 | Neutral |
| 8/27 | 55.40 | Greed |
| 8/28 | 52.31 | Neutral |
| 8/31 | 47.51 | Neutral |
| 9/1 | 30.91 | Fear |
| 9/2 | 32.97 | Fear |
| 9/3 | 43.91 | Fear |
| 9/4 | 41.86 | Fear |
(Note: 9/2-9/3 are CNN’s revised values from today; 9/1 is the first-round junk-bond revision backfill.)
Trend read: after topping at 66.63 on 8/13, the index chopped in a 53-57 band for 7 sessions (8/20-8/28), broke below on 8/31 (47.51), crashed -16.6 pts to 30.91 on 9/1 (lowest since 4/8/2026), then repaired quickly over three sessions to 41.86 (+10.95 pts, +35.4%), touching 43.91 on 9/3 before giving back a little on 9/4. On the revised basis the pattern is “slow decline → crash → fast 3-day repair,” recovering roughly 66% of the crash (30.91 → 41.86 vs 47.51 → 30.91). This materially upgrades the rebound versus yesterday’s data (“weak 2-day repair, +4.4 pts”) — the “bottoming, don’t chase” stance based on 35.26 needs re-assessment: the index is back at the top of the fear zone, one step from the neutral line. Support: 35, then 30.91. Resistance: 45 neutral line, then 47.51 (8/31).
Seven Sub-Indicators Scan
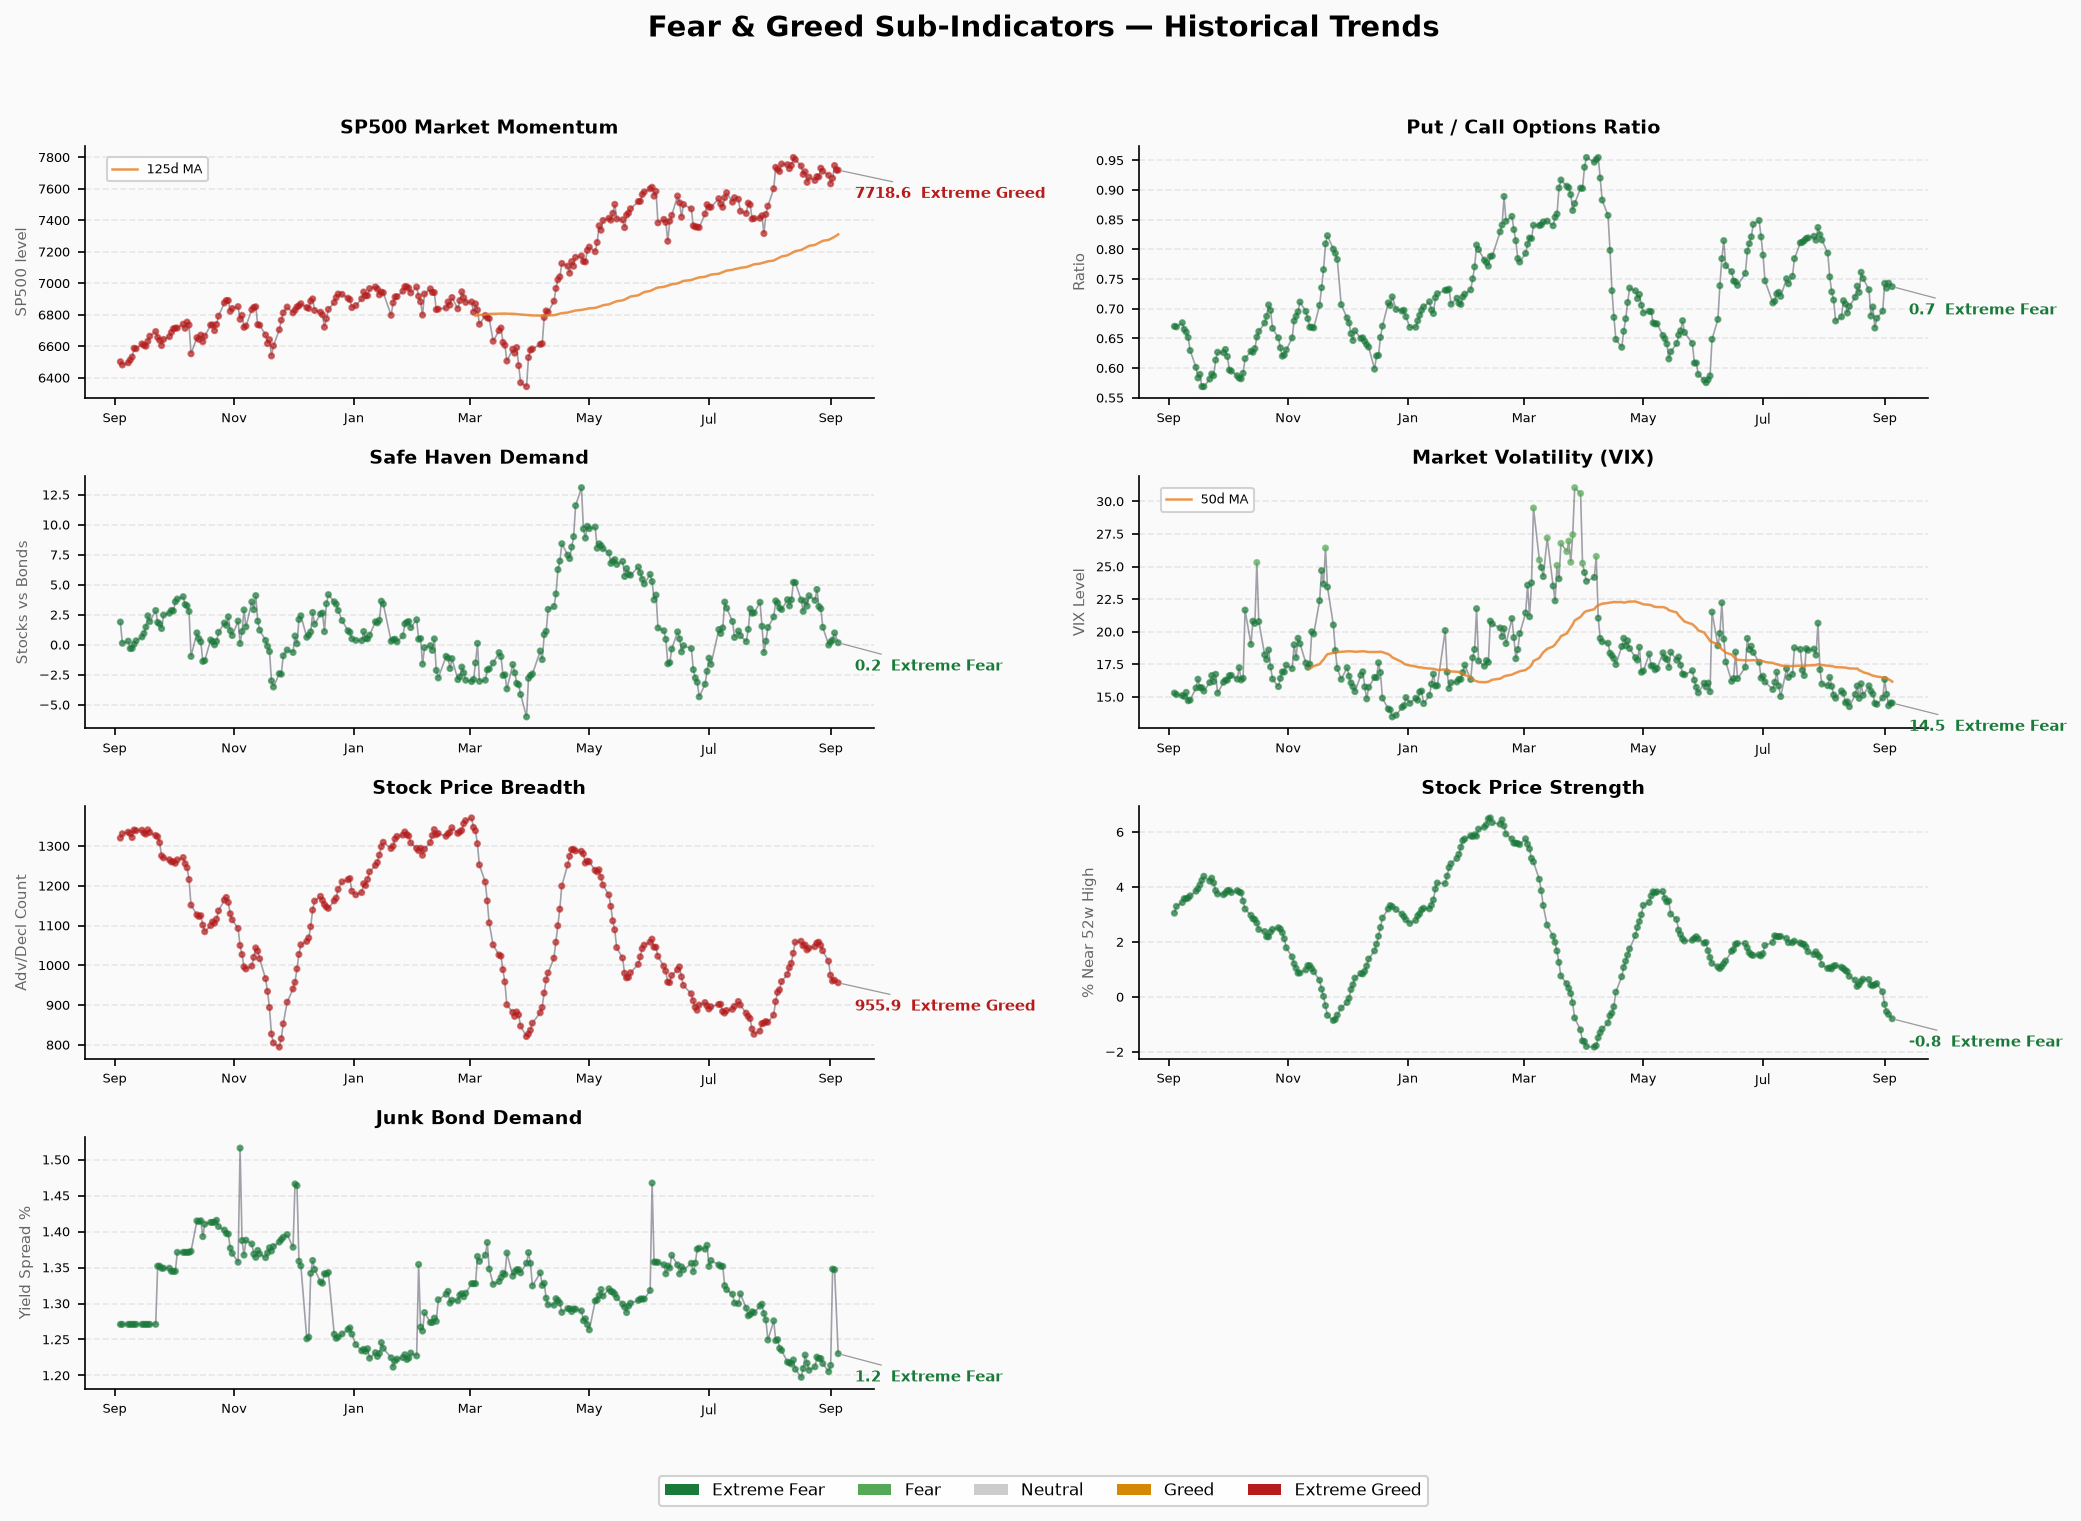
Market Momentum: 36.6 — Fear ⚠️ Pulled back
- Raw: S&P 500 @ 7,718.60 (9/4), prior 7,747.71 (9/3), -29.11 (-0.38%)
- Direction: down (42.6 → 36.6, -6.0), giving back more than half of the 9/3 repair
- Read: S&P slipped -0.38% on 9/4; momentum fell to 36.6. The index sits ~-1.0% below the 8/13 high of 7,798.99; momentum shifted from “repair” to “pullback,” one of the main drags on the composite’s small give-back
Stock Price Strength: 12.6 — Extreme Fear ⚠️ New cycle low
- Raw: -0.7936 (share of stocks near 52-week highs, 9/4), prior -0.6328 (9/3)
- Direction: deteriorating for a 5th straight session (-0.6328 → -0.7936, -0.161; score 15.8 → 12.6)
- Read: the proportion of stocks falling below their 52-week highs keeps widening; strength is at its worst level of 2026. This is the heaviest drag on the index — the weighted market is holding (S&P only -0.38%) while individual-stock momentum keeps breaking down; rebound-quality concerns persist
Stock Price Breadth: 46.4 — Neutral
- Raw: 955.93 (new highs minus new lows, 9/4), prior 962.74 (9/3)
- Direction: slightly lower (-6.8; 47.8 → 46.4), second straight decline
- Read: the high/low differential edged down to 955.93, breadth slipping below 47. The gap vs strength (12.6, extreme fear) remains wide — new highs still exceed new lows, but the share near 52-week highs is deeply negative (-0.7936). Breadth is hovering near 46 and did not follow the 9/2-9/3 composite repair
Put/Call Options: 45.2 — Neutral
- Raw: 0.7373 (P/C ratio, 9/4), prior 0.7432 (9/3)
- Direction: slightly lower (-0.006; 43.8 → 45.2), back into neutral
- Read: the P/C ratio eased to 0.7373, put protection buying modestly retracing from 9/3’s high (0.7432); options-side hedging pressure marginally eased. But 0.73+ remains in the elevated range since late July — hedgers have not exited meaningfully
Market Volatility (VIX): 50 — Neutral
- Raw: 14.53 (9/4), prior 14.32 (9/3)
- Direction: slightly up (+0.21), still very low
- Read: VIX edged up to 14.53, a fourth session in the very low 14.3-14.9 platform. Tail-risk is still cheaply priced — the -0.38% index move only lifted VIX +1.5%; if the decline resumes, VIX has room to spike
Junk Bond Demand: 76.2 — Extreme Greed ⚠️ Violent flip
- Raw: 1.2303 (HY/IG spread ratio, 9/4), prior 1.3470 (9/3)
- Direction: ratio tightened sharply (-0.117, -8.7%); score flipped from 12.2 (extreme fear) to 76.2 (extreme greed)
- Read: ⚠️ Split it apart: the real spread-ratio improvement (1.3470 → 1.2303) is genuine (credit warming), but much of the +64-pt score jump comes from CNN’s junk-bond algorithm revision (the +8.65 composite revision for 9/3 is fully explained by this sub-indicator’s remap). FRED’s HY OAS at 2.65% (9/3) moved only -1bp, out of step with the ratio’s move — the two gauges have different constructions. Directional conclusion: marginal credit improvement is real, but the “76.2 extreme greed” reading carries revision water and should not be over-extrapolated
Safe Haven Demand: 26.0 — Fear ⚠️ Sharp drop
- Raw: 0.1714 (20-day stock vs bond excess return, 9/4), prior 0.9931 (9/3)
- Direction: plunged (0.9931 → 0.1714, -0.82; 34.6 → 26.0), largest one-day drop in the recent window
- Read: the 20-day equity-vs-bond excess return collapsed from near 1.0 to 0.17 — money rotated back to bonds on 9/4. The indicator is a 20-day rolling window; 9/3’s 0.9854 partly embedded mid-August equity strength, so today’s fall is partly a window-roll effect. But if it keeps sliding below 0, it would confirm “stocks underperforming bonds” — a deepening risk-off signal
Structural Contradiction Analysis
Core structure: rare “credit warming vs equity breakdown” polarization (junk bonds 76.2 vs strength 12.6, a 63.6-pt gap)
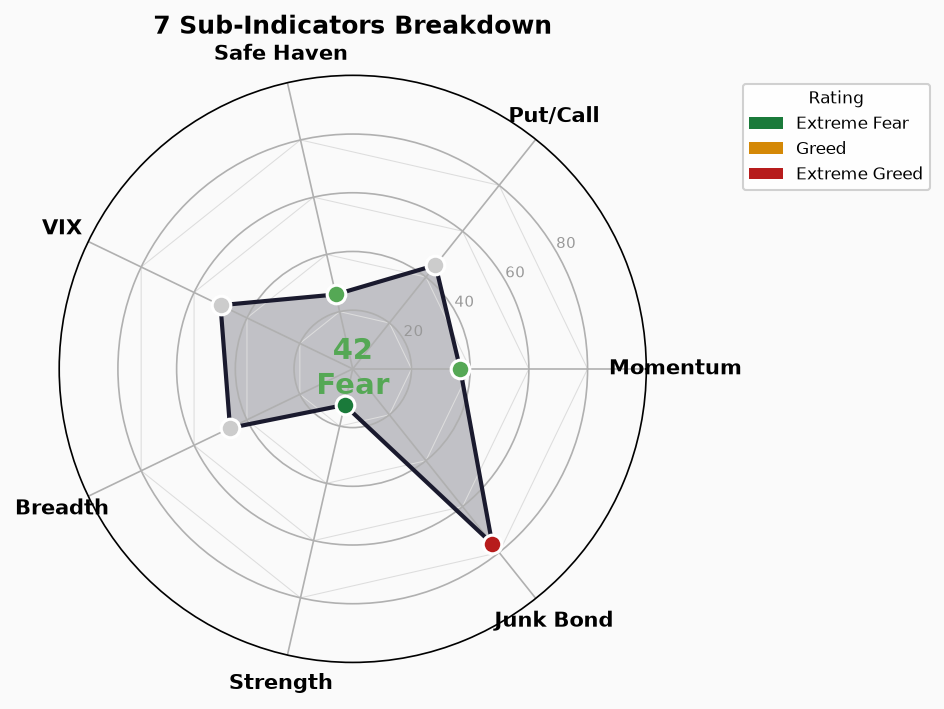
Revised sub-indicator distribution: extreme greed 1 (junk bonds 76.2), extreme fear 1 (strength 12.6), fear 2 (safe haven 26.0, momentum 36.6), neutral 3 (P/C 45.2, breadth 46.4, VIX 50.0). Yesterday’s “zero-greed, all risk-off” structure is broken, replaced by polarization:
- Junk bonds 76.2 (extreme greed) vs strength 12.6 (extreme fear) — the widest crack on the board: credit spreads tightened sharply (1.3470 → 1.2303) with CNN’s read flipping to extreme greed, while the share of stocks near 52-week highs made new 2026 lows. Two extremes in opposite directions. Historically, credit leads individual-stock breadth by weeks — if credit warming persists, equity breadth should follow with a lag; but if the ratio re-widens, Thursday’s tightening was revision noise. Current evidence: FRED HY OAS moved only -1bp, supporting “partly algorithm noise” — the real credit improvement is modest
- Safe haven 26.0 (0.1714) vs junk bonds 76.2 (1.2303) — intra-bond-market contradiction: money buying Treasuries (equity excess return collapsing to 0.17) while credit spreads tighten — Treasury risk-off coexisting with credit appetite is a “risk-off concentrated in the equity/rates complex, credit not yet pricing risk” combination. If credit spreads catch down later, it confirms the equity weakness; if they hold, the 9/1 crash looks more like an equity-internal deleveraging than systemic risk-off
- Strength 12.6 vs breadth 46.4 (persisting): new-high/new-low differential still positive (955.93) while the near-52-week-high share is deeply negative — gains are concentrated in top weights; the -0.38% index dip masks broad individual-stock weakness
- VIX 50 (14.53) vs strength 12.6: extremely low volatility coexisting with collapsing individual-stock momentum; downside is still priced cheaply. A decisive break above the multi-week 14.5 platform would be an early confirmation of deteriorating risk appetite
Secondary observation — revision impact on conclusions: yesterday’s report, based on 9/3 = 35.26, judged “bottoming, don’t chase.” After today’s revision (9/3 = 43.91, 9/4 = 41.86), the rebound grade is upgraded to ~66% recovery of the crash. The revision does not change the fact that individual-stock strength is the weakest link, but it does change the rebound’s scale — the market data didn’t change, CNN’s normalization did. Going forward, always default to the latest API historical series if further revisions appear.
Trend Assessment
- Zone: Upper band of the fear zone (25-45), 41.86 on 9/4; only 3.1 pts below the neutral line (45), 16.9 pts above extreme fear (25). Up +10.95 pts (+35.4%) in three sessions from the 9/1 low of 30.91 — rebound scale upgraded vs yesterday’s basis
- Direction: 8/13 top 66.63 → 7-day 53-57 chop → 8/31 breakdown (47.51) → 9/1 crash (30.91) → 3-day fast repair (41.86, peaking at 43.91 on 9/3). Direction shifted from “bottoming” to “consolidating near the top of the fear zone”; the key line is 45 — breaking it confirms the repair cycle (echoing the June bottom’s rebound to 46.83 in mid-July); rejection sets up a retest of 35-30.91
- Key watch points (next update after 9/7 US close):
- Can it break the 45 neutral line? The 9/3 high of 43.91 is only 1.1 pts away; 9/4’s give-back shows waning momentum; a break of 45 upgrades the repair, failure means a 41-44 band
- Does stock price strength (-0.7936) stabilize? Five straight sessions of deterioration make it the #1 quality check for the rebound; a recovery above -0.5 would signal real breadth repair
- Can safe-haven demand (0.1714) hold above zero? A break below 0 confirms 20-day stock underperformance vs bonds (deepening risk-off); holding means Thursday’s plunge was window noise
- Does the junk-bond spread ratio (1.2303) stay tight? The most real-time credit signal; confirmation if FRED HY OAS moves lower in sync
- Momentum (S&P 7,718.60) vs its 125-day MA: score 36.6 is still in the fear zone; losing the MA sends momentum lower
- Historical parallel: compare to the June bottom band (6/10 27.29, 6/26 24.66, 6/30 29.97) — FNG bottomed and rebounded to 46.83 by mid-July. This cycle’s 9/1 low (30.91) is similar in depth but the repair is faster (3 days +35.4% vs ~2 weeks in June), and the internals differ: strength (-0.7936) is far weaker than late June, while credit (1.2303) is far stronger — the “credit first, stocks later” dislocation means sustainability depends on when the strength gauge stops falling. Action: with sentiment back at the top of the fear zone, the “don’t chase rebounds” principle stands — wait for either “strength stabilizing + break of 45” or “pullback to 35-30.91 with strength stabilizing in tandem” as higher-odds re-entry signals
🚨 Crisis Leading Indicator Dashboard
1. Credit Spreads
- High-Yield OAS: 2.65% | 🟢 Normal (<3% normal | 3-5% caution | 5-8% panic | >8% crisis)
- Investment-Grade OAS: 0.81% | 🟢 Normal (<1% normal | 1-2% caution | >2% panic)
- Trend: slightly tighter (FRED 9/3, HY 2.66%→2.65% -1.0bp, IG 0.81% flat), absolute levels healthy
- Note: directionally consistent with the FNG junk-bond sub-indicator (76.2 extreme greed) but far milder in magnitude — FRED HY OAS moved only -1bp while CNN’s ratio tightened -8.7%; the two gauges’ rhythm gap persists. A break above the 3.0% HY OAS warning line would be the real credit-deterioration signal
2. Yield Curve
- 10Y-2Y Spread: +41bp | 🟢 Normal-flat (no inversion)
- 10Y: 4.77% | 2Y: 4.34% | 30Y: 5.25%
- 10Y-30Y: -48bp (30Y above 10Y, normal upward slope at the long end)
- Trend: 10Y-2Y narrowed from +43bp to +41bp (-2bp); yields drifted lower across the curve (10Y -2bp, 2Y -5bp, 30Y -2bp); curve shape stable, no inversion pressure
3. Margin Debt (FINRA)
- Latest: $1.417T (July 2026, FINRA official; August data expected third week of September)
- MoM: -$85B (-5.6% from June’s record $1.502T, the largest single-month decline in FINRA history)
- YoY: +38.6% (vs $1.022T in July 2025)
- Status: 🔴 Elevated, rolling over (the -$85B July print confirms deleveraging has started, but the absolute level remains historically high)
- Read: the record monthly drop shows the leverage amplifier cooling; net credit balance of -$995B is a record low (thinnest cash cushion on record). The “record margin debt + record passive inflows” combination remains the core systemic vulnerability — if August (released late September) extends the decline, the deleveraging cycle is confirmed; if it stabilizes, July was a one-off air pocket
4. IPO Market
- 2026 Stats: 105 IPOs (Renaissance Capital standard definition, ≥$50mm market cap, as of 9/1), proceeds $145.8B (+542.2% YoY), approaching 2021’s full-year record of $175B — driven by mega-deals led by SpaceX ($86.2B, largest ever, ~59% of YTD proceeds)
- Count: -26.1% YoY (vs 142 in the 2025 same period); August in the summer pause (10 deals, $1.8B, slightly above the 10-year August average); calendar expected to pick up after Labor Day (Anthropic reportedly planning to file, Aggreko estimated at $1.5B)
- Status: 🟡 Proceeds near records but count contracting; dependent on mega-deals, limited breadth
5. ETF Fund Flows
- 2026 YTD Net Inflows: US-listed >$1.4T (through August, State Street; August +$180B, ~3.8x the historical August average)
- Comparison: far above 2025’s full-year record of $1.52T — State Street projects the record falls around 9/22, with a full-year path to $2.3T; fixed-income ETFs took in $55B in August (4th straight month >$50B), YTD $407B approaching 2025’s annual record of $448B
- Status: 🔴 Record-high inflows
- Read: record passive inflows on top of elevated margin debt keep building systemic risk; a reversal would feed a stampede
Summary Assessment
- 🟢 Normal: 3 (HY OAS, IG OAS, yield curve)
- 🟡 Caution: 1 (IPO market)
- 🔴 Risk: 2 (margin debt, ETF inflows)
Conclusion: Saturday morning snapshot; CNN updated through Friday’s 9/4 close and retroactively revised 9/2-9/3 history (junk-bond algorithm), lifting 9/3 from 35.26 to 43.91. On the revised basis the composite is 41.86 (fear), -2.05 pts vs the prior session, +35.4% in three sessions from the 9/1 low of 30.91 — the rebound grade is upgraded, and “bottoming” should be revised to “consolidating near the top of the fear zone.” The structure shows a rare “credit warming vs equity breakdown” polarization: the junk-bond ratio tightened sharply (1.3470 → 1.2303, score flipping to 76.2 extreme greed with revision water) and FRED HY OAS eased to 2.65% — marginal credit improvement; but stock price strength made new 2026 lows (-0.7936, score 12.6), safe-haven demand collapsed (0.9931 → 0.1714), and momentum pulled back (42.6 → 36.6) — equity-side risk-off deepening. Crisis dashboard shows no new deterioration (FRED 9/3): credit spreads and the yield curve all 3 GREEN, IPO proceeds near records but count contracting (YELLOW), margin debt $1.417T with the largest monthly drop on record and ETF inflows YTD >$1.4T (2 RED). Action: sentiment is back at the top of the fear zone with the 45 neutral line as the pivotal level; the “don’t chase rebounds” principle stands — wait for either “strength stabilizing + break of 45” or “pullback to 35-30.91 with strength stabilizing.” The junk-bond ratio vs HY OAS rhythm gap and whether safe-haven demand breaks below zero are the two high-frequency gauges to watch next session.