CNN Fear & Greed Sentiment Analysis 2026-09-04
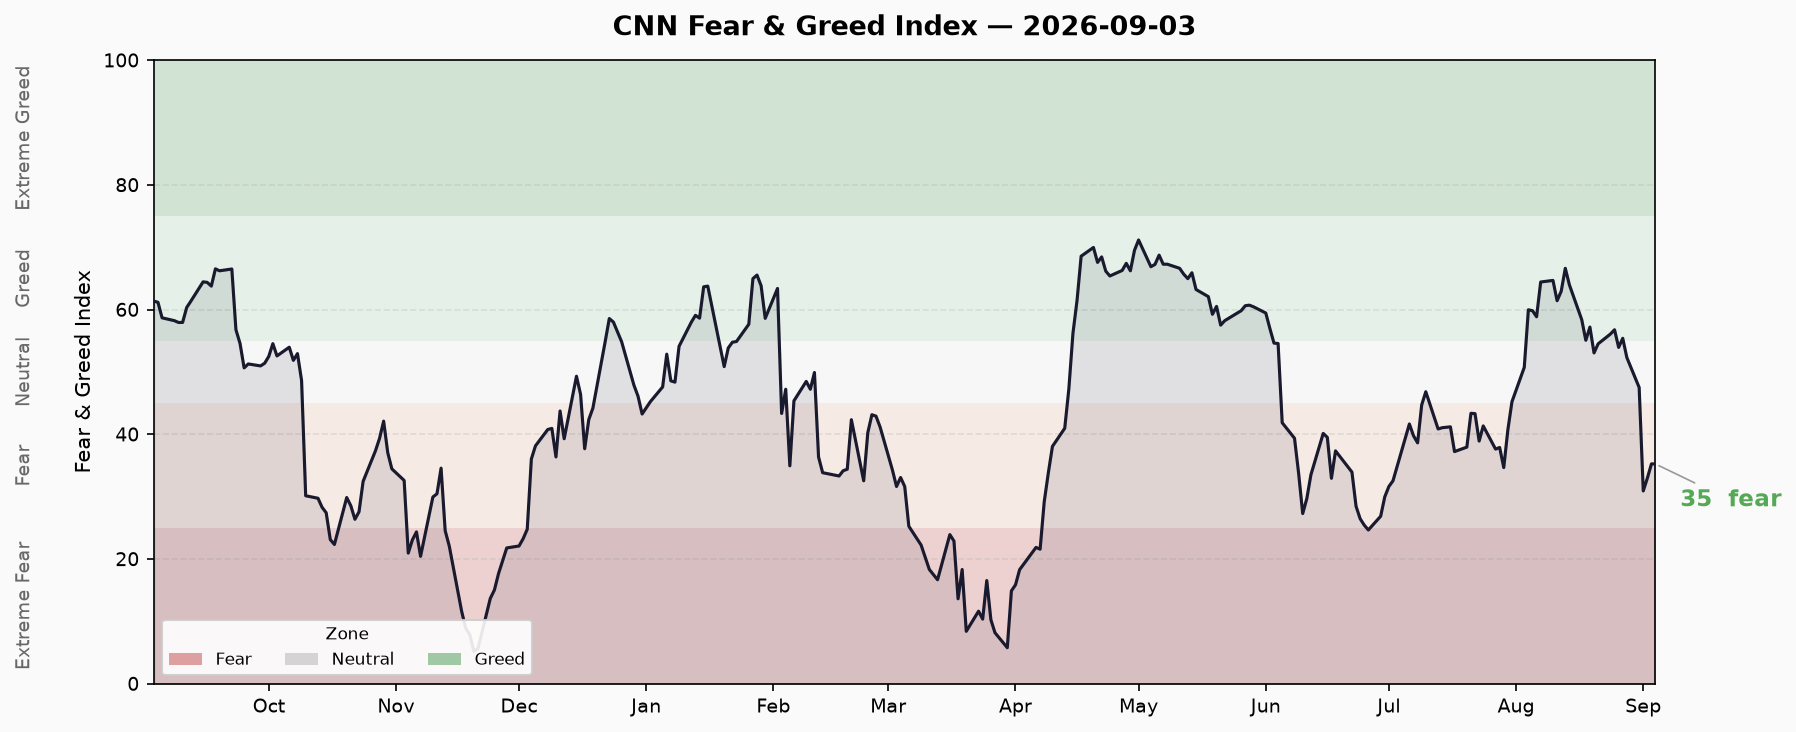
Friday morning snapshot (9/4): CNN FNG updated to 9/3 (Thursday) US close at 35.26 (Fear), up 2.0 points from the 9/2 close of 33.23 — the second straight session of marginal stabilization. S&P 500 rallied +1.06% on 9/3 (7,666.60 → 7,747.71), driving a major momentum repair (32.6 → 42.6, +10.0), the main lift behind the composite's recovery; safe-haven demand (0.4006 → 0.9854, +0.58; score 28.6 → 34.6) strengthened for a 3rd straight session and broke above the 0.5 watch line, adding to signs of a phase-one risk-off easing. However, stock price strength hit a fresh cycle low (-0.533 → -0.633, score 15.8 extreme fear), and junk bond demand remains at its post-revision extreme (12.2 extreme fear; spread ratio 1.3478 → 1.3470, roughly flat) — the full risk-off structure is unchanged. Since the 9/1 crash low of 30.91, the composite has recovered +4.4 points (+14.2%) over two sessions, but still sits mid-Fear: 10 points above the extreme-fear line (25) and 5 points above the June bottom band (24.66-29.97). Crisis precursors (FRED 9/2): HY OAS 2.66% normal (up +1.0bp), IG OAS 0.81% normal, 10Y-2Y +43bp normal-ish flat (+3bp vs prior); margin debt July $1.417T -5.7% MoM (🔴 record largest monthly drop), IPO 2026 proceeds $145.8B / 105 deals (Renaissance caliber) +542% (🟡), ETF flows YTD >$1.4T record (🔴). Total 3🟢/1🟡/2🔴.
Composite Index Overview
- Latest Score: 35.26 — Fear
- Data As Of: 9/3 (Thursday) US close
- Previous Close: 33.23 — Fear (9/2)
- Daily Change: +2.0 points
- Weekly Change: -18.7 points (vs 8/26’s 53.94)
- Monthly Change: -10.0 points (vs 8/3’s 45.23)
- Yearly Change: -27.2 points (vs 2025/9/3’s 62.46)
After the 9/3 (Thursday) US close, CNN updated: the composite rose another 2.0 points from 33.23 to 35.26 — the second straight session of recovery since the 9/1 crash, now +4.4 points (+14.2%) cumulatively. The drivers are clear: S&P 500 rallied +1.06% to 7,747.71, lifting momentum from 32.6 to 42.6 (+10.0, the largest single-day gain of this selloff); safe-haven demand jumped from 0.4006 to 0.9854 (+0.58), strengthening for a 3rd session and breaking above the 0.5 watch line. But sentiment remains mid-Fear: 10 points above the extreme-fear line (25) and 5 points above the June bottom band upper edge (29.97); stock price strength hit a fresh cycle low (-0.633), so the “quality” of the bounce is unconfirmed.
Last 10 Trading Days
| Date | Score | Rating |
|---|---|---|
| 8/20 | 53.06 | Neutral |
| 8/21 | 54.51 | Neutral |
| 8/24 | 56.09 | Greed |
| 8/25 | 56.77 | Greed |
| 8/26 | 53.94 | Neutral |
| 8/27 | 55.40 | Greed |
| 8/28 | 52.31 | Neutral |
| 8/31 | 47.51 | Neutral |
| 9/1 | 30.91 | Fear |
| 9/2 | 33.23 | Fear |
| 9/3 | 35.26 | Fear |
(Note: 9/1 is the post-revision value after CNN’s junk bond algorithm update; pre-revision it was 44.57.)
Trend: After peaking at 66.63 on 8/13, the index oscillated in a 53-57 band for 7 sessions (8/20-8/28), broke below 53 on 8/31 to 47.51, collapsed -16.6 points on 9/1 to 30.91 (lowest since 4/8/2026), then recovered for two straight sessions to 35.26 (+4.4 points, +14.2%). The pattern is “slow bleed → sharp crash → two-day repair,” with the repair clawing back only ~26% of the crash (30.91 → 35.26 vs 47.51 → 30.91) — a weak low-level bounce, not a trend reversal. Support below: 29.97-30.91 (June bottom band upper edge + 9/1 low), then the 25 extreme-fear line and the 6/26 low of 24.66; resistance above: 40-45 (the 8/31-9/1 gap lower edge). Sentiment phase: mid-Fear, bottoming out.
Sub-Indicator Scan
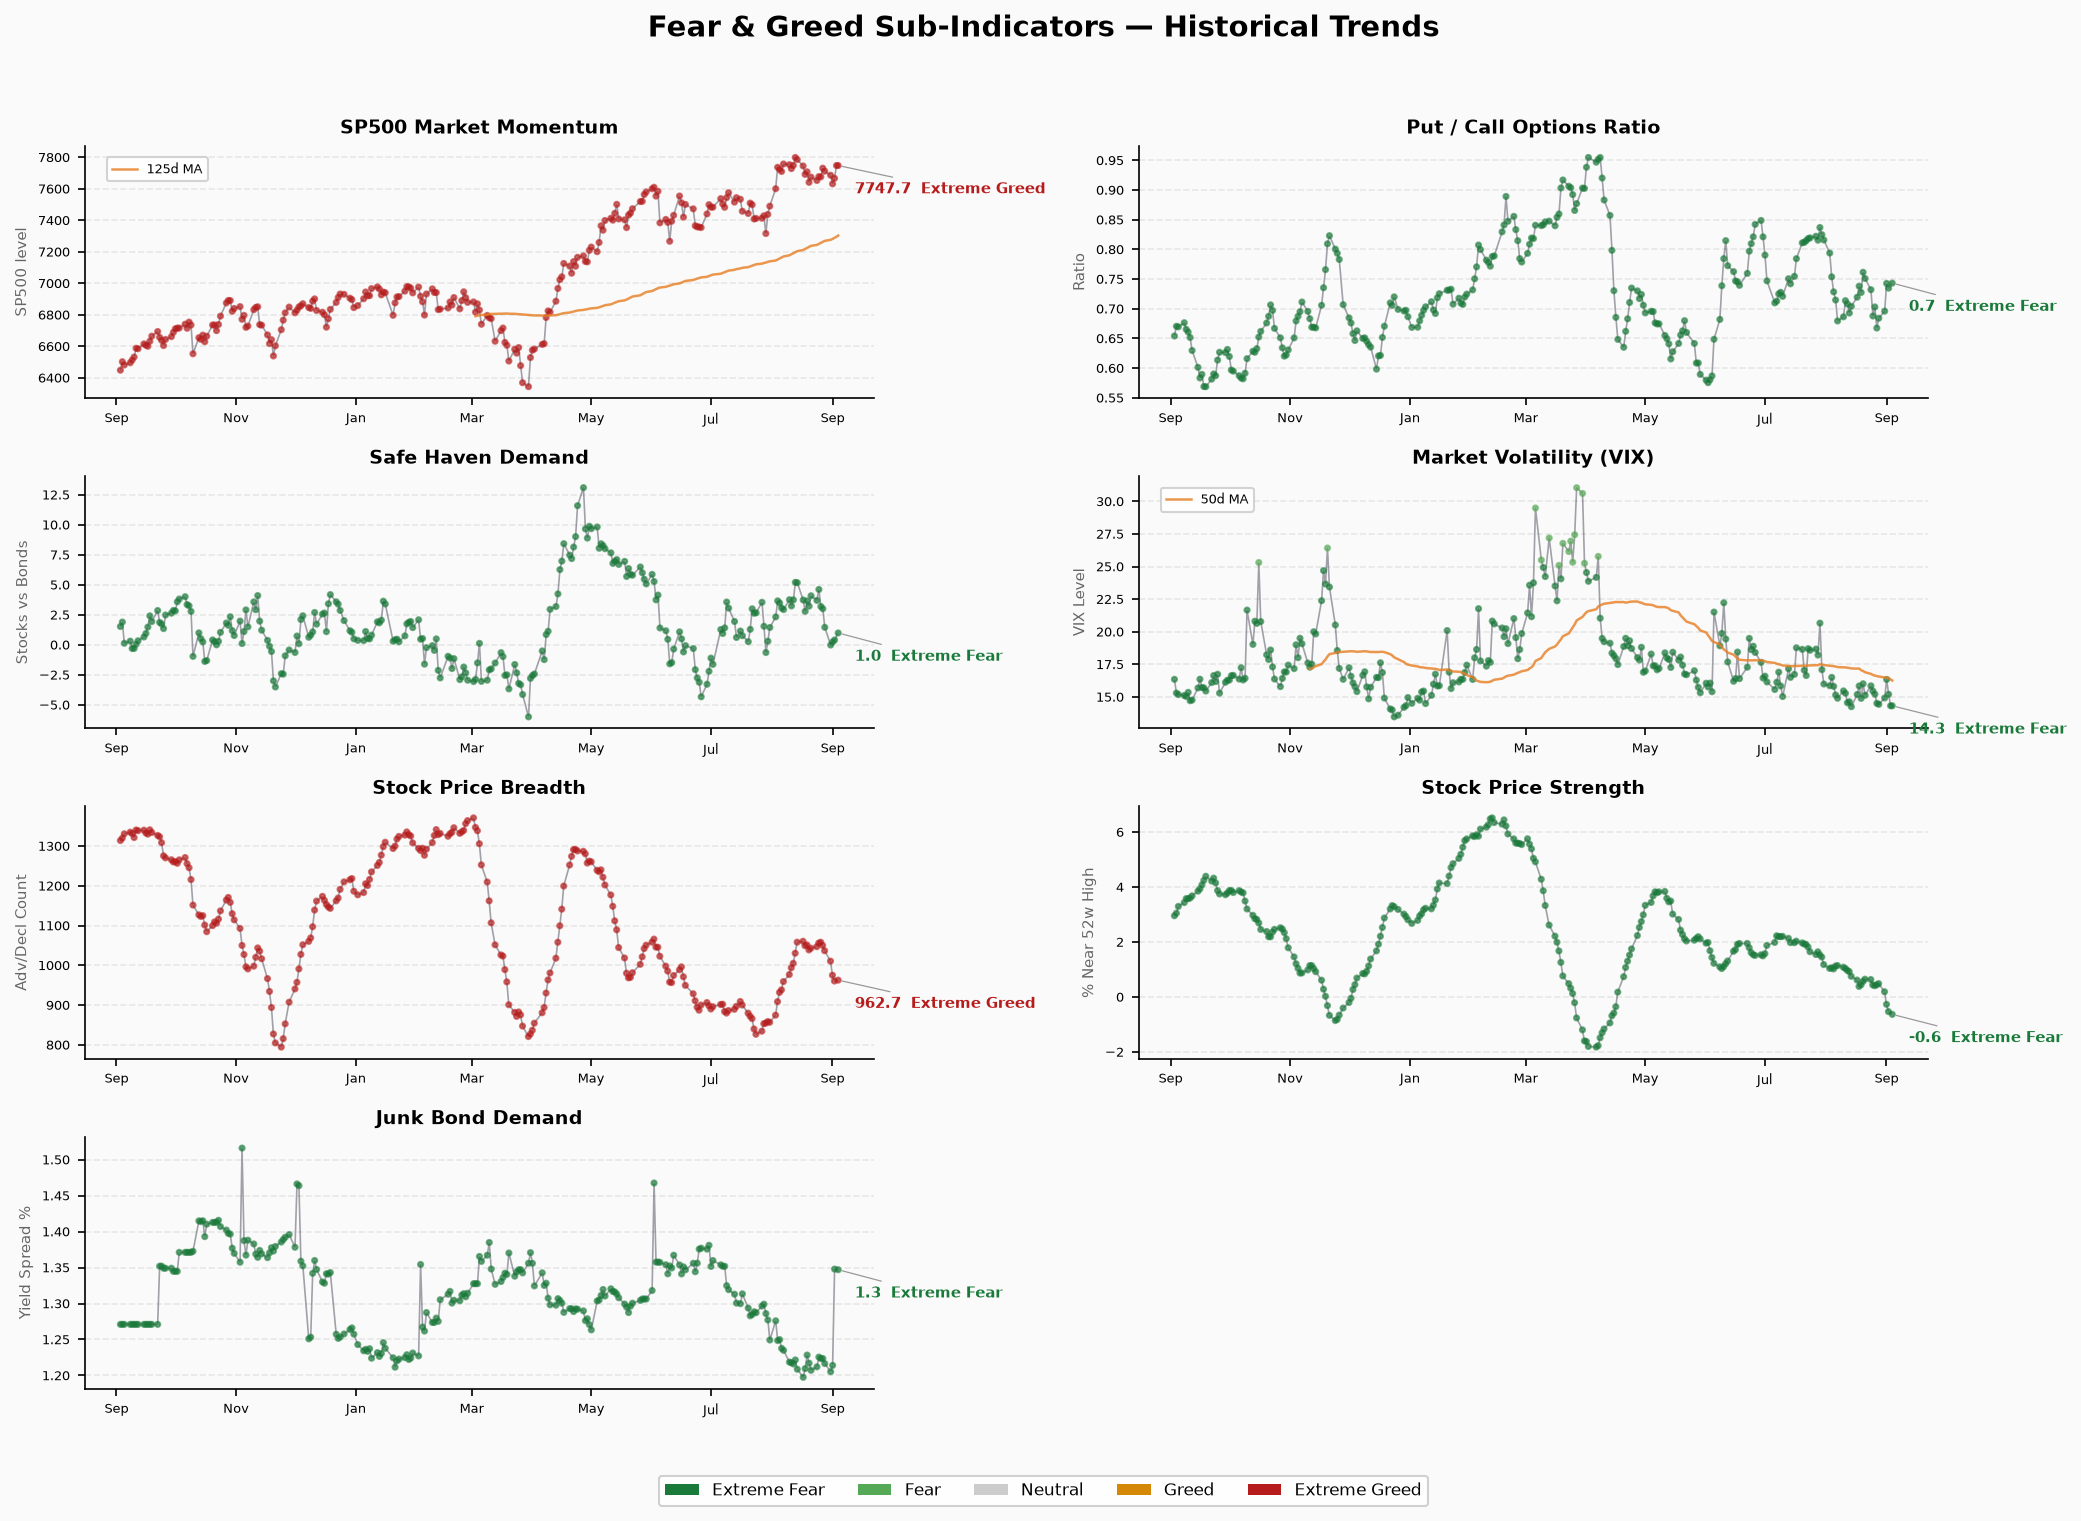
Market Momentum: 42.6 — Fear ⚠️ Major repair
- Raw: S&P 500 @ 7,747.71 (9/3), prior 7,666.60 (9/2), +81.11 (+1.06%)
- Direction: Up (32.6 → 42.6, +10.0), the largest single-day gain of this selloff
- Read: S&P 500 rallied +1.06% to 7,747.71, now just -0.66% below the 8/13 high of 7,798.99. Momentum repaired a full 10 points and is the main driver of the composite’s recovery. But it still sits in Fear territory (<45) — whether the broad participation has truly returned needs volume confirmation on follow-through
Stock Price Strength: 15.8 — Extreme Fear ⚠️ Fresh cycle low
- Raw: -0.633 (% of stocks near 52-week highs, 9/3), prior -0.533 (9/2)
- Direction: Still collapsing (-0.533 → -0.633, -0.100); score 17.0 → 15.8, worsening for a 4th straight session
- Read: The share of stocks breaking below their 52-week highs relative to those near highs widened further — the worst reading of this selloff. This is the heaviest drag: the index is being propped up by mega-caps while individual-stock momentum breaks down broadly. The bounce’s quality is questionable until strength stabilizes
Stock Price Breadth: 47.8 — Neutral
- Raw: 962.74 (new highs minus new lows, 9/3), prior 960.52 (9/2)
- Direction: Slightly up (+2.2; 46.4 → 47.8), first stabilization after 5 straight declines
- Read: New-high counts ticked up to 962.74 and breadth stopped its slide, +1.4 points. The gap vs strength (15.8, extreme fear) remains stark: more stocks still make new highs than new lows, yet the share near 52-week highs is deeply negative (-0.633). Breadth stabilizing is a leading signal for strength, but one session is not confirmation
Put/Call Options: 43.8 — Fear
- Raw: 0.7432 (P/C ratio, 9/3), prior 0.7347 (9/2)
- Direction: Slightly up (0.7347 → 0.7432, +0.009; 46.6 → 43.8), back into Fear
- Read: P/C rose into the 9/3 bounce instead of falling — put protection kept flowing in (0.7432, upper range since late July). The index rally has not dissipated hedging demand; options traders are adding protection into strength, a concern for the bounce’s durability
Market Volatility (VIX): 50 — Neutral
- Raw: 14.32 (9/3), prior 15.20 (9/2)
- Direction: Down (-0.88), breaking below the early-August low band’s lower edge (14.4)
- Read: VIX fell to 14.32, the lowest since early August, as volatility cools across the board. The absolute level is extremely low — tail-risk pricing remains thin, and VIX’s muted reaction to a +1.06% index day (-5.8%) leaves ample room to spike if the selloff resumes
Junk Bond Demand: 12.2 — Extreme Fear ⚠️ Stabilizing at highs
- Raw: 1.3470 (HY/IG spread ratio, 9/3), prior 1.3478 (9/2)
- Direction: Roughly flat (-0.0008); post-revision score 11.4 → 12.2 (+0.8), spread ratio stabilizing after its sharp widening
- Read: The junk spread ratio held at 1.3478-ish (1.3470), the first stabilization after the 9/2 +0.134 jump. The post-revision CNN reading ticked up to 12.2 but remains extreme fear (<20). Credit deterioration paused — directionally consistent with FRED HY OAS ticking up just +1.0bp (2.65% → 2.66%). The caliber gap between CNN’s revised reading and FRED’s healthy absolute spread (2.66%) persists and needs tracking
Safe Haven Demand: 34.6 — Fear ⚠️ 3rd straight session stronger
- Raw: 0.9854 (stocks vs bonds 20-day excess return, 9/3), prior 0.4006 (9/2)
- Direction: Jumped (0.4006 → 0.9854, +0.585; 28.6 → 34.6), 3rd straight session up, breaking above the 0.5 watch line
- Read: The 20-day stock/bond excess return surged to 0.9854, approaching 1.0 — money clearly rotated back into equities on 9/3, strengthening the case for a phase-one risk-off easing. This is the composite’s second-largest lift. Caveat: the 20-day rolling window still includes mid-August’s equity strength as a lagged contribution; the jump needs follow-through rather than a one-day pulse
Structural Contradiction Analysis
Core structure: full risk-off unchanged, but marginal repair signals strengthen (momentum +10, safe haven +0.585 double lift)
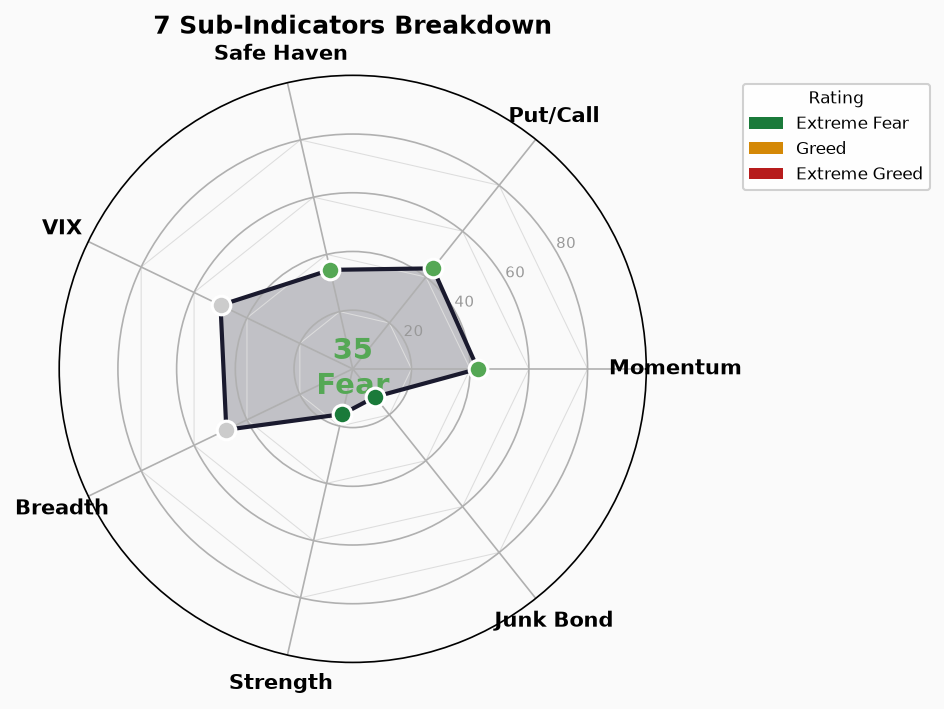
Post-revision sub-indicator mix: 2 extreme fear (junk 12.2, strength 15.8), 3 fear (safe haven 34.6, momentum 42.6, P/C 43.8), 2 neutral (breadth 47.8, VIX 50). No sub-index in greed territory — the “zero greed” structure holds for a 2nd session:
- Repair vs deterioration tug-of-war: The two marginal repairs on 9/3 (momentum 32.6 → 42.6, safe haven 28.6 → 34.6) lifted the composite 2.0 points, offset by strength’s fresh cycle low (15.8) and P/C slipping back into Fear (43.8). The composite’s recovery is driven by “mega-cap rally + capital rotation” — not by “individual-stock momentum repair.” Strength (-0.633) remains the weakest sub-index; the 26.8-point gap between momentum (42.6) and strength (15.8) is the widest structural fissure
- Junk stabilizing vs strength still sliding: The junk spread ratio held at 1.3470 (CNN 12.2) while stock strength kept deteriorating (-0.633) — credit paused its deterioration while the stock side still probes lower. Versus 9/2’s “twin-extreme synchronized deterioration,” today credit stabilized first; if the stock side follows, a double-bottom confirms; if credit re-widens, the bounce fails
- FRED caliber gap persists: CNN junk at 12.2 (extreme fear) vs FRED HY OAS 2.66% (🟢 normal) — CNN’s revised sub-index is far more sensitive to spread-ratio moves while absolute credit spreads remain healthy. A FRED HY OAS break above 3.0% would fundamentally confirm CNN’s extreme reading; otherwise it reads as an over-sensitive revision artifact
Secondary contradictions:
- Strength 15.8 (extreme fear) vs breadth 47.8 (neutral) → new-high counts remain positive (962.74), but the share near 52-week highs is deeply negative (-0.633): the +1.06% index rally is not spreading to individual stocks
- Safe haven 34.6 (rising) vs P/C 43.8 (back to fear) → capital is rotating into equities (excess return 0.9854, near 1.0) while hedging rises in tandem (0.7432): institutions are “buying while buying protection” — the bounce lacks full confirmation
- VIX 50 (neutral, 14.32) vs strength 15.8 (extreme fear) → ultra-low volatility coexisting with collapsing individual-stock momentum: downside is still underpriced; if the selloff resumes, VIX has room to catch up
Trend Assessment
- Zone: Mid-Fear (25-45), 9/3 close 35.26; two straight sessions of recovery from the 9/1 low of 30.91 (+4.4 points), 5-10 points above the June bottom band (24.66-29.97) and the extreme-fear line (25)
- Direction: 8/13 peak 66.63 → 53-57 band oscillation for 7 sessions → 8/31 breakdown (47.51) → 9/1 crash (30.91, -16.6) → 9/2-9/3 two-day repair (35.26). Direction shifted from “sharp decline” to “low-level bottoming.” The recovery is powered by momentum repair (S&P 500 +1.06%) and the safe-haven jump (0.9854), but strength’s fresh low means individual-stock momentum is unconfirmed
- Key watch points (next update after 9/4 US close):
- Resistance 40-45 above (the 8/31-9/1 gap lower edge): a break above 40 confirms a double-bottom; failure points to a retest of 30.91 or 29.97
- Whether stock price strength (-0.633) stops falling: 4 straight sessions of deterioration make this the first test of bounce quality; a recovery above -0.4 would signal breadth repair
- Whether safe haven (0.9854) holds: breaking above 1.0 with follow-through confirms risk-off easing; a fast reversal marks 9/3 as a one-day pulse
- Whether the junk spread ratio (1.3470) stays stable: the most truthful high-frequency credit signal; re-widening would abort the bounce
- Historical comparison: The current pattern mirrors the June bottom band (6/10 27.29, 6/26 24.66, 6/30 29.97) — after which FNG bottomed and rebounded to 46.83 by mid-July. The 9/1-9/3 “crash + two-day repair” rhythm resembles late-June bottoming, but the internals differ: strength (-0.633) is far weaker than late June, while momentum repair (42.6) is stronger — a more violent tug-of-war that will take longer to confirm a bottom. Stay defensive, do not chase the bounce; wait for the dual confirmation of strength stabilizing + credit spreads holding, or for a mean-reversion signal after extreme fear (<25) triggers
🚨 Crisis Precursor Dashboard
1. Credit Spreads
- HY OAS: 2.66% | 🟢 Normal (<3% normal | 3-5% caution | 5-8% panic | >8% crisis)
- IG OAS: 0.81% | 🟢 Normal
- Trend: Slightly up (FRED 9/2 data, HY 2.65%→2.66% +1.0bp, IG 0.81% flat), still at absolute lows
- Note: Caliber gap vs FNG junk bond demand (12.2, extreme fear) persists — CNN’s revised sub-index is more sensitive to spread-ratio moves (ratio stabilized at 1.3470 on 9/3 after 9/2’s widening), while FRED’s absolute spread only ticked up. A HY OAS break above 3.0% would fundamentally confirm CNN’s extreme reading
2. Yield Curve
- 10Y-2Y Spread: +43bp | 🟢 Normal-ish flat (not inverted)
- 10Y: 4.79% | 2Y: 4.39% | 30Y: 5.27%
- 10Y-30Y: -48bp (30Y above 10Y, normal upward long-end slope)
- Trend: 10Y-2Y widened from +40bp to +43bp (+3bp); yields steady at highs (10Y 4.79%/2Y 4.39%/30Y 5.27%, flat vs prior). Curve shape stable, no inversion pressure
3. Margin Debt (FINRA)
- Latest: $1.417T (July 2026, FINRA official, published 2026-08-20; August data expected late September)
- MoM: -$85B (-5.7% from the June record of $1.502T)
- YoY: +38.6% (vs July 2025’s $1.022T)
- Status: 🔴 High but falling (the -$85B July drop was the largest single-month decline in FINRA history, confirming deleveraging has started)
- Read: The leverage amplifier is cooling but the absolute level remains historically elevated ($1.417T still above May’s $1.416T prior high). The combination of high margin debt + record passive inflows remains the main systemic fragility — August data extending lower confirms the deleveraging cycle; stabilization would mark July as a one-off flush
4. IPO Market
- 2026 Stats: 105 IPOs (Renaissance Capital standard caliber, ≥$50mm market cap, as of 9/1), proceeds $145.8B (+542.2% YoY), approaching the 2021 full-year record of $175B, driven mainly by mega-deals including SpaceX ($86.2B, largest ever, ~59% of YTD proceeds)
- Count: -26.1% YoY (2025 same period: 142 standard caliber); August was the seasonal pause (10 deals, $1.8B, slightly above the 10-year average); the post-Labor-Day calendar should pick up (Anthropic expected to file after Labor Day, Aggreko targeting ~$1.5B)
- Context: 2026 is a “shrinking count, exploding proceeds” mega-deal market — SpaceX alone is ~59% of YTD proceeds, highly concentrated (note: StockAnalysis all-in caliber shows 238 deals/+3.5% YoY; Renaissance standard caliber is the proceeds reference)
- Status: 🟡 Proceeds near record but count shrinking YoY, mega-deal dependent, limited breadth
5. ETF Fund Flows
- 2026 YTD ETF Net Inflows: US-listed >$1.4T (through August, State Street; August +$180B, ~3.8x the historical August average)
- Comparison: Far above the 2025 full-year record of $1.52T — State Street projects the record falls around 9/22, with full-year flows potentially reaching $2.3T; fixed-income ETFs added +$55B in August (4th straight month >$50B), YTD $407B approaching 2025’s full-year record of $448B
- Status: 🔴 Record capital inflows
- Read: Passive inflows at records on top of elevated margin debt keep systemic risk building; equity ETFs were still the flow leader in August (69.2%) — a reversal would risk a stampede
Composite Assessment
- 🟢 Normal: 3 (HY OAS, IG OAS, yield curve)
- 🟡 Caution: 1 (IPO market)
- 🔴 Risk: 2 (margin debt, ETF flows)
Summary: Friday morning snapshot — CNN updated to the 9/3 (Thursday) US close. The FNG composite at 35.26 (Fear) rose for a 2nd straight session (+2.0 points; +4.4 points/+14.2% since the 9/1 low), driven by major momentum repair (S&P 500 +1.06% to 7,747.71; score 32.6 → 42.6) and a safe-haven jump (0.4006 → 0.9854, 3rd straight session, above the 0.5 watch line); but stock strength hit a fresh cycle low (-0.633, score 15.8, 4th straight deterioration), P/C slipped back into Fear (0.7432, hedging added into the rally), and the junk spread ratio stabilized at highs (1.3470, CNN 12.2) — the full risk-off structure holds for a 2nd session, and the bounce is a mega-cap-driven low-level repair without individual-stock confirmation. Crisis precursors show no new deterioration (FRED 9/2): HY OAS 2.66%, IG 0.81%, 10Y-2Y +43bp all normal (3🟢); IPO proceeds $145.8B near record but count shrinking (🟡); margin debt $1.417T at a record largest monthly drop, ETF flows YTD >$1.4T at record (2🔴). Strategy: sentiment is mid-Fear, bottoming; support band 29.97-30.91 and the 25 extreme-fear line below, resistance 40-45 above. Next update first checks whether strength (-0.633) stops falling (the first test of bounce quality) and whether safe haven (0.9854) holds (risk-off easing confirmation), plus whether the junk spread ratio (1.3470) stays stable. Stay defensive, do not chase; wait for the dual confirmation of strength stabilizing + credit holding, or a mean-reversion signal after extreme fear (<25) triggers.