CNN Fear & Greed Sentiment Analysis 2026-09-03
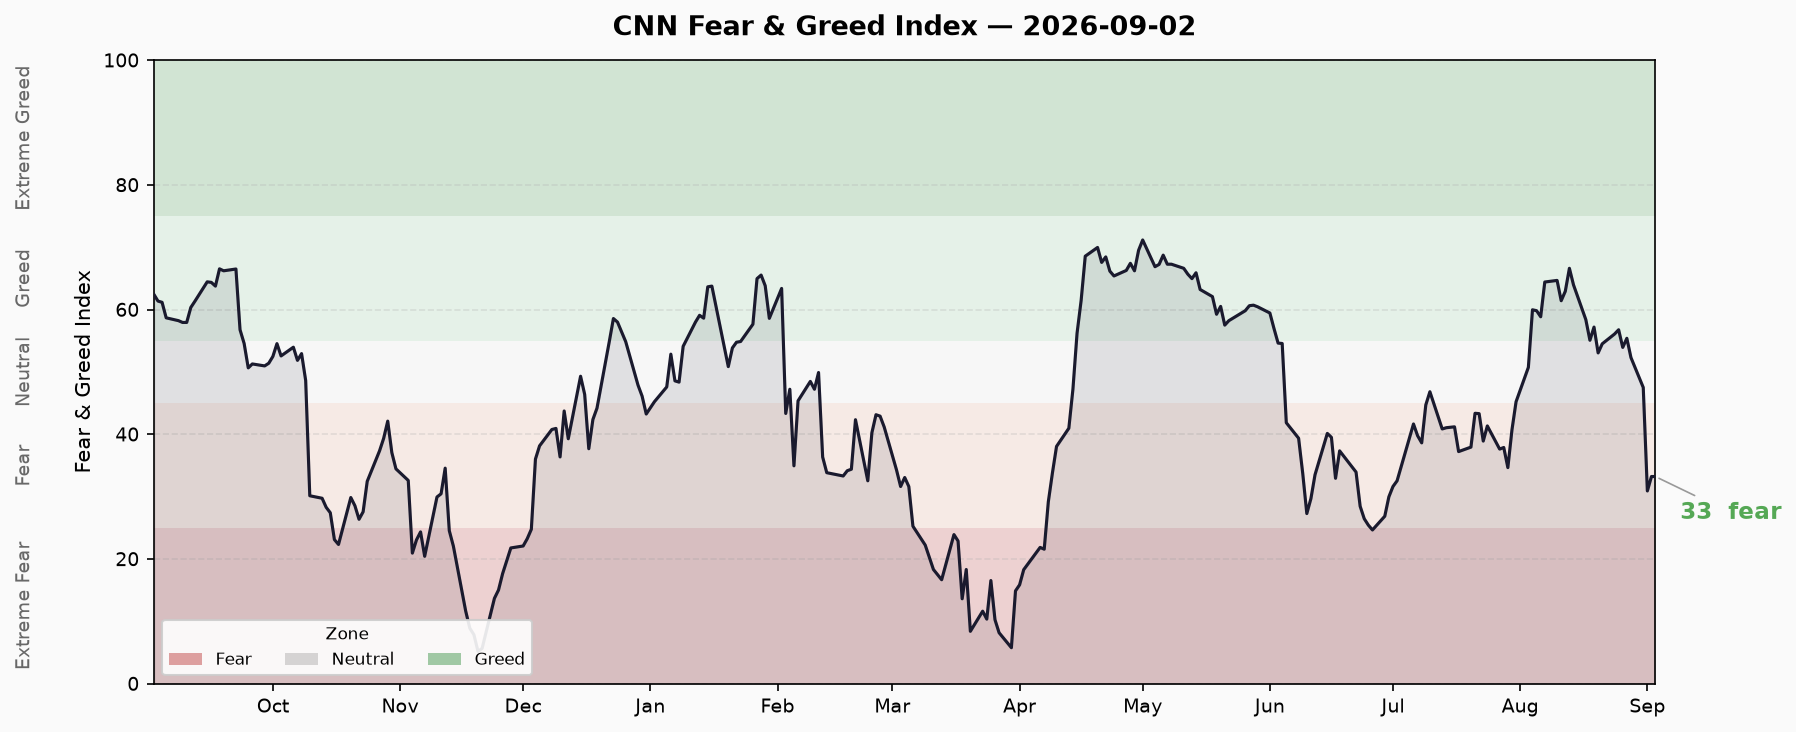
Thursday morning snapshot (9/3): CNN FNG updated to 9/2 (Wednesday) US close at 33.23 (Fear), up 2.3 points from the revised 9/1 close of 30.91. ⚠️ Major data event: CNN revised the junk bond demand sub-index algorithm (scoring direction flipped) after the 9/2 close, and the 9/1 composite index was retroactively revised from 44.57 (as reported yesterday) to 30.91 (-13.7 points); the 8/31-9/1 single-day drop was revised from -2.9 points to -16.6 points — sentiment is actually weaker than yesterday's report suggested: the revised 9/1 reading of 30.91 broke below the 7/29 low of 34.66, the lowest since 4/8/2026 (29.17), one step from the June bottom band (24.66-29.97). Post-revision, junk bond demand at 11.4 (extreme fear) now matches stock price strength at 17.0 (extreme fear); yesterday's core divergence ("credit greed vs equity fear", 88.8 vs 21.2) disappeared with the algorithm fix, and no sub-index is in greed territory — a full risk-off structure. On 9/2 the junk bond spread ratio widened sharply from 1.2140 to 1.3478 (+0.134) — the credit deterioration is real and directionally consistent with FRED HY OAS rising (2.63%→2.65%), though the absolute level remains normal (<3%). Crisis precursors (FRED 9/1): HY OAS 2.65% normal, IG OAS 0.81% normal, 10Y-2Y +40bp normal-ish flat; margin debt July $1.417T -5.7% MoM (🔴 largest monthly drop on record), IPO 2026 proceeds $145.8B / 105 deals (Renaissance caliber) +542% (🟡), ETF flows YTD >$1.4T record (🔴). Total 3🟢/1🟡/2🔴.
Composite Index Overview
- Latest Score: 33.23 — Fear
- Data As Of: 9/2 (Wednesday) US close
- Previous Close: 30.91 — Fear (9/1, retroactively revised after CNN’s algorithm update; yesterday’s 44.57 reading is obsolete)
- Daily Change: +2.3 points (vs revised 9/1 reading of 30.91)
- Weekly Change: -20.7 points (vs 8/26’s 53.94)
- Monthly Change: -12.0 points (vs 8/3’s 45.23)
- Yearly Change: -29.2 points (vs 2025/9/2’s 62.46)
⚠️ Major Data Revision: CNN revised the junk bond demand sub-index algorithm after the 9/2 close (scoring direction flipped: higher spread ratio now maps to “extreme fear” instead of “extreme greed”), retroactively revising the 9/1 composite from 44.57 (yesterday’s report) to 30.91. Yesterday’s narrative of “9/1 closing at 44.57, breaking below 45 into Fear territory” must be corrected: the revised 9/1 reading was 30.91, a single-day collapse of -16.6 points (8/31’s 47.51 → 9/1’s 30.91). From the 8/13 peak of 66.63, the index has now fallen 35.7 points (-53.6%) in 13 sessions. Sentiment sits one notch deeper than yesterday’s report suggested — from “upper Fear zone” to “mid Fear zone”, approaching Extreme Fear (<25) and the June bottom band (24.66-29.97). The 9/2 reading of 33.23 (+2.3) marks the first marginal stabilization post-revision.
Last 10 Trading Days
| Date | Score | Rating |
|---|---|---|
| 8/20 | 53.06 | Neutral |
| 8/21 | 54.51 | Neutral |
| 8/24 | 56.09 | Greed |
| 8/25 | 56.77 | Greed |
| 8/26 | 53.94 | Neutral |
| 8/27 | 55.40 | Greed |
| 8/28 | 52.31 | Neutral |
| 8/31 | 47.51 | Neutral |
| 9/1 | 30.91 | Fear |
| 9/2 | 33.23 | Fear |
(Note: 9/1 is the post-revision value; pre-revision it was 44.57.)
Trend: After peaking at 66.63 on 8/13, the index oscillated in a 53-57 band for 7 sessions (8/20-8/28), broke below the 53 double bottom on 8/31 to 47.51, then collapsed -16.6 points on 9/1 to 30.91 (lowest since 4/8/2026), before a marginal +2.3 rebound on 9/2 to 33.23. Over the last 10 sessions the index has fallen 19.8 points (-37%) from 53.06, in a “slow bleed then sharp crash” pattern. Support below: 30.91-29.97 (9/1 low and June bottom band upper edge) and the 25 extreme-fear line; resistance above: 40-45 (the 8/31-9/1 gap zone). Sentiment phase: mid-Fear, approaching Extreme Fear.
Sub-Indicator Scan
Market Momentum: 32.6 — Fear
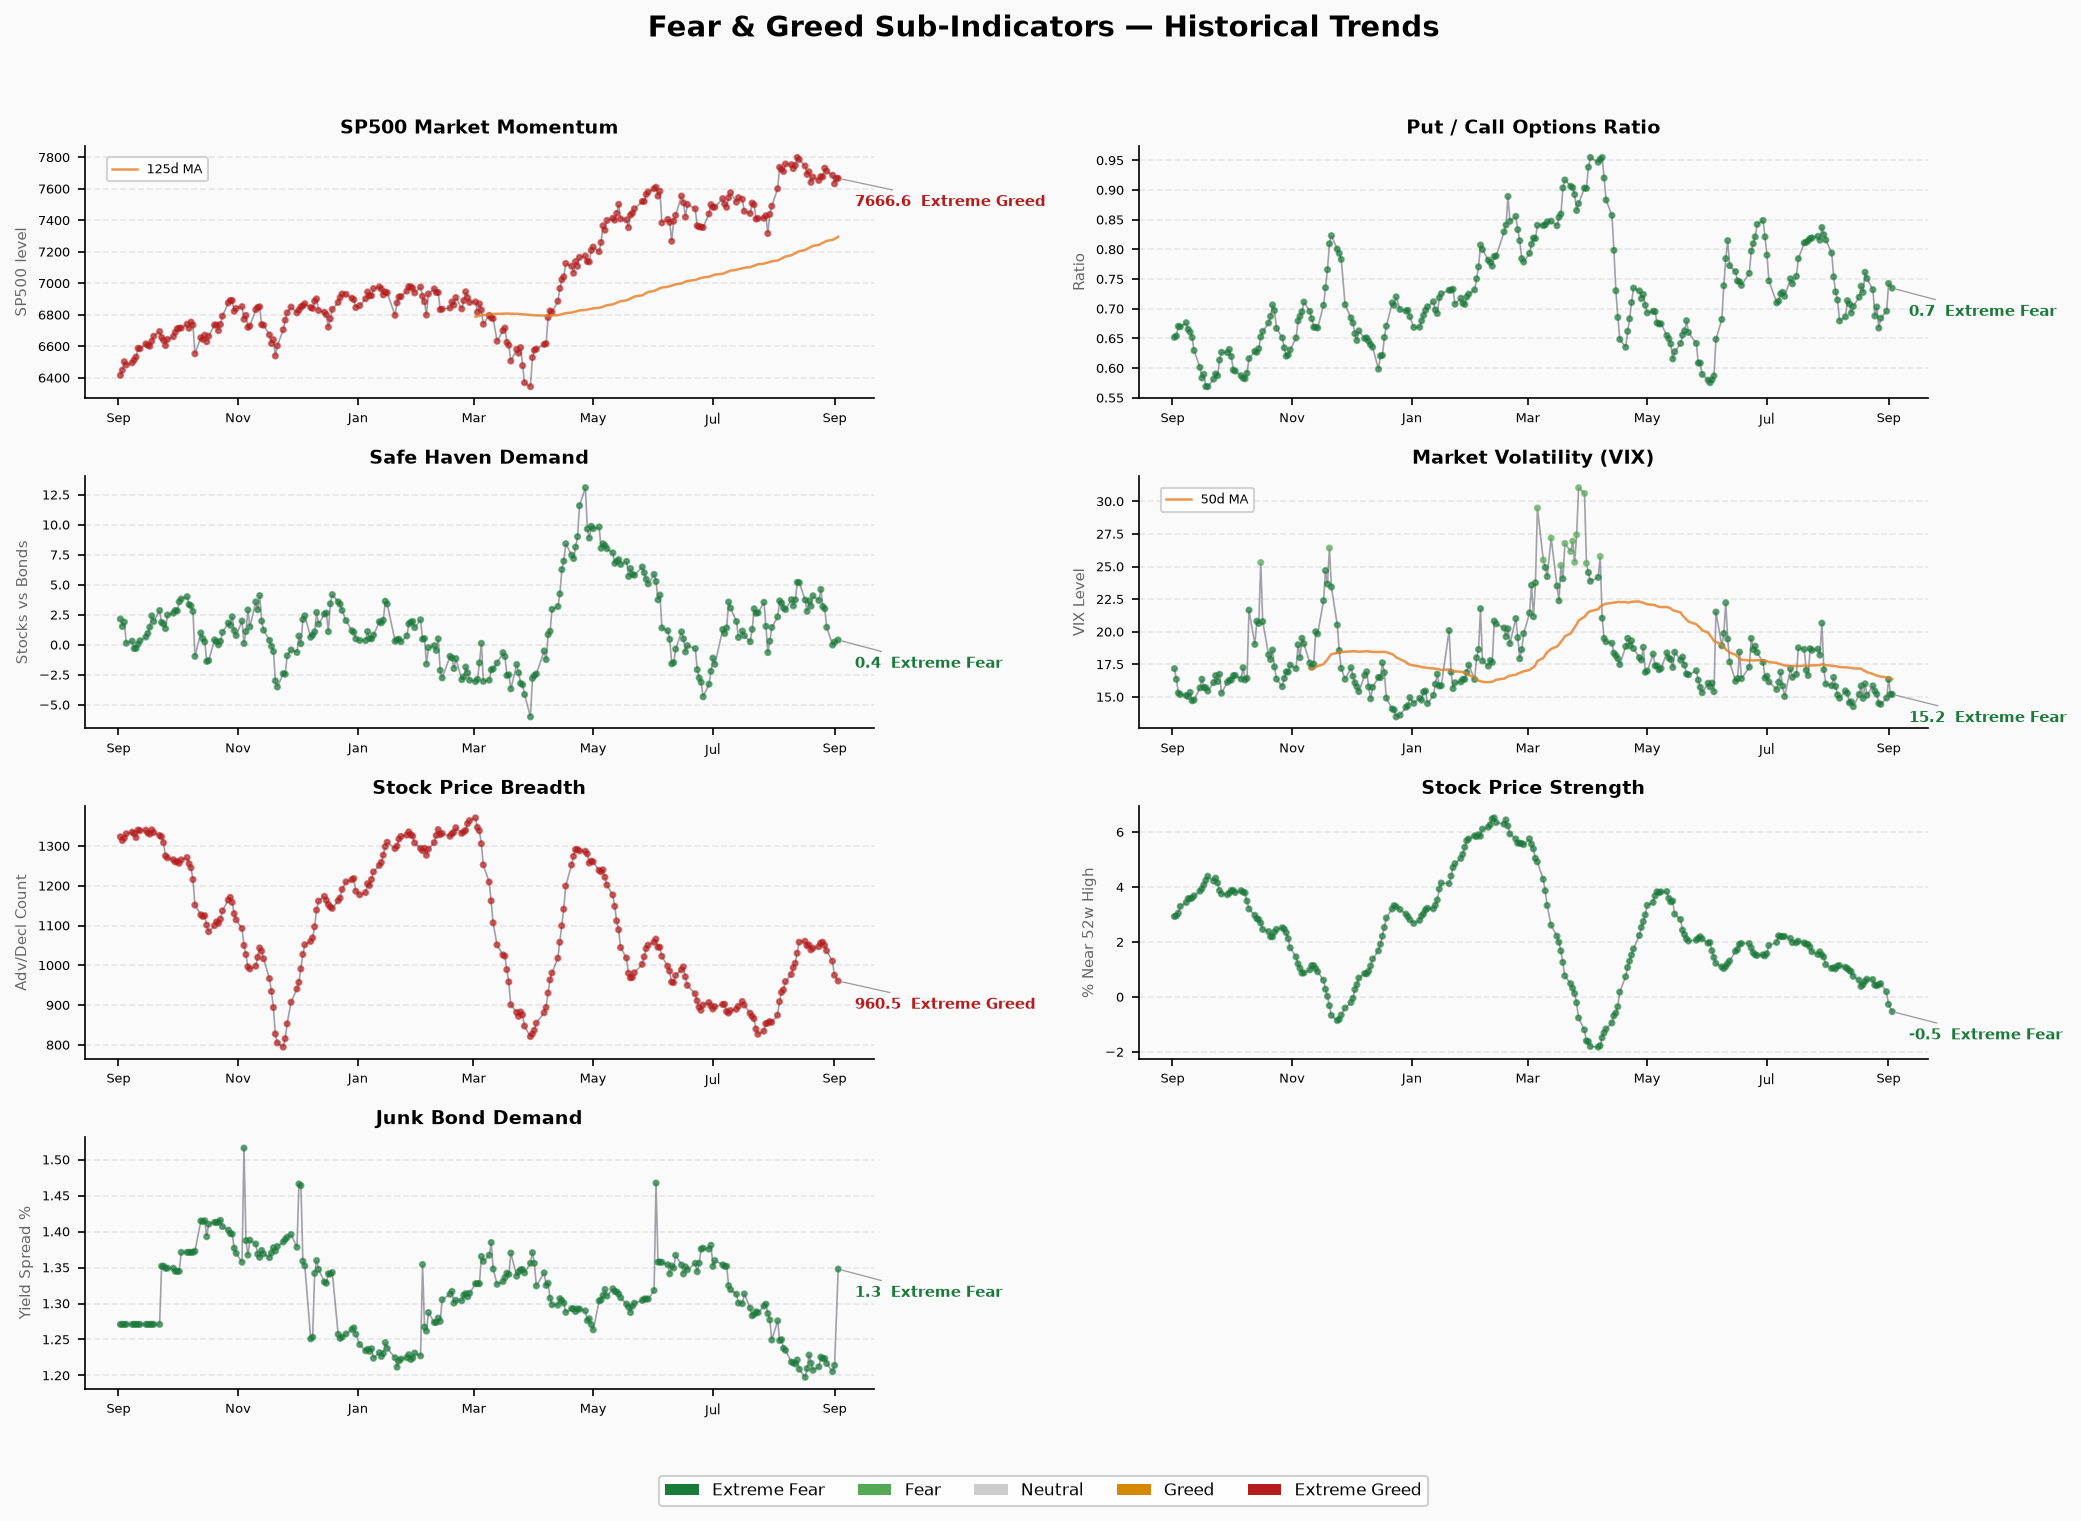
- Raw: S&P 500 @ 7,666.60 (9/2), prior 7,631.47 (9/1), +35.13 (+0.46%)
- Direction: Slightly up (30.8 → 32.6, +1.8); S&P 500 rebounded mildly but remains -1.7% below the 8/13 high of 7,798.99
- Read: The index’s +0.46% bounce on 9/2 nudged momentum up, but it stays in Fear territory for the 12th consecutive session (including pre-revision values). The 8/4-8/13 rebound’s momentum has fully unwound; the market remains supported by heavyweight names with broad participation dead
Stock Price Strength: 17.0 — Extreme Fear ⚠️ Fresh cycle low
- Raw: -0.533 (% of stocks near 52-week highs, 9/2), prior -0.268 (9/1)
- Direction: Still collapsing (-0.268 → -0.533, -0.265); score 21.2 → 17.0
- Read: The share of stocks breaking below their 52-week highs relative to those near highs widened further. Strength turned negative for a second straight session and is accelerating lower, well past the July bottom (~-0.27). This is the weakest internal indicator: individual-stock momentum is broadly breaking down beneath an index propped up by mega-caps
Stock Price Breadth: 46.4 — Neutral
- Raw: 960.52 (new highs minus new lows, 9/2), prior 975.10 (9/1)
- Direction: Declining for the 5th straight session (-14.6; 49.2 → 46.4)
- Read: New-high counts continue to fall but remain positive (960>0). Breadth is sliding toward the lower edge of Neutral (45). The gap vs strength (17.0, extreme fear) persists: more stocks still make new highs than new lows, yet the share near 52-week highs is deeply negative (-0.533) — the “index resilient, stocks broadly falling” structure keeps hardening
Put/Call Options: 46.6 — Neutral
- Raw: 0.7347 (P/C ratio, 9/2), prior 0.7427 (9/1)
- Direction: Slight pullback after 4 straight up days (0.7427 → 0.7347, -0.008; 44.0 → 46.6)
- Read: P/C eased from 0.7427 as some put protection was trimmed during the 9/2 bounce, but the level remains elevated (upper range since late July) — hedging demand has not exited. The revised reading of 46.6 is back in Neutral, showing options traders did not follow stock-level strength into extreme panic: hedges are in place, but marginal additions are slowing
Market Volatility (VIX): 50 — Neutral
- Raw: 15.20 (9/2), prior 16.34 (9/1)
- Direction: Lower (-1.14)
- Read: VIX cooled from 16.34 to 15.20 (-7.0%) as the index bounced, though it remains above the early-August low band (14.4-14.9). Absolute volatility remains low — tail risk is not fully priced. If the decline resumes, VIX has room to spike quickly, which would drag FNG further down
Junk Bond Demand: 11.4 — Extreme Fear ⚠️ Algorithm revision + sharp spread widening
- Raw: 1.3478 (HY/IG spread ratio, 9/2), prior 1.2140 (9/1)
- Direction: Post-revision reading 11.4 (extreme fear); the raw spread ratio widened sharply on 9/2 (+0.134)
- Read: Two changes compound: ① CNN’s algorithm revision flipped the junk bond scoring direction (yesterday’s 88.8 extreme greed → extreme fear post-revision, with the full history re-estimated); ② the raw ratio jumped 1.2140 → 1.3478 (+0.134, +11%), the largest single-day widening of this decline — the credit deterioration is real and directionally matches FRED HY OAS edging up (2.63%→2.65%). Post-revision, junk bonds (11.4) and price strength (17.0) sit together in extreme fear, and yesterday’s headline “credit greed vs equity fear” divergence has vanished with the fix. Caveat: FRED HY OAS at 2.65% remains normal (<3%); the CNN reading post-revision is more sensitive than FRED’s absolute level — needs tracking to calibrate
Safe Haven Demand: 28.6 — Fear
- Raw: 0.4006 (20-day stock vs bond excess return, 9/2), prior 0.2334 (9/1)
- Direction: Up for a 2nd straight session (0.2334 → 0.4006, +0.167; 28.0 → 28.6)
- Read: Stocks’ relative 20-day excess return over bonds strengthened further to 0.4006, lifting safe-haven demand to 28.6 — the lagged reflection of mid-August equity outperformance persists. The absolute level remains in Fear (<45); risk-off is not confirmed over. The divergence between safe-haven repair (28.6, rising) and stock strength collapse (-0.533) deserves ongoing monitoring
Structural Contradiction Analysis
Core Structure: Full risk-off — no sub-indicator in greed territory
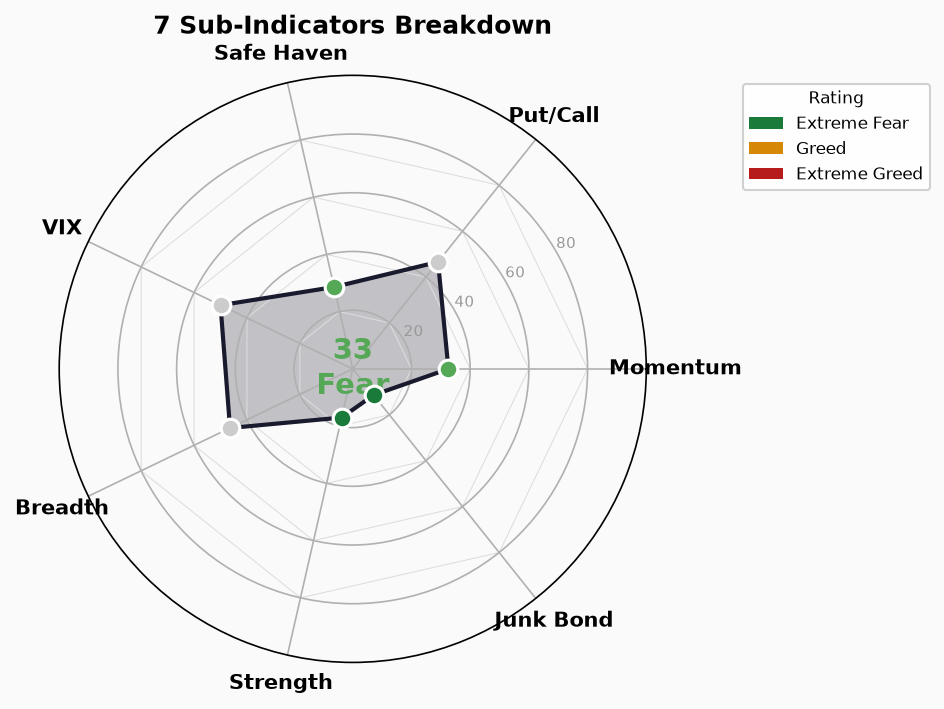
Post-revision distribution: Extreme Fear 2 (junk bonds 11.4, strength 17.0), Fear 2 (safe haven 28.6, momentum 32.6), Neutral 3 (breadth 46.4, P/C 46.6, VIX 50). Zero greed, zero extreme greed — the first “no-greed” structure since mid-August, as sentiment shifts from “credit/equity split” to “broad defense”:
- Yesterday’s core divergence is gone: The headline “junk bonds 88.8 extreme greed vs strength 21.2 extreme fear” (67.6-point gap) dissolved with CNN’s junk bond algorithm revision — post-revision junk bonds at 11.4 sit alongside strength at 17.0 in extreme fear, the gap narrowing to 5.6 points. Credit and equity sentiment are now synchronized to the downside for the first time
- Dual extremes in strength (17.0) and junk bonds (11.4): Individual-stock momentum (-0.533, share below 52-week highs widening) and credit markets (spread ratio 1.3478, sharp widening) are deteriorating in tandem — the two heaviest drags. If both keep falling, the odds of the composite breaking below 25 into Extreme Fear rise significantly
- FRED caliber gap: CNN junk bonds at 11.4 (extreme fear) vs FRED HY OAS 2.65% (🟢 normal) is a notable mismatch — the revised CNN indicator is likely more sensitive to spread-ratio changes, while actual credit spreads remain healthy in absolute terms. If FRED HY OAS breaks above the 3.0% caution line, CNN’s extreme reading gains fundamental confirmation; otherwise, flag the possibility of an over-sensitive signal from the revised CNN metric
Secondary Contradictions:
- Strength 17.0 (extreme fear) vs Breadth 46.4 (neutral) → New-high counts still positive (960), but the share near 52-week highs is deeply negative (-0.533): upside is fully concentrated in heavyweight names; true market breadth is far weaker than the headline reading
- Safe haven 28.6 (fear, rising) vs Strength 17.0 (extreme fear, collapsing) → Stocks’ relative return vs bonds is repairing (0.4006) while individual-stock momentum keeps breaking: money is not leaving the equity asset class — it is rebalancing toward mega-caps and defensive sectors
- P/C 46.6 (neutral) vs VIX 50 (neutral) → Options-market downside pricing is relatively restrained (P/C easing, VIX cooling) against the extremes in stock-level and credit indicators: participants are “defensive in words but not adding option hedges” — panic has not yet reached options-market confirmation
Trend Assessment
- Zone Position: Mid-Fear zone (25-45), 9/2 close 33.23; the revised 9/1 reading of 30.91 broke below the 7/29 low of 34.66, the lowest since 4/8/2026 (29.17)
- Direction: 8/13 peak 66.63 → 53-57 band for 7 sessions → 8/31 downside break (47.51) → 9/1 single-day collapse of -16.6 to 30.91 → 9/2 marginal +2.3 rebound to 33.23. Post-revision path: “mid-Fear, first stabilization after a sharp crash”, 3-8 points from the June bottom band (24.66-29.97) and the 25 extreme-fear line
- Key Levels to Watch (next update after 9/3 US close):
- Can 30.91-29.97 (9/1 low and June bottom-band upper edge) hold? A break targets 25 and the 6/26 low of 24.66; holding and reclaiming 35-40 would confirm a double bottom
- Does the junk bond spread ratio (1.3478) keep widening? This is the most real-time credit signal — if FRED HY OAS simultaneously breaks 3.0%, credit turning hawkish is confirmed and would amplify the equity drawdown; if the ratio reverts, the revised CNN junk bond reading may mean-revert
- Does stock strength (-0.533) stabilize? Two days of accelerating deterioration make this the first breadth-stabilization signal
- Does safe haven (0.4006) keep rising? Breaking above 0.5 would suggest risk-off is easing phase-by-phase
- Historical Comparison: The revised 9/1 low of 30.91 directly maps to the June bottom band (6/10 27.29, 6/26 24.66, 6/30 29.97) — FNG bottomed in 24.66-29.97 before rebounding to 46.83 in mid-July. At 33.23, the index is one step from that band; if the slide continues, we enter the “extreme-fear bottoming” window. But the internal structure is weaker than late June (strength -0.533 is the worst of this decline; credit spread widening just began), so a confirmed rebound needs more time. Stay defensive; wait for stabilization in the 25-30 band or a mean-reversion signal after Extreme Fear (<25) triggers
🚨 Crash Precursor Dashboard
1. Credit Spreads
- High Yield OAS: 2.65% | 🟢 Normal (<3% normal | 3-5% caution | 5-8% panic | >8% crisis)
- Investment Grade OAS: 0.81% | 🟢 Normal
- Trend: Slightly higher (9/1 FRED data: HY 2.63%→2.65% +2.0bp, IG 0.80%→0.81% +1.0bp), still at absolute lows
- Note: Mismatch vs the FNG junk bond sub-index (11.4, extreme fear) — CNN revised its indicator on 9/2 (direction flipped) and the raw spread ratio widened sharply (1.2140→1.3478, +0.134), directionally consistent with FRED HY OAS but much larger in magnitude. A FRED HY OAS break above 3.0% would fundamentally confirm CNN’s extreme reading
2. Yield Curve
- 10Y-2Y Spread: +40bp | 🟢 Normal-ish flat (not inverted)
- 10Y: 4.79% | 2Y: 4.39% | 30Y: 5.27%
- 10Y-30Y: -48bp (30Y above 10Y; long end normally upward-sloping)
- Trend: 10Y-2Y flat at +40bp; yields drifted slightly higher across the curve (prior 10Y 4.75%/2Y 4.34%/30Y 5.25% → 4.79%/4.39%/5.27%, 10Y +4bp). Curve shape stable, no inversion pressure
3. Margin Debt (FINRA)
- Latest: $1.417T (July 2026, FINRA official, released 8/20/2026; August data expected late September)
- MoM: -$85B (down 5.7% from June’s record $1.502T)
- YoY: +38.6% (vs July 2025’s $1.022T)
- Status: 🔴 High but rolling over (July’s -$85B is the largest one-month drop in FINRA records — deleveraging has started)
- Read: The record monthly decline shows the leverage amplifier cooling, but the absolute level remains historically elevated ($1.417T still above May’s prior high of $1.416T). The “high margin debt + record passive inflows” combo remains the main systemic fragility source — continued declines in August data would confirm a deleveraging cycle; stabilization would mark July as a one-off air pocket
4. IPO Market
- 2026 Stats: 105 IPOs (Renaissance Capital standard caliber, ≥$50mm market cap, as of 9/1), proceeds $145.8B (+542.2% YoY), approaching the 2021 full-year record of $175B, driven by mega-deals led by SpaceX ($86.2B, largest ever, ~59% of YTD proceeds)
- Volume: -26.1% YoY (vs 142 in the same period of 2025); August summer pause (10 deals, $1.8B, slightly above the 10-year average), biotech-dominated (Braveheart Bio raised $383M, +66% debut); post-Labor-Day calendar should pick up (Anthropic reportedly filing after Labor Day; Aggreko expected to raise ~$1.5B)
- Comparison: 2026 is a “shrinking count, exploding proceeds” mega-deal market; SpaceX alone is ~59% of YTD proceeds — highly concentrated (note: yesterday’s 237-deal/all-caliber and $160.6B/as-of-8/19 figures used different statistical bases; today’s report follows Renaissance’s 9/1 official caliber)
- Status: 🟡 Proceeds near record but deal count contracting; dependent on mega-deals, limited breadth
5. ETF Fund Flows
- 2026 YTD Net Inflows: US-listed >$1.4T (as of end-August, State Street; August +$180B, ~3.8x the historical August average, pushing YTD above $1.4T)
- Comparison: Far above 2025’s full-year record of $1.52T — State Street expects the record to fall around 9/22, with full-year possibly reaching $2.3T; fixed-income ETFs took in +$55B in August (4th straight month >$50B), YTD $407B approaching 2025’s annual record of $448B
- Status: 🔴 Record inflows
- Read: Passive money keeps flooding in atop elevated margin debt, accumulating systemic risk; equity ETFs remain the inflow mainstay (69.2% in July), and a reversal would risk a stampede
Composite Assessment
- 🟢 Normal: 3 (HY OAS, IG OAS, yield curve)
- 🟡 Caution: 1 (IPO market)
- 🔴 Risk: 2 (margin debt, ETF flows)
Summary: Thursday morning snapshot; CNN updated to 9/2 (Wednesday) US close. ⚠️ Headline event: CNN revised the junk bond indicator algorithm (scoring direction flipped), retroactively revising 9/1 from 44.57 (yesterday’s report) to 30.91 (-13.7 points) — yesterday’s “broke below 45 into Fear” narrative is corrected to “single-day -16.6 collapse to mid-Fear 30.91, lowest since April 2026”, with 9/2 edging up 2.3 points to 33.23 as a first marginal stabilization. Post-revision, no sub-indicator sits in greed territory (junk bonds 11.4 and strength 17.0 in dual extreme fear); yesterday’s “credit greed vs equity fear” divergence is gone, and a full risk-off structure is in place. The junk bond spread ratio widened +0.134 on 9/2 — credit deterioration is real, but FRED HY OAS at 2.65% remains normal (caliber gap to track). Crisis precursors show no new deterioration (FRED 9/1): HY OAS 2.65%, IG 0.81%, 10Y-2Y +40bp all normal (3🟢); IPO proceeds $145.8B near record but deal count contracting (🟡); margin debt $1.417T with record one-month drop and ETF inflows YTD >$1.4T at records (2🔴). Action: sentiment is in “mid-Fear, approaching Extreme Fear”; key support 30.91-29.97 (9/1 low + June bottom-band upper edge) and the 25 extreme-fear line, resistance 40-45 above. Next session, first watch whether the junk bond spread ratio (1.3478) keeps widening (the most real-time credit signal) and whether stock strength (-0.533) stabilizes (first breadth signal); safe haven rising (0.4006) and VIX cooling (15.20) are the only marginal relief signals. Defense first: no chasing down, no early rebound buying until the 25-30 band stabilizes or an extreme-fear mean-reversion signal triggers.