CNN Fear & Greed Analysis 2026-09-02
Wednesday morning snapshot (9/2): CNN F&G updated to 9/1 (Tuesday) US close at 44.57 (Fear), down another 5.1 pts from 8/31 close of 49.71. Second straight session below the 50 neutral line since the 8/13 peak of 66.6, lowest since 7/29 (46.32), and now formally in Fear territory (<45). Trend: after the 8/31 breakdown from the 53-57 band, 9/1 extended the decline and is testing the 45-49 support zone (late-July lows 45.23/41.2). Internals keep deteriorating but show two marginal shifts: stock price strength (0.19 to -0.27, score 21.2 extreme fear) turned negative for the first time since late July; safe haven demand (-0.02 to 0.23, score 28 fear) ticked up with the 20-day stock/bond excess return turning positive. Breadth (975.1, neutral) keeps falling, put/call (0.743) protection buying rose for a 4th straight session, VIX 16.34 up but still low. Junk bond demand (88.8 extreme greed) pulled back 5 pts from 93.8 with the raw spread ratio widening 1.205 to 1.214 — the credit/equity divergence (88.8 vs 21.2) narrowed to 67.6 pts but stays extreme. Crisis-side no new deterioration (FRED 8/31): HY OAS 2.63% normal, IG OAS 0.80% normal, 10Y-2Y +40bp normal-flat; margin debt July $1.417T -5.7% MoM (high but off record), IPO 2026 ~$160.6B +542% (near record), ETF inflows YTD $1.23T record. Net 3 green / 1 yellow / 2 red.
Composite Index Overview
- Latest Score: 44.57 — Fear
- Data As Of: 9/1 (Tuesday) US close (real-time reading)
- Prior Close: 49.71 — Neutral (8/31)
- Daily Change: -5.1 pts
- Weekly Change: -12.2 pts (vs 56.77 on 8/24)
- Monthly Change: -0.7 pts (vs 45.23 on 8/3)
- Yearly Change: -17.0 pts (vs 61.54 on 2025/9/2)
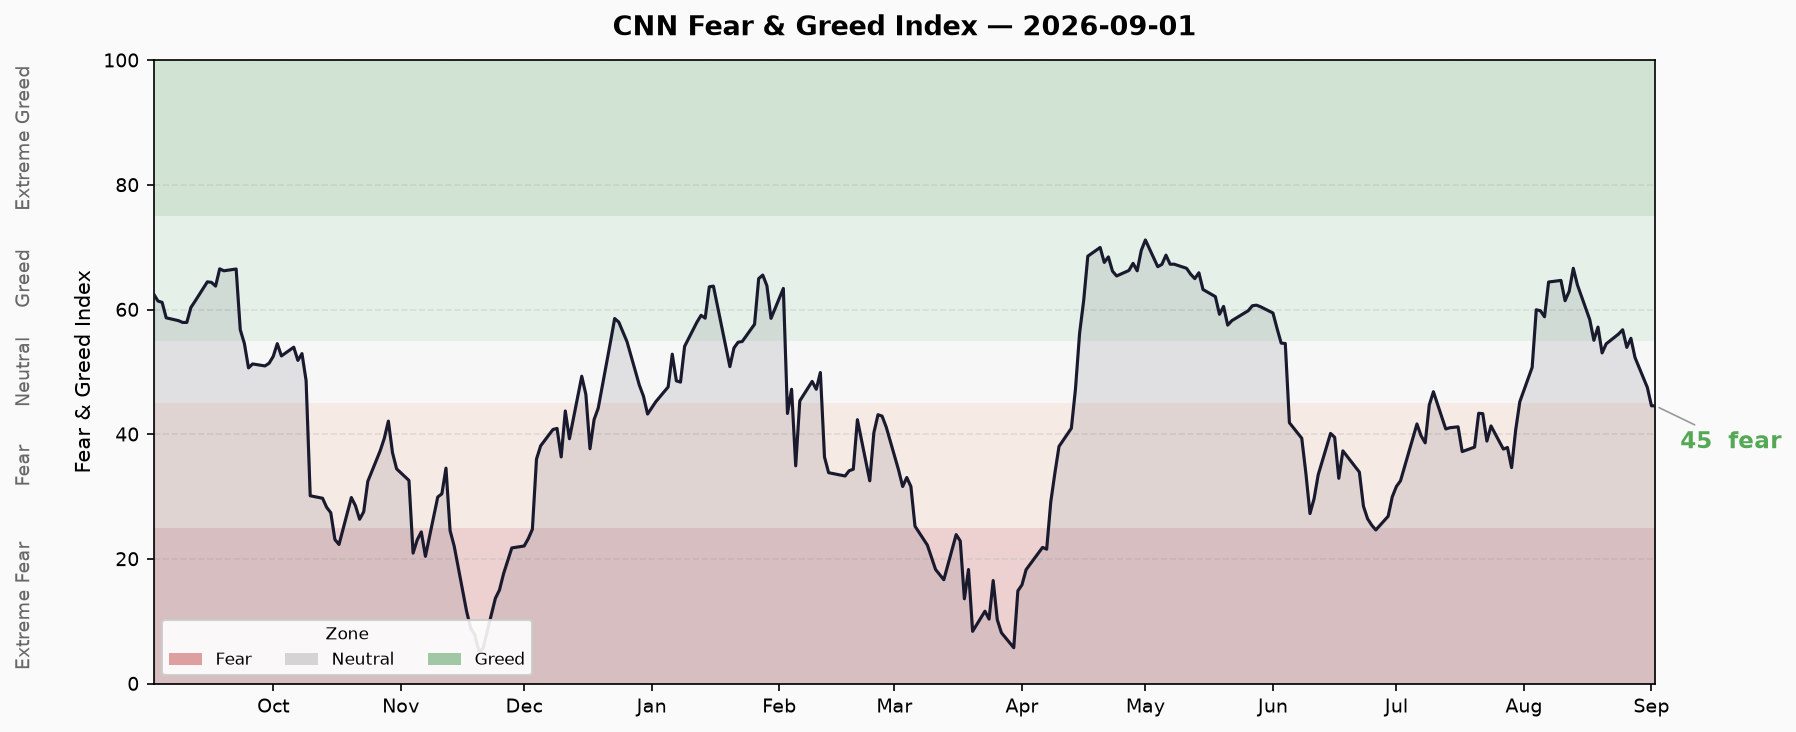
This is the Wednesday morning snapshot; CNN is updated to the 9/1 (Tuesday) US close: the composite fell another 5.1 pts from 8/31’s 49.71 to 44.57. For a second straight session since the 8/13 peak of 66.6 it closed below the 50 neutral line, and it has now formally broken below 45 into Fear territory (<45) — the lowest reading since 7/29 (46.32). Core event: after the 8/31 breakdown (53.06/53.94 double bottom lost), 9/1 extended the slide and the index is now testing the upper edge of the late-July low band (45.23/41.2). The direction has moved from “neutral-biased-fear” to a confirmed “downward in Fear territory.”
Last 10 Trading Days
| Date | Score | Rating |
|---|---|---|
| 8/18 | 55.09 | Greed |
| 8/19 | 57.20 | Greed |
| 8/20 | 53.06 | Neutral |
| 8/21 | 54.51 | Neutral |
| 8/24 | 56.09 | Greed |
| 8/25 | 56.77 | Greed |
| 8/26 | 53.94 | Neutral |
| 8/27 | 55.40 | Greed |
| 8/28 | 52.31 | Neutral |
| 8/31 | 47.51 | Neutral |
| 9/1 | 44.57 | Fear |
(Note: CNN’s historical series has back-revised the 8/31 close from 49.71 to 47.51; 9/1 is 44.57.)
Trend: after peaking at 66.6 on 8/13 and churning in the 53-57 band for 7 sessions (8/20-8/28), the index broke below 53 with the double bottom lost on 8/31, then fell to 44.57 on 9/1, now firmly below 45 in Fear territory. Over the last 10 sessions it has fallen 10.5 pts (-19%) from 55.09 with accelerating declines (8/28→8/31 -4.8, 8/31→9/1 -2.9). Watch 41.2-45 (late-July lows) and the 40 round number below; 47.5-50 (8/31 close and neutral line) now act as resistance above. Sentiment is in a “Fear-zone decline” — not yet Extreme Fear (<25), but direction is clearly down.
Seven Sub-Indicator Scan
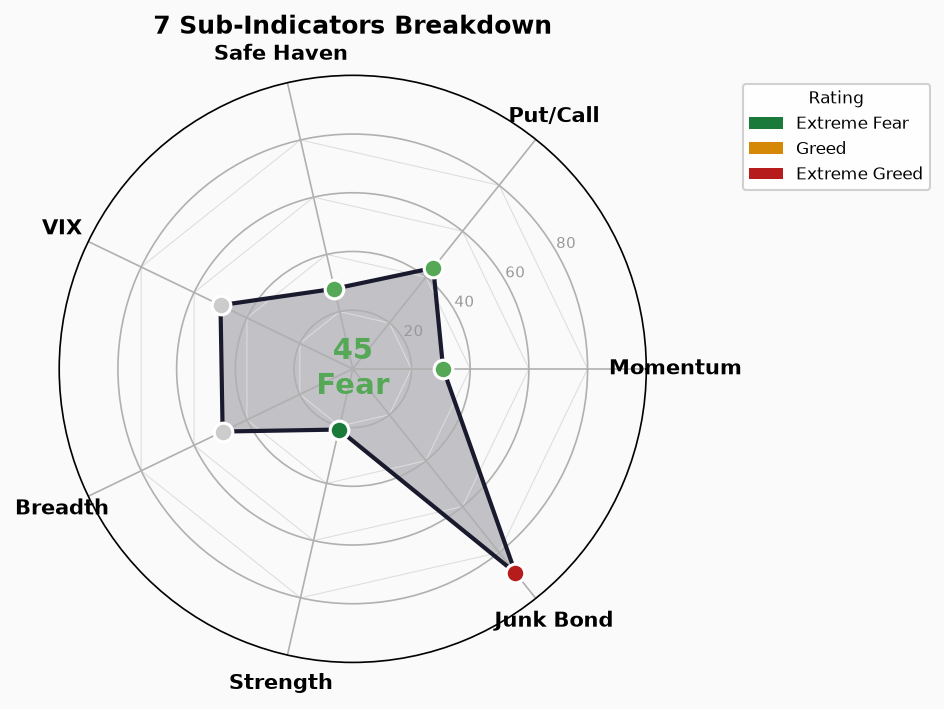
Market Momentum: 30.8 — Fear
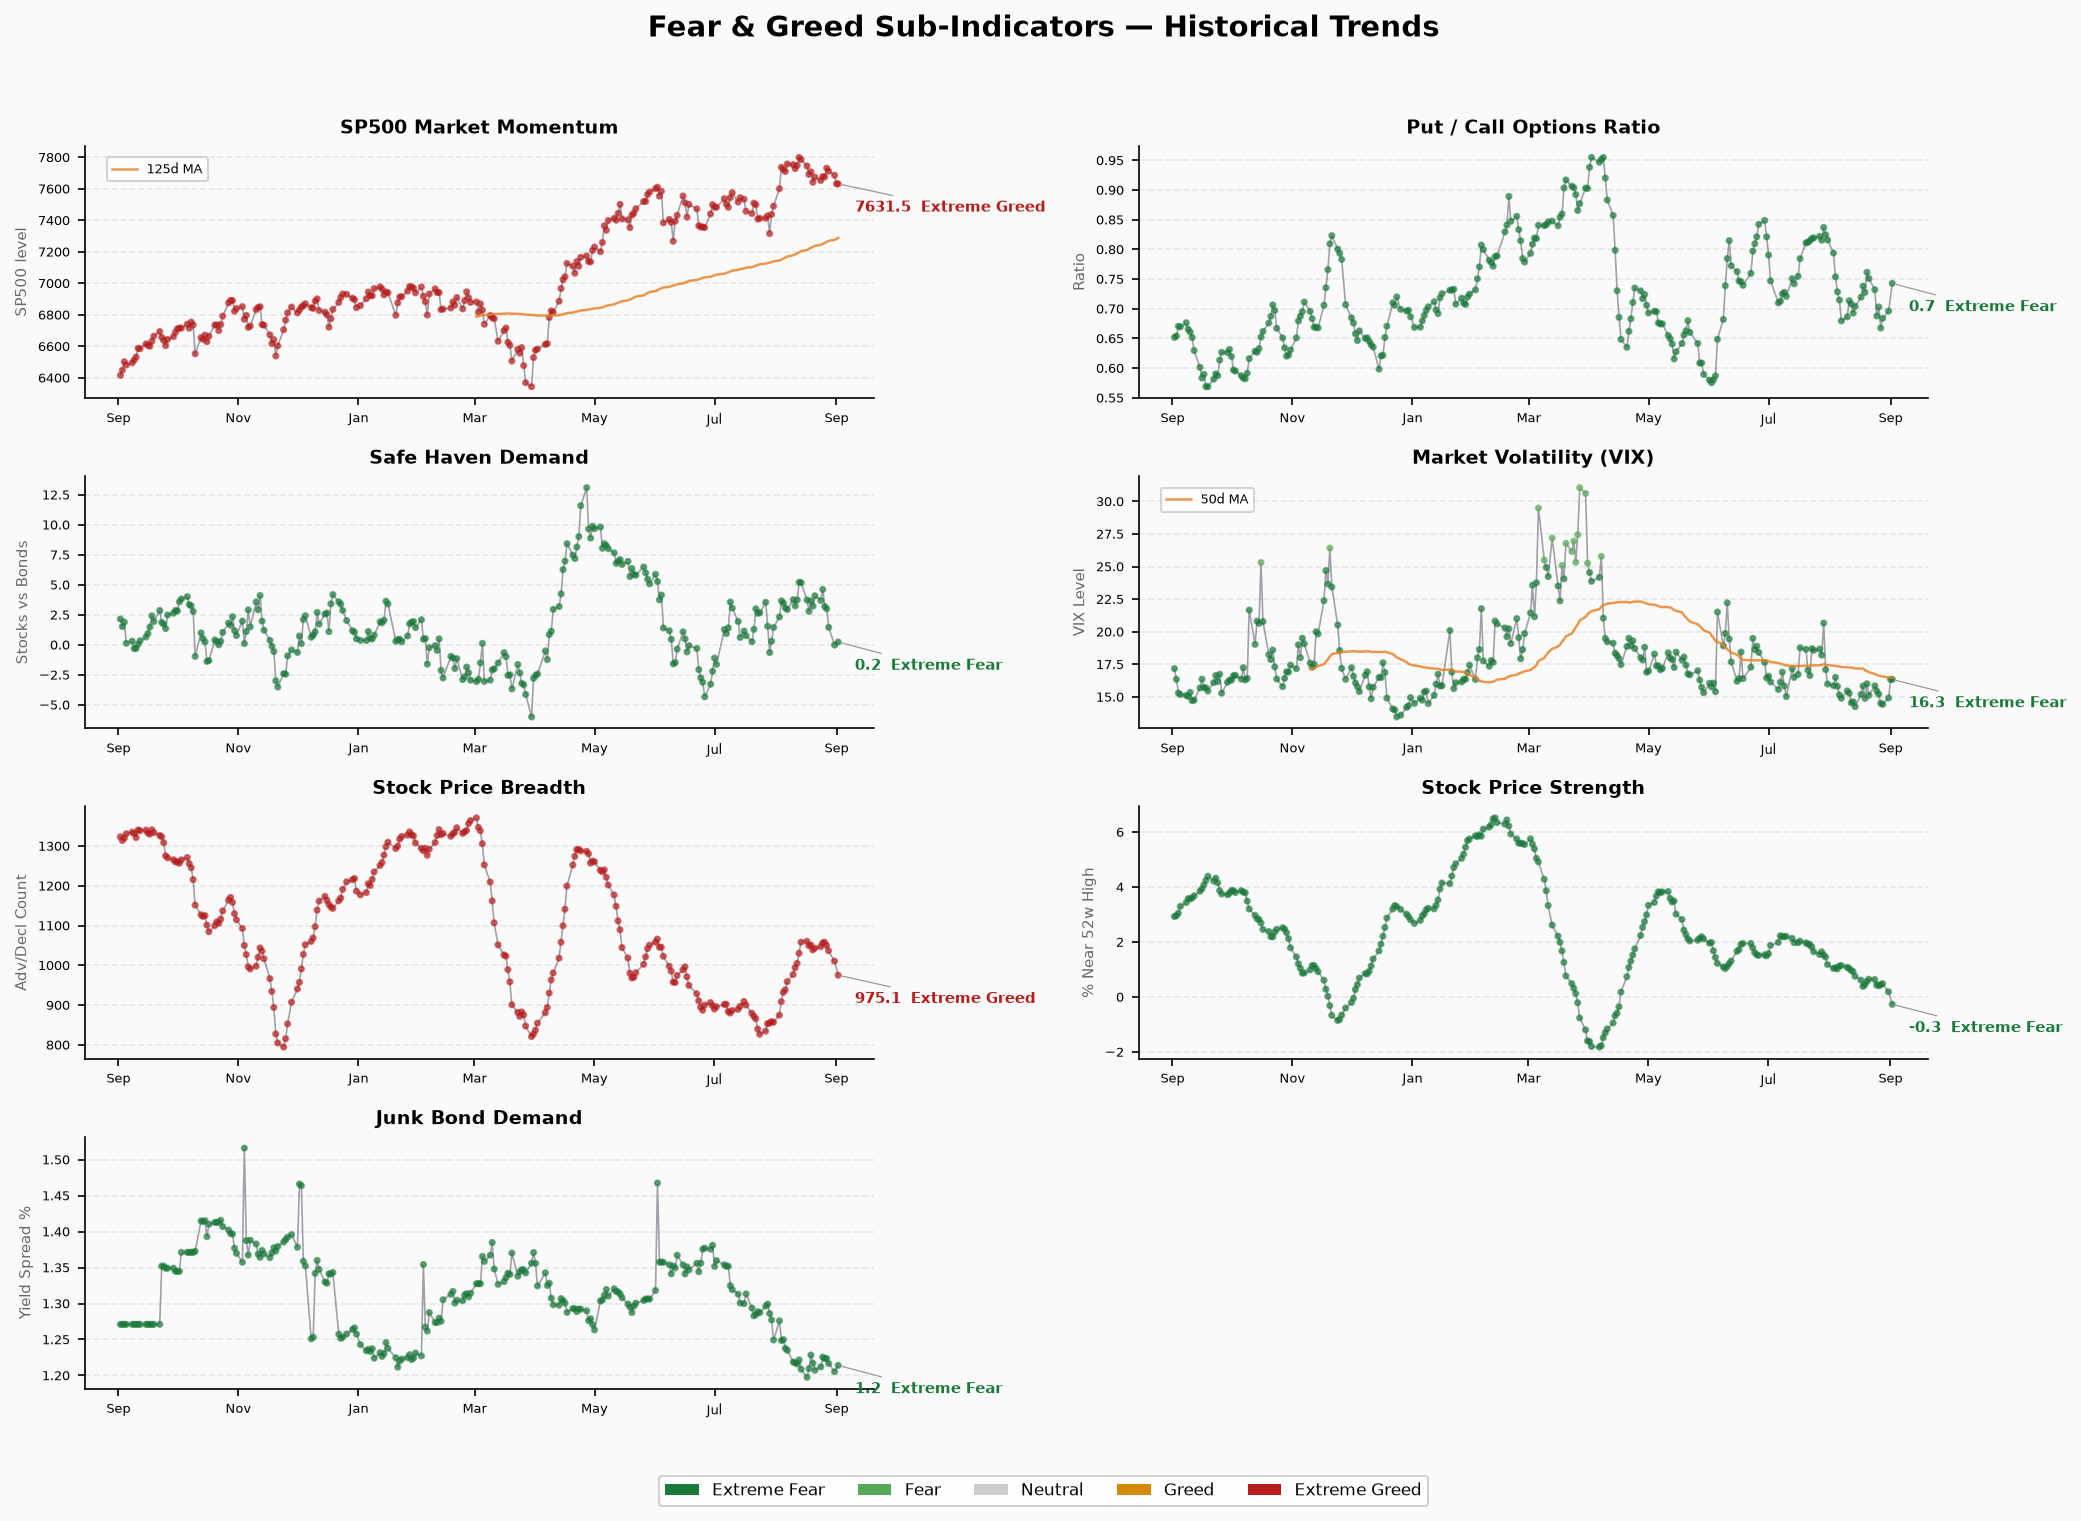
- Raw: S&P 500 @ 7,631.47 (9/1), prior 7,686.14 (8/31), -54.7 (-0.71%)
- Direction: Lower (35.4 → 30.8, -4.6), 11th straight session in Fear
- Read: S&P 500 fell to 7,631, its gap below the 8/13 high of 7,798.99 widening to -2.1%. Momentum is at its 11th straight Fear session and still grinding lower — the breadth of the 8/4-8/13 rebound has fully reversed, with the index held up by top-weight names. Momentum is a key drag behind the composite breaking below 45.
Stock Price Strength: 21.2 — Extreme Fear ⚠️ Below Zero
- Raw: -0.268 (% of stocks near 52-week highs, 9/1), prior 0.190 (8/31)
- Direction: Collapse (0.190 → -0.268, -0.458), score 25 → 21.2
- Read: The share of stocks near 52-week highs has turned negative — the first time since late July — meaning more stocks are now below their 52-week high than near it. Internal momentum is broadly breaking down. At 21.2 (Extreme Fear) this is the weakest level since late July; the real breadth is far worse than the composite (44.57) suggests.
Stock Price Breadth: 49.2 — Neutral
- Raw: 975.10 (new highs minus new lows, 9/1), prior 1,010.54 (8/31)
- Direction: Lower (-35.4; 53.8 → 49.2), back to Neutral
- Read: New-high counts keep falling but remain positive (975>0); breadth has declined for 4 straight sessions. The gap versus strength (21.2, Extreme Fear) stays wide: new highs still outnumber new lows, yet the share near 52-week highs has gone negative — a “resilient index, broad decline” structure where gains concentrate in a few top names.
Put/Call Ratio: 44.0 — Fear
- Raw: 0.743 (9/1), prior 0.696 (8/31)
- Direction: Higher (0.696 → 0.743, +0.047; 64.8 → 44.0), 4th straight session up
- Read: Put/call has risen 4 straight sessions as hedging demand strengthens. At 0.743 this is the highest since late July — the “unprotected market” backdrop is loosening as investors begin paying for downside. Another confirmation that sentiment is rotating toward defense.
Market Volatility (VIX): 50 — Neutral
- Raw: 16.34 (9/1), prior 14.92 (8/31)
- Direction: Higher (+1.42)
- Read: VIX rose from 14.92 to 16.34 (+9.5%), leaving the year’s low band — the highest close since 8/4. Volatility is starting to react to the decline, but the absolute level is still low, meaning tail risk remains underpriced. If the slide continues, VIX has room to spike higher and will pull the F&G reading lower with it.
Junk Bond Demand: 88.8 — Extreme Greed ⚠️ Pullback from Peak
- Raw: 1.2140 (HY/IG spread ratio, 9/1), prior 1.2052 (8/31)
- Direction: Lower (93.8 → 88.8, -5.0) from the extreme-greed peak, with the raw ratio widening slightly
- Read: Junk bond demand pulled back 5.0 pts from 93.8 — the first notable pullback after several days of record highs — with the raw spread ratio widening (1.2052 → 1.2140). Credit is beginning to show signs of turning. It remains the most optimistic corner of the market, but its lone-standing strength is loosening; if the decline continues it would confirm a hawkish credit turn that amplifies equity drawdowns.
Safe Haven Demand: 28.0 — Fear ⚠️ Marginal Rebound
- Raw: 0.233 (20-day stock vs bond excess return, 9/1), prior -0.019 (8/31)
- Direction: Higher (-0.019 → 0.233, +0.25; 25.4 → 28.0)
- Read: The 20-day stock/bond excess return turned positive (-0.019 → 0.233), lifting the safe-haven reading from 25.4 to 28.0 — the first marginal repair after three straight reports of deterioration. Caveat: this more likely reflects mid-August relative strength of stocks with a lag than an immediate return of equity inflows. One point alone does not confirm the end of risk-off; watch whether it persists.
Structural Contradiction Analysis
Core Contradiction: Junk Bond Demand Extreme Greed (88.8) vs Stock Price Strength Extreme Fear (21.2)
The 67.6-pt chasm narrowed slightly by 1.2 pts from 68.8 (9/1) and has now persisted for 12 straight sessions:
- Fixed Income: Spreads compressed to the extreme (HY OAS 2.63% at an absolute low); junk bond demand, though off its 93.8 peak, is still Extreme Greed (88.8) — credit investors are still chasing yield and risk appetite has not followed equities lower.
- Equities: The composite has broken below 45 into Fear, strength (21.2, Extreme Fear) has gone negative, momentum (30.8, Fear) and breadth (49.2, Neutral) have all weakened — internals are far worse than a week ago and have confirmed the Fear zone.
- Historical Lesson: Credit at extreme optimism against collapsing equity internals is a classic top-of-cycle signature. Credit optimism is a lagging signal; once it turns it amplifies equity drawdowns. At day 12 of the divergence, the junk-bond raw ratio is already widening — a credit turn is the most likely path for the divergence to narrow.
9/1 Structure Read (Fear zone confirmed + two marginal signals)
- Composite broke below 45 into Fear (44.57), dragged by momentum (30.8) and strength (21.2); the decline has upgraded from “neutral-zone decline” to “Fear-zone decline,” with the late-July low band (45.23/41.2) now in range.
- Strength went negative (0.190 → -0.268): first negative print since late July, real breadth is broadly breaking down — the “resilient index, broad decline” structure keeps deepening.
- Safe-haven (-0.02→0.23) marginal rebound alongside put/call (0.743) rising for a 4th session: two defense signals moving in opposite directions coexist — the market is “hedging while probing,” in a wait-and-see state.
- VIX (16.34) at its highest close since 8/4: volatility is starting to react but remains low in absolute terms, with room to spike if the decline continues.
Positive Signals (marginal watch)
- Safe-haven (28.0) combined with negative strength (-0.268): the stock/bond relative return has turned positive and VIX has not yet entered panic — the Extreme-Fear (<25) mean-reversion buy zone has not triggered but is getting close to the observation window.
- Junk bond demand (93.8→88.8) off its peak: extreme credit optimism is loosening; if the decline persists, the narrowing divergence reduces systemic risk, though in the near term it means credit spreads widening.
Secondary Contradictions:
- Breadth Neutral (49.2) vs Strength Extreme Fear (21.2) → new highs still positive (975) but the share near 52-week highs has gone negative (-0.268): gains concentrated in top names; true breadth is much weaker than the surface reading.
- Composite Fear (44.57) vs Junk Bond Demand Extreme Greed (88.8) → the extreme split between equity and credit sentiment is the biggest structural risk point right now.
Trend Assessment
- Zone: Upper edge of Fear (25-45), 9/1 close 44.57, below 45 and below 8/31’s 47.51, probing the upper edge of the late-July low band.
- Direction: 8/13 peak 66.6 → 53-57 band churn for 7 sessions → 8/31 breakdown (double bottom 53.06/53.94 lost) → 9/1 break below 45 into Fear. Clearly downward, lowest since 7/29 (46.32).
- Key Levels (recheck after 9/2 US close):
- Can 41.2-45 (late-July lows) hold? This is the first key support of the decline; below it watch 40 and 37.89 (7/28 low).
- Does the safe-haven rebound (0.233) persist? Above 0.5 would suggest a phase of easing risk-off; a rollover would confirm 9/1 was a one-day blip.
- Does strength (-0.268) stabilize? This is the first signal for breadth stabilizing; recovery above zero is required before any repair.
- Does junk bond demand (88.8) keep falling? A break below 80 into “greed” would confirm a hawkish credit turn amplifying drawdowns.
- Historical Comparison: A month ago (8/3’s 45.23) marked the rebound start from the late-July Fear zone (37.89-46.32); 9/1 at 44.57 means the August rebound has fully reversed and sentiment is back at the late-July zone. Internals (strength negative, momentum 30.8) are weaker than late July, while credit (junk 88.8) is still extremely optimistic — the “credit optimism + weak equities” top signature is more pronounced than in late July, and downside momentum has not fully played out. Stay defensive; wait for stabilization in the 41.2-45 band or an Extreme-Fear (<25) mean-reversion signal.
🚨 Crisis Precursor Indicator Dashboard
1. Credit Spreads
- High-Yield OAS: 2.63% | 🟢 Normal (<3% normal | 3-5% caution | 5-8% panic | >8% crisis)
- Investment-Grade OAS: 0.80% | 🟢 Normal
- Trend: Slightly wider (FRED 8/31: HY 2.60%→2.63% +3.0bp, IG 0.79%→0.80% +1.0bp), still at absolute lows
- Note: The F&G junk-bond sub-indicator (88.8, Extreme Greed) pulled back from 93.8 with the raw spread ratio widening 1.2052→1.2140 — extreme credit optimism is starting to loosen; a break above the 3.0% caution line in HY OAS would confirm a hawkish credit turn
2. Yield Curve
- 10Y-2Y Spread: +40bp | 🟢 Normal-flat (not inverted)
- 10Y: 4.75% | 2Y: 4.34% | 30Y: 5.25%
- 10Y-30Y: -50bp (30Y above 10Y, normal upward slope)
- Trend: 10Y-2Y narrowed from +41bp to +40bp (-1bp); yields held at elevated levels (prior 10Y 4.73%/2Y 4.34%/30Y 5.22% → today 4.75%/4.34%/5.25%). Curve shape stable, no inversion pressure.
3. Margin Debt (FINRA)
- Latest: $1.417T (July 2026, FINRA official, released 2026-08-20)
- MoM: -$85B (-5.7% from June’s record $1.502T, second straight monthly decline)
- YoY: +38.6% (vs July 2025’s $1.022T)
- Status: 🔴 Still in the historical-high zone
- Read: After June’s record $1.502T, July eased to $1.417T — the leverage amplifier is cooling but remains elevated. The combination of margin debt at high levels and passive inflows remains the main source of systemic fragility. August data is due late September; a continued decline would confirm a deleveraging cycle has started.
4. IPO Market
- 2026 Stats: 237 IPOs (all-size including small-cap/SPAC, StockAnalysis as of 9/1), raising ~$160.6B (as of 8/19, Renaissance Capital), approaching 2021’s full-year record of $175B, driven by mega-deals led by SpaceX ($86.2B, largest ever)
- Count: +3% YoY (2025 had 230 by this date); August saw the seasonal pause (10 IPOs, $1.8B, slightly above the 10-yr average); the calendar should pick up after Labor Day (Anthropic/DeepSeek/Nscale queued)
- Comparison: 2026 is a “moderate count, explosive value” market dominated by mega-deals; SpaceX alone is ~54% of YTD proceeds — highly concentrated
- Status: 🟡 Approaching record proceeds but no bubble in deal count; limited breadth
5. ETF Fund Flows
- 2026 YTD Net Inflows: US-listed $1.23T (through July, ETFGI); July alone +$193.4B, 51st straight month of inflows
- Comparison: Far above 2025’s full-year record of $678B; US-listed ETFs surpassed $1T in H1; State Street projects $2.3T for the full year (a new record)
- Status: 🔴 Inflows at record highs
- Read: Passive money pouring in on top of elevated margin debt keeps systemic risk building — if it reverses it can turn into a stampede
Net Assessment
- 🟢 Normal: 3 (HY OAS, IG OAS, yield curve)
- 🟡 Caution: 1 (IPO market)
- 🔴 Risk: 2 (margin debt, ETF inflows)
Summary: Wednesday morning snapshot; CNN updated to the 9/1 (Tuesday) US close. The F&G composite is 44.57 (Fear), down 5.1 pts from 49.71, breaking below 45 into Fear territory — the lowest since 7/29 (46.32). After the 8/31 breakdown from the 53-57 band, 9/1 extended the decline with the late-July low band (41.2-45) now in range. Internals keep deteriorating with two marginal signals: strength (0.19→-0.27) went negative (first time since late July), safe-haven (-0.02→0.23) rebounded marginally, put/call (0.743) rose a 4th session, VIX 16.34 at its highest close since 8/4; junk bond demand (88.8) pulled back 5 pts from 93.8 with the raw ratio widening, the credit/equity divergence narrowing to 67.6 pts (12th session) but still extreme. Crisis-side no new deterioration (FRED 8/31): HY OAS 2.63%, IG 0.80%, 10Y-2Y +40bp all normal (3 green); IPO near record (yellow); margin debt $1.417T off its high and ETF inflows YTD $1.23T record (2 red). Action: sentiment has confirmed a “Fear-zone decline”; watch 41.2-45 (late-July lows) and 40 below, 47.5-50 resistance above; next session check whether the safe-haven rebound (0.233) persists and whether strength (-0.268) stabilizes — the former confirms whether risk-off is easing, the latter is the first signal for breadth stabilizing, and a continued pullback in junk bond demand (88.8) would foreshadow a hawkish credit turn. Stay defensive; the Extreme-Fear (<25) mean-reversion buy zone has not triggered — be patient.