CNN Fear & Greed Sentiment Analysis 2026-09-01
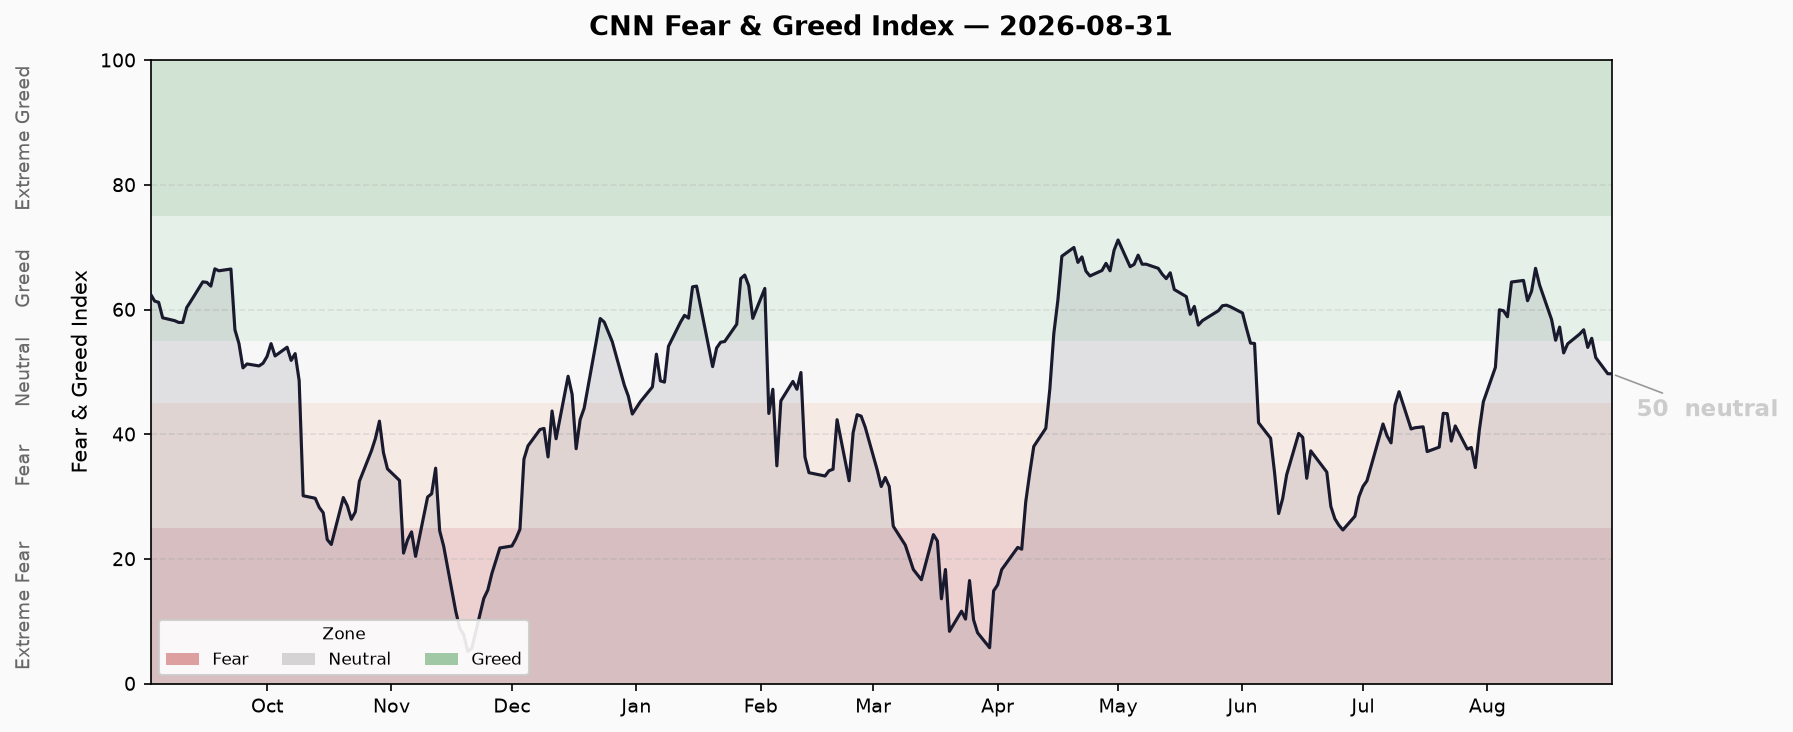
Tuesday morning snapshot (9/1): CNN Fear & Greed updated to 49.71 (Neutral) at Monday 8/31 US close, down 2.6 pts from Friday 8/28 close of 52.31 — the first reading back below the 50 neutral line since the 8/13 peak of 66.6, and the lowest since 8/3 (50.74). 8/31 was a decisive downside break: after 7 sessions of 53-57 range oscillation, the index broke down, taking out both the 53.06 and 53.94 double-bottom supports. Internal structure deteriorated broadly: Stock Price Strength (0.486→0.190, score 25 extreme fear) and Safe Haven Demand (1.46→-0.008, score 25.4 fear) collapsed on the same day; Breadth fell back from greed to neutral (53.8); only Junk Bond Demand (93.8, extreme greed) hit a fresh high — the credit-vs-equity divergence widened to 68.8 pts (11th consecutive session). Put/Call (0.696) hedging continued to build; VIX ticked up to 14.92 but remains low. No new deterioration on the crash-signal side (FRED 8/28): HY OAS 2.60% normal, IG OAS 0.79% normal, 10Y-2Y +41bp normal; margin debt $1.417T in July -5.7% MoM (🔴 high but retreating), IPO 2026 ~$145.8B +542% (🟡 near record), ETF inflows YTD $1.23T record (🔴). Summary 3🟢/1🟡/2🔴.
Composite Index Overview
- Latest Score: 49.71 — Neutral
- Data as of: 8/31 (Monday) US close (CNN updated; live reading, not a weekend freeze)
- Previous Close: 52.31 — Neutral (8/28, CNN revised historical series; the 54.4 cited in the last report was the prior API snapshot value — a CNN dual-pipeline revision)
- Daily Change: -2.6 pts
- Weekly Change: -6.4 pts (vs 56.09 on 8/24)
- Monthly Change: -1.0 pt (vs 50.74 on 8/3, one month ago)
- Yearly Change: -12.8 pts (vs 62.46 on 2025/9/2)
This is a Tuesday morning snapshot with CNN already updated to the Monday 8/31 close: the composite fell 2.6 pts from 8/28’s 52.31 to 49.71 — the first reading back below the 50 neutral line since the 8/13 peak of 66.6, and the lowest in about a month (8/3: 50.74). The key event: after ~7 sessions of 53-57 range oscillation, 8/31 broke down — both legs of the “double bottom” (8/20 low 53.06 and 8/26 low 53.94) were taken out, and the index fell into the lower edge of the neutral zone. Direction has been chosen decisively to the downside, shifting sentiment from “high-level numbness” to “active cooling.”
Last 10 Sessions Trend
| Date | Score | Rating |
|---|---|---|
| 8/18 | 55.09 | Greed |
| 8/19 | 57.2 | Greed |
| 8/20 | 53.06 | Neutral |
| 8/21 | 54.51 | Neutral |
| 8/24 | 56.09 | Greed |
| 8/25 | 56.77 | Greed |
| 8/26 | 53.94 | Neutral |
| 8/27 | 55.4 | Greed |
| 8/28 | 52.31 | Neutral |
| 8/31 | 49.71 | Neutral |
Trend assessment: after topping at 66.6 on 8/13, the index oscillated in a 53-57 band for 7 sessions (8/20-8/28); on 8/31 it broke below the 53 lower bound for the first time, closing at 49.71. The prior three touches of the 53 line (53.06 on 8/20, 53.94 on 8/26) all held; this time it broke straight through — the “triple-touch reversal” thesis is invalidated, the range oscillation is over, and direction has turned neutral-to-fearful. Below 49.71, watch the 45-49 band (late-July lows 45.23-41.2); above, 53-54 flips from support to resistance, with 58-59 (8/4-8/7 platform) as further resistance.
Seven Sub-Indicators Scan
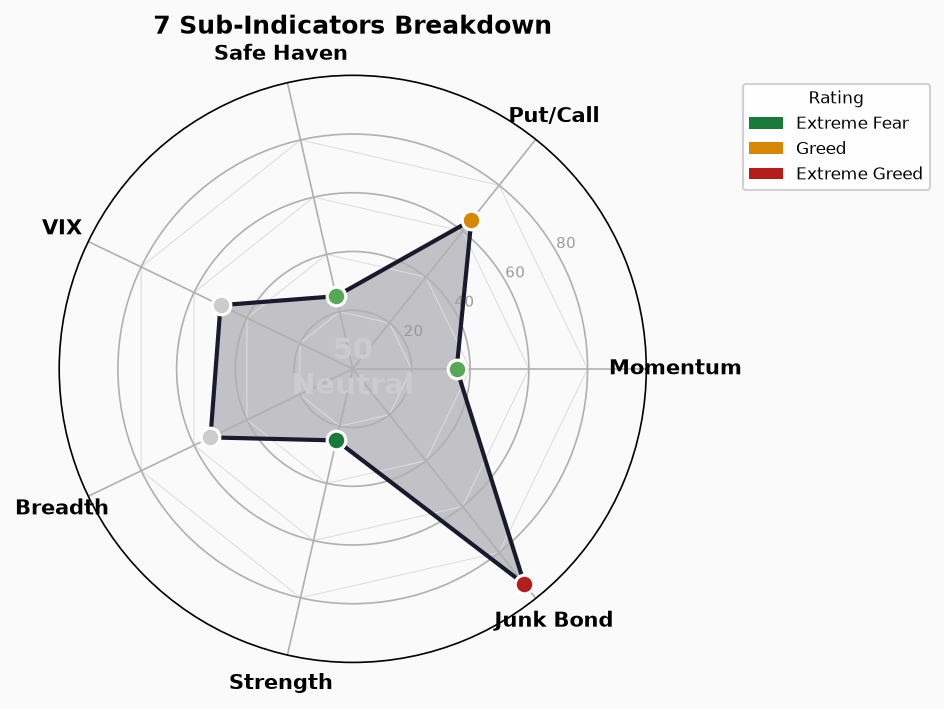
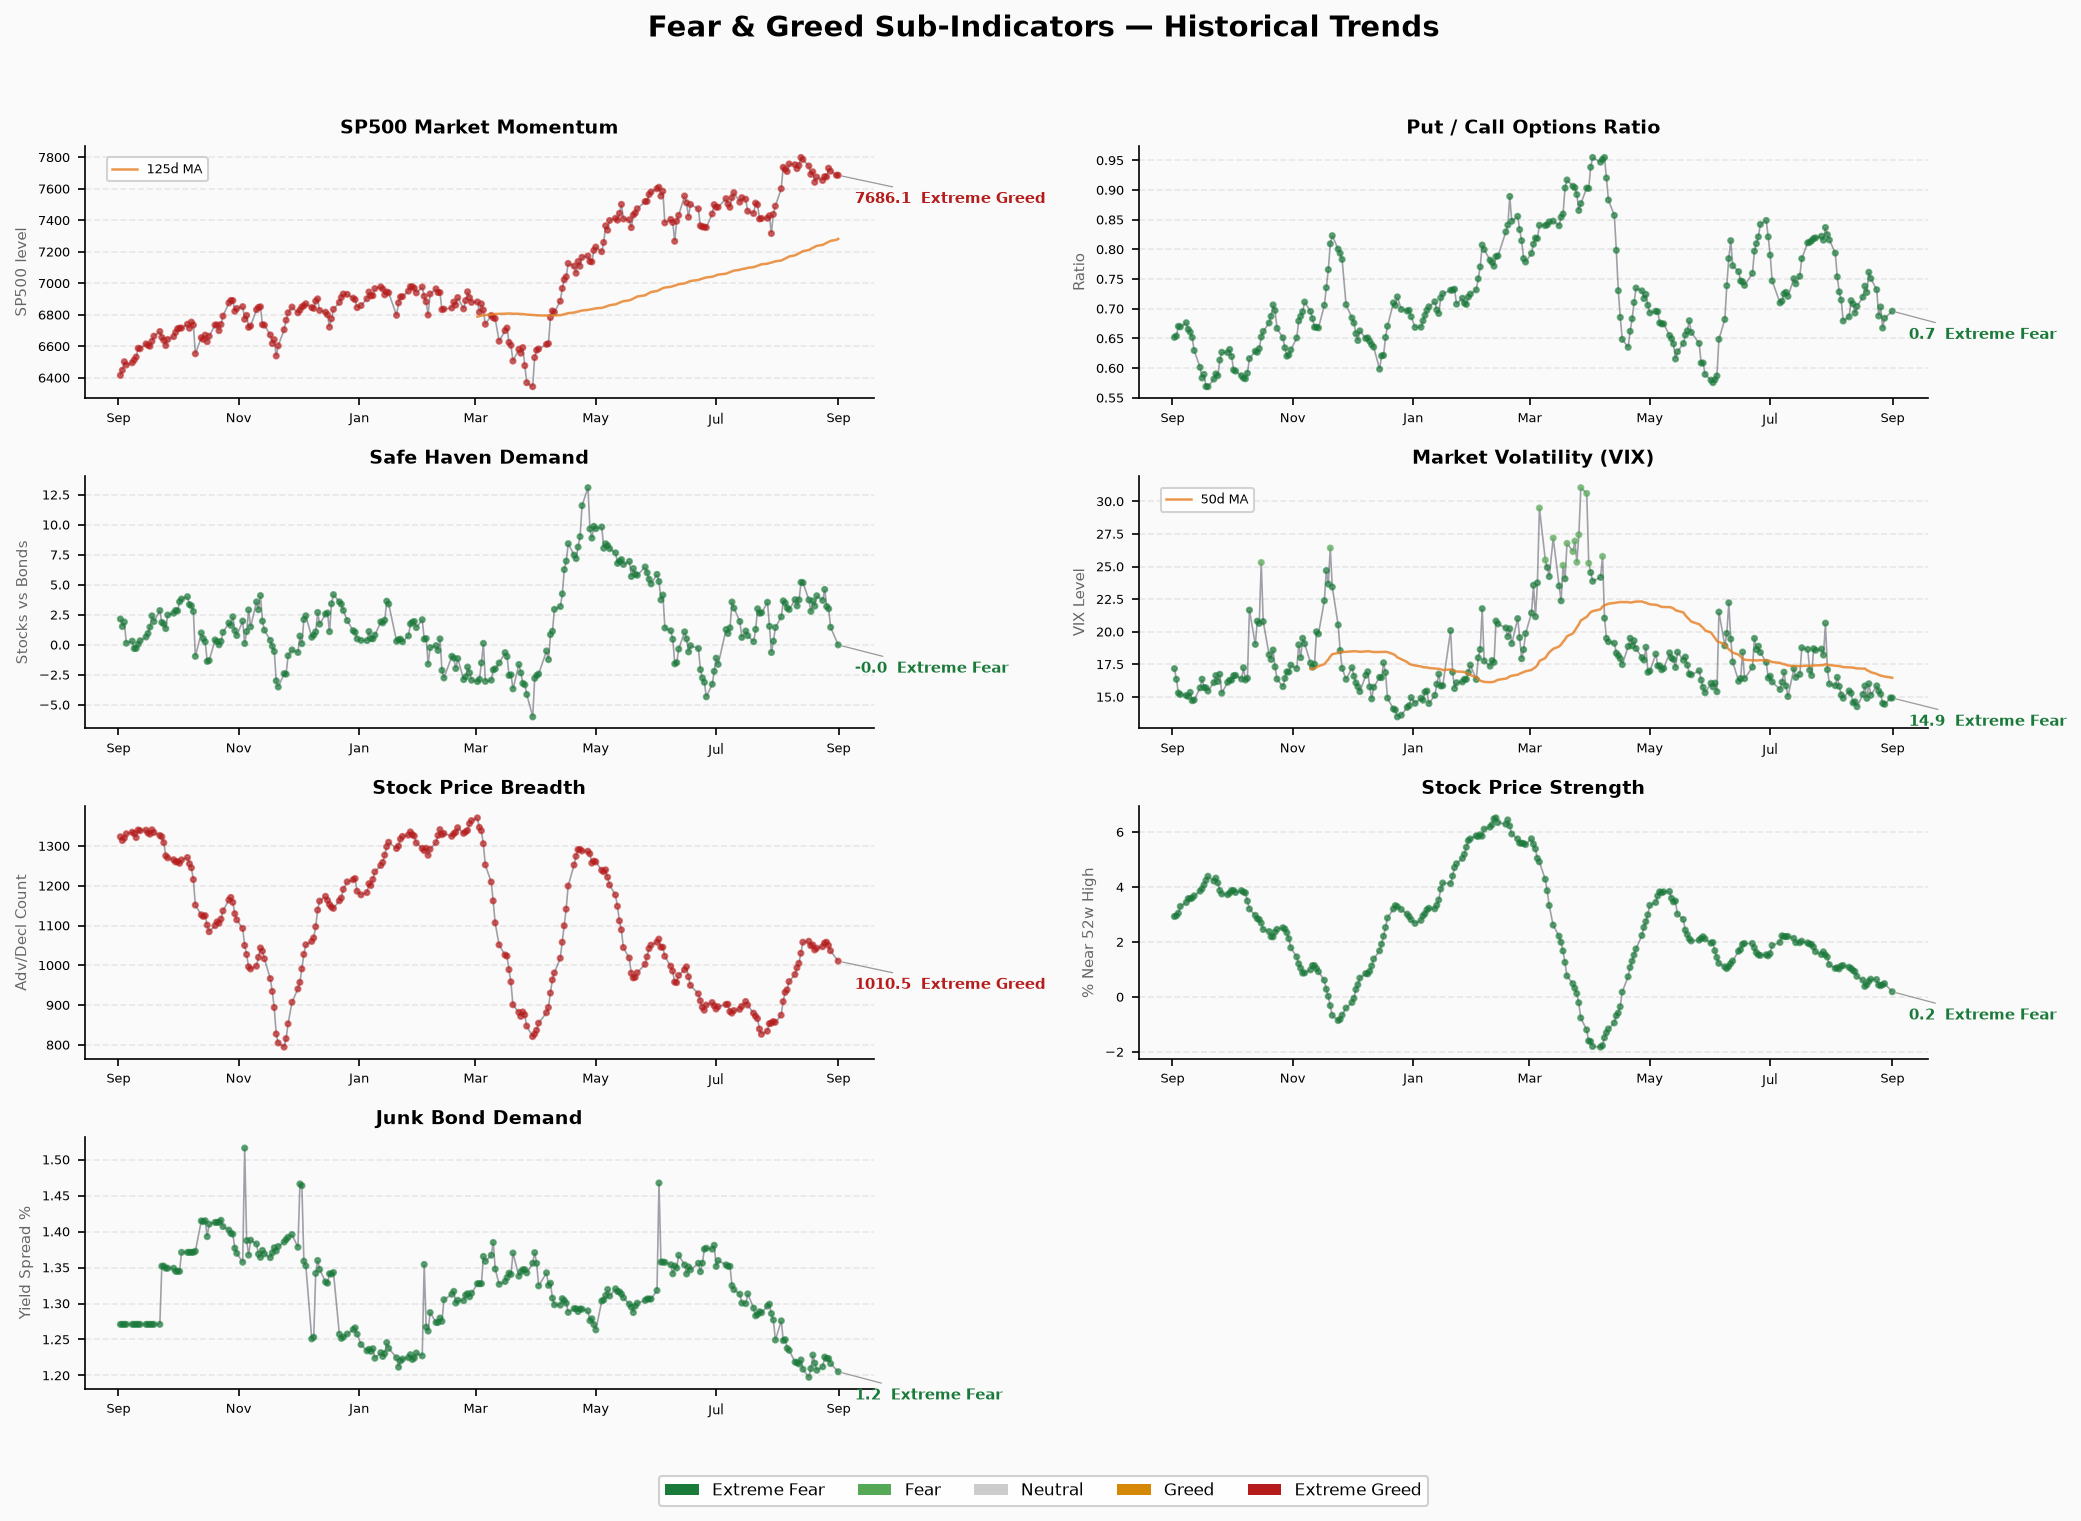
Market Momentum: 35.4 — Fear
- Raw: S&P 500 @ 7,686.14 (8/31), prior 7,711.76 (8/28), -25.6 (-0.33%)
- Direction: lower (40 → 35.4, -4.6), 10th consecutive session in fear
- Read: S&P 500 slipped to 7,686, with the gap to the 8/13 high of 7,798.99 widening to -1.4%. Momentum has spent 10 straight sessions in fear territory and has fallen further from the 44-45 plateau of 8/17-8/19 — the momentum base of the August rally is fully given back; the index is being held up by mega-cap weight while broad upside momentum has stalled
Stock Price Strength: 25 — Extreme Fear ⚠️ Biggest mover of the day
- Raw: 0.190 (share of stocks near 52-week high, 8/31), prior 0.486 (8/28)
- Direction: collapse (0.486 → 0.190, -0.296, -61%), score 29 → 25
- Read: The most violent single-day move of 8/31 — the share of stocks near 52-week highs nearly halved again, plunging from 48.6% to 19.0%. The multi-day “recovery toward the 0.5 neutral line” narrative was completely interrupted, and individual-stock breadth collapsed. The reading has fallen into extreme fear, its weakest since late July — real market breadth is much worse than the composite (49.71) suggests
Stock Price Breadth: 53.8 — Neutral
- Raw: 1,010.54 (52w-high minus 52w-low count, 8/31), prior 1,036.63 (8/28)
- Direction: lower (-26.1; 58.8 → 53.8), fell from greed back to neutral
- Read: Six consecutive greed sessions ended; breadth fell back to neutral. This sits in rare contrast with Strength (25, extreme fear) — new highs still outnumber new lows (positive breadth), yet the share of stocks near 52-week highs has collapsed to 19%, confirming 8/31 was a “index holds, stocks bleed” structural down day with gains concentrated in a few leaders
Put/Call Options: 64.8 — Greed
- Raw: 0.696 (P/C ratio, 8/31), prior 0.684 (8/28)
- Direction: rising (0.684 → 0.696, +0.012; 73.2 → 64.8)
- Read: P/C rose for a 3rd consecutive session as put protection continued to build, hedging demand ticking up. But 0.696 remains low (a greed reading) — the “market is unhedged” backdrop is unchanged. Investors still buy little downside insurance; if the decline extends, drawdown without a buffer keeps widening
Market Volatility (VIX): 50 — Neutral
- Raw: 14.92 (8/31), prior 14.43 (8/28)
- Direction: up slightly (+0.49)
- Read: VIX rose 0.49 to 14.92, still in this year’s low band. Extremely low vol = under-priced tail risk, echoing the low P/C — panic is not yet priced in. If the index keeps falling, VIX has room for a sharp catch-up spike
Junk Bond Demand: 93.8 — Extreme Greed
- Raw: 1.2052 (HY/IG spread ratio, 8/31), prior 1.2165 (8/28)
- Direction: higher (90.2 → 93.8, +3.6), fresh high
- Read: Credit spreads keep compressing; junk bond demand set a new extreme-greed high. Credit is the last corner still in extreme optimism — while the equity internal structure (Strength 25, Momentum 35.4) deteriorates broadly, credit stays “all quiet.” This split cannot persist; credit optimism is a lagging signal, and once it turns it will amplify the equity drawdown
Safe Haven Demand: 25.4 — Fear ⚠️ Collapse
- Raw: -0.008 (20-day stock vs bond excess return, 8/31), prior 1.457 (8/28)
- Direction: collapse (1.457 → -0.008, -1.46; 39.8 → 25.4), to around zero
- Read: Safe haven demand deteriorated for a 3rd straight report, and on 8/31 it crashed to around zero — the 20-day excess return of stocks over bonds is now nil, and relative preference for equities has been fully lost. This is the strongest risk-off confirmation: combined with the Strength collapse, 8/31 was not a routine pullback but a clear rotation day in which capital reallocated from equities to havens. If this persists in the next reading, the index decline will deepen
Structural Divergence Analysis
Core divergence: Junk Bond Demand extreme greed (93.8) vs Stock Price Strength extreme fear (25)
The 68.8-pt chasm widened 7.6 pts from 8/28’s 61.2, extending for an 11th consecutive session to a new cycle high:
- Fixed income: spreads compressed to the limit (HY OAS 2.60% at an absolute low), junk bond demand at a fresh high — credit investors still chase risk, risk appetite not yet tracking the equity decline
- Equities: composite back below 50; Strength (25, extreme fear) collapsed, Safe Haven (25.4) went to zero, Momentum (35.4, fear) and Breadth (53.8, neutral) all weakened — internal structure markedly worse than last week
- Historical lesson: extreme credit optimism alongside collapsing equity breadth is a classic top-region signature. Credit optimism is a lagging signal; once it turns it amplifies equity drawdowns. The divergence, now 11 sessions and widening, is the single biggest top-region risk
8/31 structural read (live data confirms risk-off)
- Strength (0.486→0.190, -61%) and Safe Haven (1.46→-0.008) collapsed the same day: breadth and capital preference rotated to defense simultaneously — the direct driver of the composite falling below 50, and the resolution of last week’s “signal pending” — the 8/28 safe-haven crash was not a one-off pulse but the start of a trend shift
- Breadth (58.8→53.8) fell from greed to neutral, though new highs still outnumber new lows: the index “holds” on mega-cap weight, broad upside has stalled — mid-decline character
- Put/Call (0.696) hedged for a 3rd straight session + VIX up to 14.92: hedging is building but from a low base — the “unhedged market” backdrop persists
- The composite break (53.06/53.94 double bottom) corroborates the internal collapse: this is not a “low-volume pullback” but a “breadth-meltdown decline”; the direction call moves from range-bound to down
Positive notes (marginal watch)
- Junk Bond Demand (93.8) is at a new high, but the raw spread ratio (1.2165→1.2052) is already ticking lower — if it rolls over from here, credit turning hawkish would amplify drawdowns; still an observation phase
- VIX at 14.92 and the index still in the neutral zone (45-55), far from panic — if the decline extends and VIX spikes on volume, it could fast approach an “extreme fear” mean-reversion buying zone, but we are not there yet
Secondary divergences:
- Breadth neutral (53.8) vs Strength extreme fear (25) → new highs still dominate, but the share near 52-week highs crashed to 19%: gains concentrate in leaders; real breadth is far weaker than the surface reading
- Composite neutral (49.71) vs four internal indicators in fear/collapse → CNN’s composite weighting is dragged by junk bond/safe haven inputs, masking the degree of internal deterioration
Trend Assessment
- Zone: lower edge of neutral (45-55); 8/31 closed 49.71, below the 50 line and the 53-57 band floor
- Direction: 8/13 peak 66.6 → 53-57 range for 7 sessions → 8/31 downside break (53.06/53.94 double bottom lost), back below 50. Direction chosen firmly down; lowest since 8/3 (50.74)
- Key watch points (next update after 9/1 US close):
- Below 49.71, the 45-49 band (late-July lows 45.23/41.2); above, 53-54 flips to resistance, 58-59 further resistance
- Safe Haven (-0.008): does it stabilize? Continued downside = risk-off confirmed, index toward fear (<45); a rebound would mark 8/31 as a one-off pulse
- Stock Price Strength (0.190): can it stabilize? First signal for breadth bottoming; recovery above 0.3 would suggest repair
- Junk Bond Demand (93.8): a rollover would signal credit turning hawkish and amplify drawdowns — in any convergence path, “credit falls” is more likely than “equities recover”; watch for the turn
- Historical context: a month ago (8/3’s 50.74) marked the launch of the rebound from late-July fear (37.89-45.23); 8/31’s 49.71 means the August rally is almost fully given back, sentiment returning to the edge of the July-bottom zone. Internal structure (Strength 25, Safe Haven at zero) is near July-bottom levels, but credit (junk 93.8) is far more optimistic than then — top characteristics (credit optimism + equity weakness) are more pronounced than in late July, and downside momentum has not fully played out
🚨 Crash-Precursor Dashboard
1. Credit Spreads
- High-Yield OAS: 2.60% | 🟢 Normal (<3% normal | 3-5% caution | 5-8% panic | >8% crisis)
- Investment-Grade OAS: 0.79% | 🟢 Normal
- Trend: slightly lower (FRED 8/28, HY 2.63%→2.60% -3.0bp, IG flat at 0.79%), holding at lows
- Note: FNG’s junk bond demand sub-indicator (93.8, extreme greed, fresh high) shows spreads at extreme compression, consistent with the absolute low level — credit remains the most optimistic corner, diverging from deteriorating equity internals by 68.8 pts
2. Yield Curve
- 10Y-2Y Spread: +41bp | 🟢 Normal, slightly flat (not inverted)
- 10Y: 4.73% | 2Y: 4.34% | 30Y: 5.22%
- 10Y-30Y: -49bp (30Y above 10Y, normal upward-sloping long end)
- Trend: 10Y-2Y widened +39bp → +41bp (+2bp); yields drifted higher overall (prior 10Y 4.67%/2Y 4.20%/30Y 5.19% → today 4.73%/4.34%/5.22%); curve shape stable, no inversion pressure
3. Margin Debt (FINRA)
- Latest: $1.417T (July 2026, FINRA official, released 2026-08-20)
- MoM: -$85B (-5.7% from June record $1.502T, 2nd consecutive monthly decline)
- YoY: +38.6% (vs $1.022T July 2025)
- Status: 🔴 Still in historically high territory
- Read: After the June record of $1.502T, July fell to $1.417T — the leverage amplifier is cooling but remains elevated. The combination of high absolute margin debt and passive inflows remains a primary source of systemic fragility. August data expected late September; a continued decline would confirm a deleveraging cycle has begun
4. IPO Market
- 2026 Stats: 105 IPOs (≥$50mm market cap, Renaissance Capital), proceeds ~$145.8B (+542% YoY), driven by mega-deals led by SpaceX ($86.2B, largest ever)
- Count: all-inclusive (small-cap/SPAC) ~232 deals, but quality concentrated in head-line mega-deals; August in summer pause, calendar expected to revive after Labor Day
- Comparison: 2025 had more IPOs but far less proceeds — this cycle is “moderate count, explosive dollar” mega-deal-led; SpaceX alone is ~54% of annual proceeds, a highly concentrated structure
- Status: 🟡 Proceeds near record but count not bubbled; limited breadth
5. ETF Fund Flows
- 2026 YTD ETF Net Inflows: US-listed $1.23T (through July, ETFGI); July +$193.4B, 51st consecutive month of net inflows
- Comparison: far above the 2025 full-year record of $678B; H1 US-listed ETFs already surpassed $1T; State Street sees $2.3T for the year (another record)
- Status: 🔴 Inflows at all-time high
- Read: sustained passive inflows on top of elevated margin debt keep systemic risk building; a reversal would easily trigger a stampede
Summary
- 🟢 Normal: 3 (HY OAS, IG OAS, yield curve)
- 🟡 Caution: 1 (IPO market)
- 🔴 Risk: 2 (margin debt, ETF inflows)
Wrap-up: This is a Tuesday morning snapshot with CNN updated to the Monday 8/31 US close. The FNG composite is 49.71 (Neutral), down 2.6 pts from 52.31 — the first reading below 50 since the 8/13 peak, a 7-session 53-57 range broken to the downside, both 53.06/53.94 double-bottom supports lost, direction decisively down. Internal structure deteriorated broadly: Strength (0.486→0.190, -61%) and Safe Haven (1.46→-0.008) collapsed on the same day, Breadth fell from greed to neutral (53.8); only Junk Bond Demand (93.8, extreme greed) hit a fresh high — the credit-vs-equity divergence widened to 68.8 pts (11th consecutive session), with top characteristics more pronounced than in late July. No new deterioration on the crash-signal side (FRED 8/28): HY OAS 2.60%, IG 0.79%, 10Y-2Y +41bp all normal (3🟢); IPO near record (🟡); margin debt $1.417T high but retreating, ETF inflows YTD $1.23T at record (2🔴). Operationally: 8/31 was a sentiment-break day, not a low-volume pullback; below, watch the 45-49 band (late-July lows); above, 53-54 turns to resistance. Next session, first watch whether Safe Haven (-0.008) stabilizes and Strength (0.190) finds a footing — the earliest signals for whether risk-off persists; a rollover in Junk Bond Demand (93.8) would be the first sign of credit turning hawkish. We are in a neutral-to-fearful, actively risk-off phase — defense first.