CNN Fear & Greed Analysis 2026-08-31
Monday early-morning snapshot (Aug 31): US market still in weekend (Sun evening ET, ~12h before Monday open), CNN F&G latest reading remains the Aug 28 (Fri) close of 54.4 (neutral), same source as yesterday's report, data unchanged. Aug 28 close fell 3.7 pts from 58.2 prior day; the Aug 27 break above 57.2 was rejected within a single session, breakout-failure risk persists, index sits mid-band of the 53-57 range awaiting Monday direction. Structural divergence persists: safe-haven demand (3.00→1.46 single-day collapse, 39.8 fear), Put/Call (81.8→73.2 put-protection return) leaning defensive, junk bond demand (90.2 extreme greed) new high, stock price strength (29 fear) rising 3rd straight day to 0.486 — credit/equity divergence 61.2 pts (10th straight session). No new deterioration in crash precursors (FRED 8/27): HY OAS 2.63% normal, IG OAS 0.79% normal, 10Y-2Y +39bp normal-ish flat; margin debt Jul $1.417T MoM -5.7% (🔴 high), IPO 2026 ~$144B +631% (🟡 near record), ETF inflows YTD $1.23T record (🔴). Total 3🟢/1🟡/2🔴.
Composite Index Overview
- Latest score: 54.4 — Neutral
- As of: Aug 28 (Fri) close (US market closed Aug 29-30 weekend; Aug 31 Monday not yet open, CNN data paused here)
- Previous close: 58.2 — Greed (Aug 27, CNN API prior value; historical series reads 55.4, due to CNN daily back-revision)
- Daily change: -3.7 pts
- Weekly change: -0.1 pts (vs 54.51 a week ago)
- Monthly change: +16.5 pts (vs 37.89, in fear zone a month ago)
- Yearly change: -10.0 pts (vs 64.43)
This report is a Monday early-morning snapshot: 06:30 Beijing time Aug 31 = Sunday evening Aug 30 ET, US markets still in weekend, CNN Fear & Greed latest reading paused at the Aug 28 (Fri) close of 54.43, same source as yesterday’s report, unchanged. Core backdrop persists: Aug 28 close fell 3.7 pts from 58.17 prior day — the break above the Aug 19 high of 57.2 was rejected within a single session, breakout-failure risk persists, and the index is back oscillating in the 53-57 band. Before Monday’s open (9:30 ET = 21:30 Beijing), all sentiment readings are based on the Aug 28 close structure; the next reading update comes after Monday’s close.
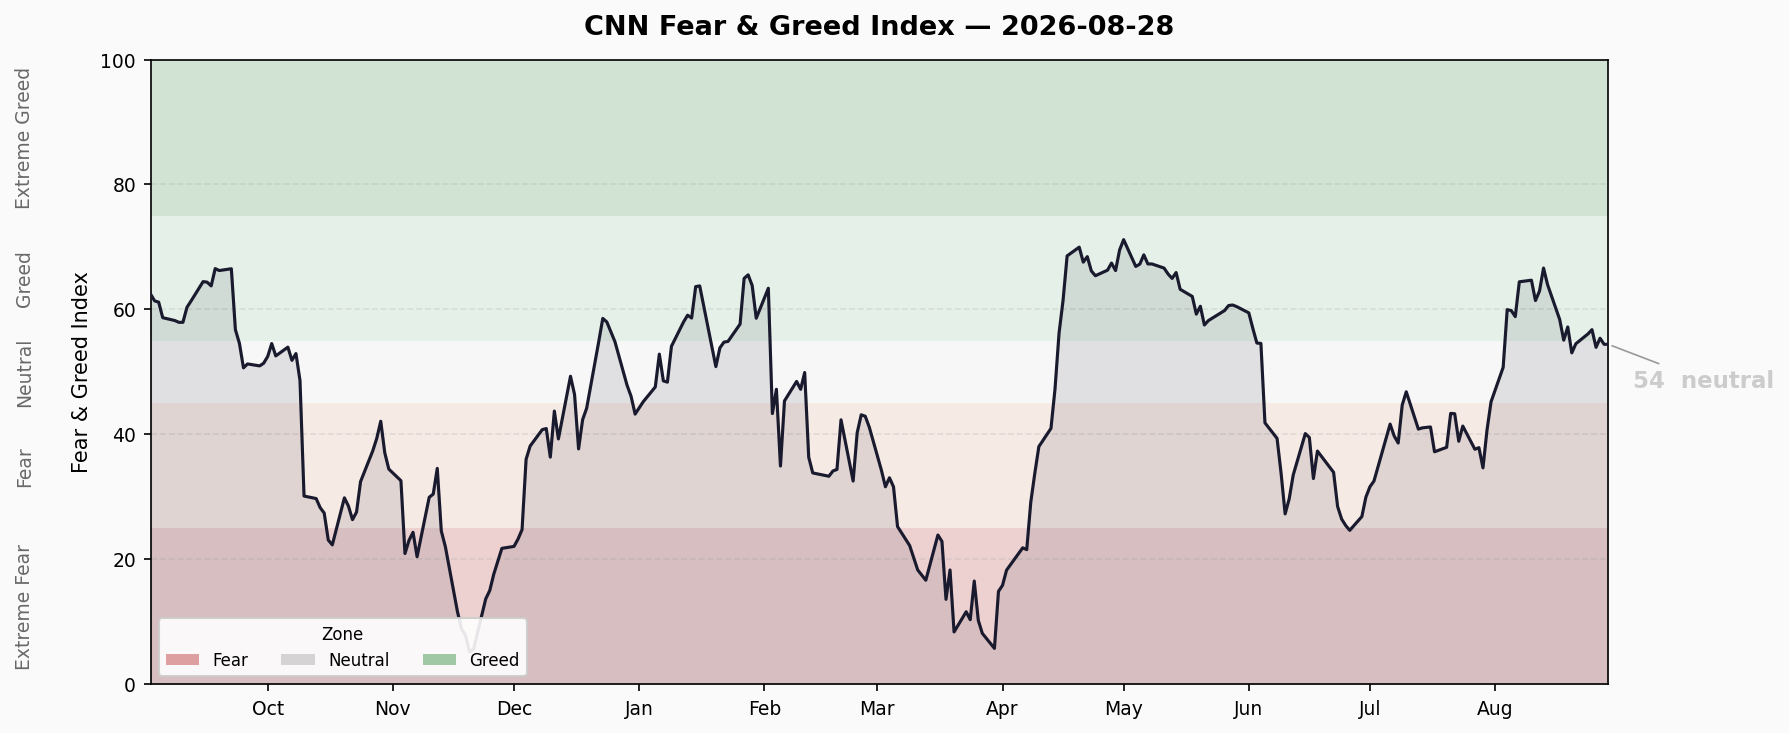
Last 10 Trading Days Trend
| Date | Score | Rating |
|---|---|---|
| 8/17 | 58.4 | Greed |
| 8/18 | 55.1 | Greed |
| 8/19 | 57.2 | Greed |
| 8/20 | 53.1 | Neutral |
| 8/21 | 54.5 | Neutral |
| 8/24 | 56.1 | Greed |
| 8/25 | 56.8 | Greed |
| 8/26 | 53.9 | Neutral |
| 8/27 | 55.4* | Greed |
| 8/28 | 54.4 | Neutral |
*Note: CNN API prior value for 8/27 is 58.2; historical series reads 55.4, a CNN dual-feed back-revision difference (same as prior days).
Trend read: Peaked at 66.6 on 8/13, pulled back ~13 pts, hit 53.1 low on 8/20, then oscillated in the 53-57 band for 7 sessions (paused over the weekend). 8/26 retested 53.9 (second bottom of double bottom), 8/27 rebounded 58.2 breaking 57.2, but 8/28 fell back to 54.4 — the breakout failed to hold, supply above 57.2-58.2 persists, and this state carried into the weekend. The index remains range-bound with a mildly bearish-neutral tilt; Monday’s open is the key directional catalyst. Below, the 53.1/53.9 double bottom is the firmest support; above, 62-64 (Aug 12-14 platform) is stronger resistance.
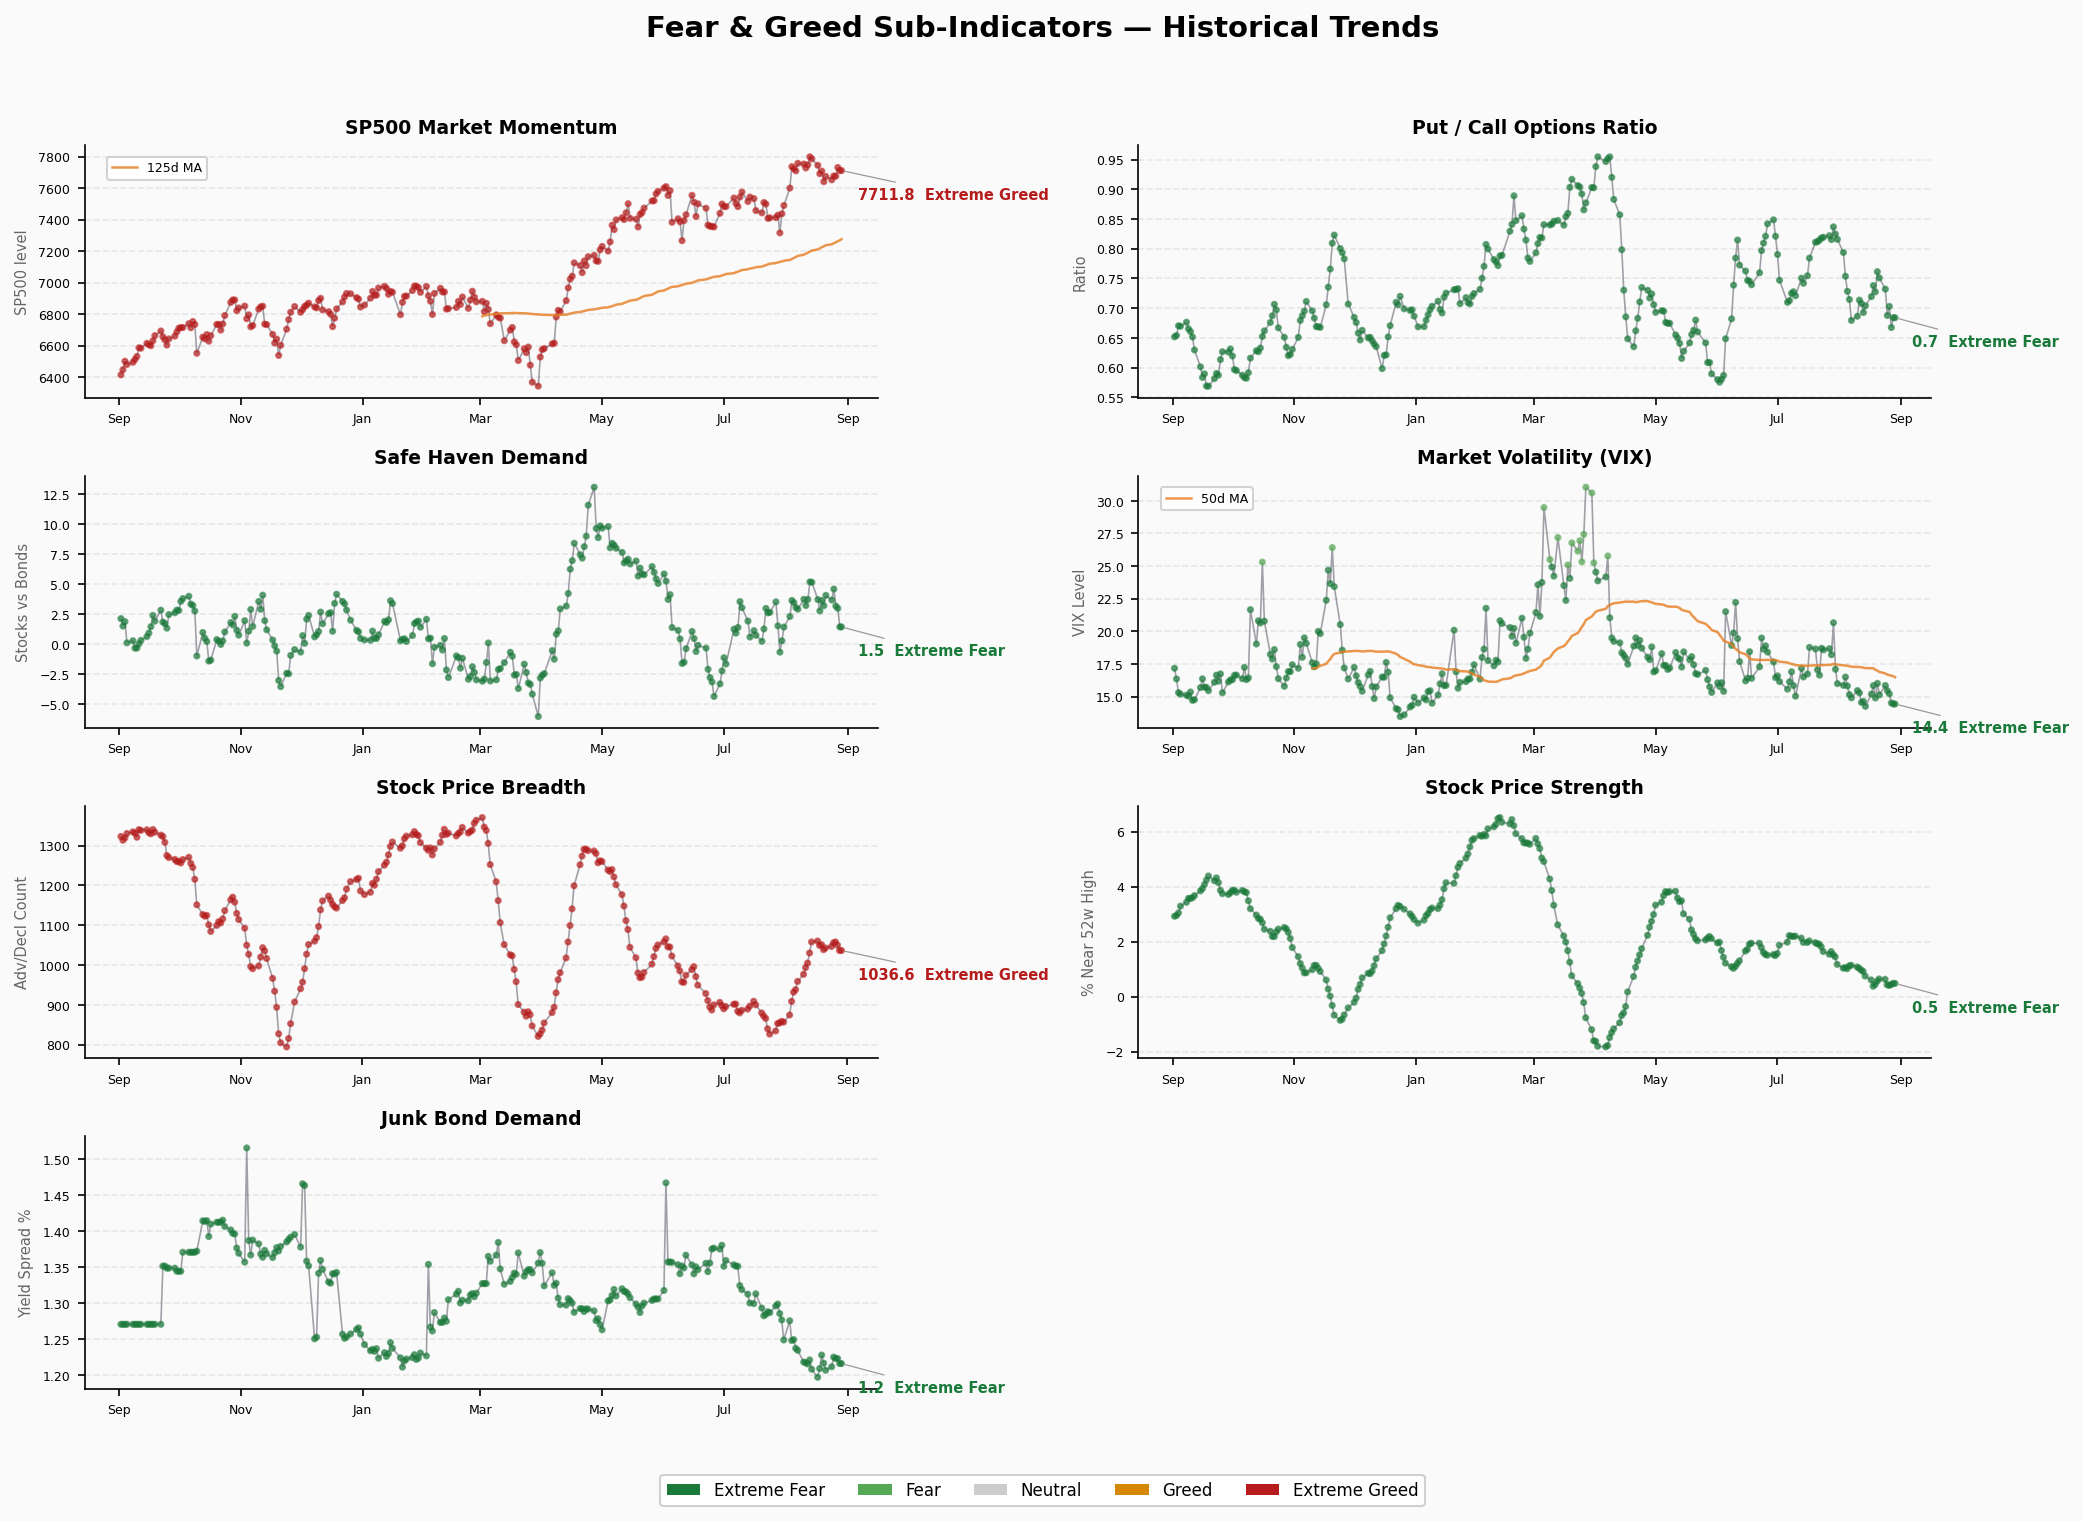
Seven Sub-Indicators Scan
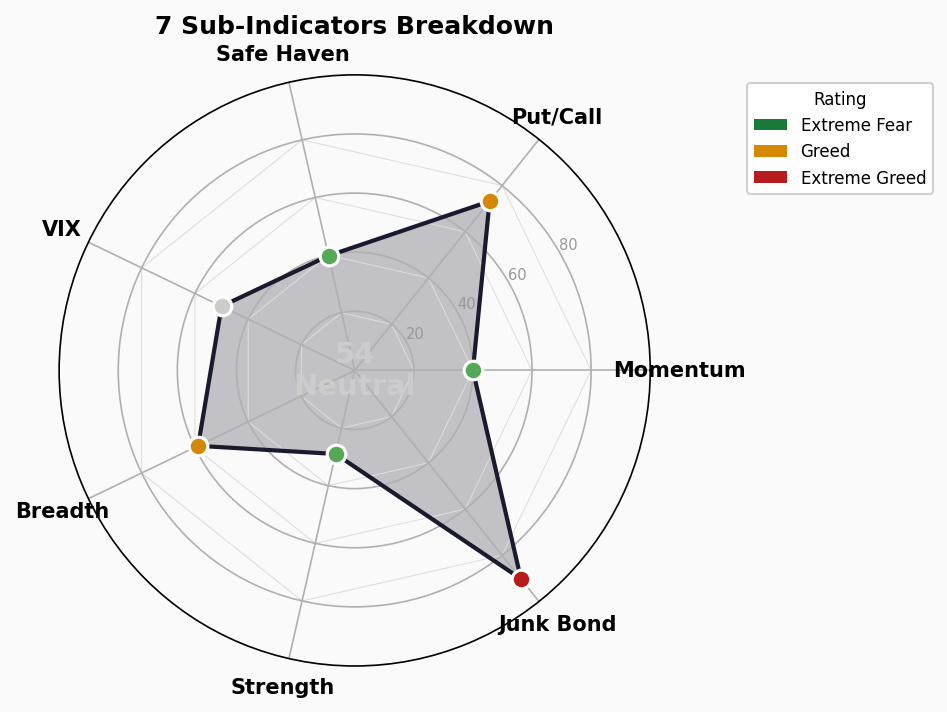
Market Momentum: 40 — Fear
- Raw value: S&P 500 @ 7,711.76 (8/28), prior 7,730.99 (8/27), -19.2 (-0.25%)
- Direction: Down (44 → 40, -4)
- Read: After briefly recovering to 44, momentum fell again; S&P 500 slipped 0.25% to 7,712, re-widening the gap from the Aug 13 high of 7,798.99. Momentum has been in the fear zone (<50) for an 8th straight session; the disconnect between index level and momentum shows CNN’s piecewise weighting is conservative, and the rebound’s momentum base remains fragile
Stock Price Strength: 29 — Fear
- Raw value: 0.486 (share of stocks near 52-week highs, 8/28), prior 0.441 (8/27)
- Direction: Up (0.441 → 0.486, +0.045) — 3rd straight session of recovery
- Read: After a two-day collapse (0.63→0.44→0.41), now recovering for a 3rd straight day (0.41→0.44→0.49) — the most constructive aspect of the current internal structure. But 0.486 remains in the fear zone, approaching the 0.5 neutral line — individual-stock momentum is at the threshold between “stabilizing” and “strengthening”; a break above 0.5 would be the real signal that rebound breadth is turning solid
Stock Price Breadth: 58.8 — Greed
- Raw value: 1,036.63 (new-high minus new-low count, 8/28), prior 1,050.10 (8/27)
- Direction: Slightly down (-13.5)
- Read: In the greed zone for a 6th straight session, but easing further from highs. Strength up + breadth down, the spread (29 vs 58.8) roughly flat vs yesterday (28.2 vs 60.2) — the concentration divergence has not worsened further, but breadth momentum itself is fading — the breadth of participation in the rally is not expanding
Put/Call: 73.2 — Greed
- Raw value: 0.684 (P/C ratio, 8/28), prior 0.6675 (8/27)
- Direction: Down (81.8 → 73.2, -8.6)
- Read: P/C ticked up from 0.667 to 0.684, some put-protection demand returning, options market cooled from “extreme greed” to “greed”. The previously flagged “unhedged market” state has eased somewhat, but 0.684 remains low — hedging demand still weak; if positioning flips, the downside without buffer persists
Market Volatility (VIX): 50 — Neutral
- Raw value: 14.43 (8/28), prior 14.51 (8/27)
- Direction: Slightly down (-0.08)
- Read: VIX eased 0.08 to 14.43, near the year’s low band, fear pricing still thin. Ultra-low vol = insufficient tail-risk pricing, reinforcing the low P/C reading — the market still buys very little downside “insurance”
Junk Bond Demand: 90.2 — Extreme Greed
- Raw value: 1.2165 (HY/IG spread ratio, 8/28), prior 1.2235 (8/27)
- Direction: Up (86.8 → 90.2, +3.4), new recent high
- Read: Credit spreads compress further, junk bond demand posts a new extreme-greed high. Credit remains the most bullish corner of the market, late-cycle characteristics persist — the divergence vs the weak equity internal structure (strength 29, momentum 40) has widened to 61.2 pts, the largest structural contradiction currently
Safe Haven Demand: 39.8 — Fear
- Raw value: 1.4568 (stock vs bond 20-day excess return, 8/28), prior 3.00 (8/27)
- Direction: Sharp down (3.00 → 1.46, -1.55; 56.2 → 39.8, -16.4), fell from greed into fear
- Read: The single biggest one-day move on 8/28 — stocks’ relative excess return over bonds collapsed more than half, the reading fell straight from greed into fear. This is a clear risk-off marginal signal: the index barely fell, but relative preference for stocks deteriorated sharply; risk appetite has already cooled at the sentiment level. The signal has held for a 2nd report (weekend pause) — Monday will confirm whether it persists
Structural Contradiction Analysis
Core contradiction: Junk bond demand extreme greed (90.2) vs stock price strength fear (29)
The 61.2-pt extreme gap has persisted for a 10th straight session (widened 2.6 pts from 58.6 on 8/27):
- Fixed income: Spreads compressed to the extreme (HY OAS 2.63% at absolute lows), junk demand prints new highs, investors chase credit risk, risk appetite extreme
- Equities: Index at 54.4, stock price strength (29, fear) and market momentum (40, fear) still in the fear zone — even with individual momentum recovering 3 straight days, internal structure remains weak
- Historical lesson: Extreme credit optimism vs weak equity internal momentum is a pattern commonly seen near market tops. Credit optimism is a lagging signal; its turn would amplify equity drawdowns — the divergence, now 10 days and still widening, is the biggest single overhang
Monday validation watch (data paused at 8/28, carrying over last week’s focus)
- Safe-haven demand (3.00→1.46, 56.2→39.8) fell sharply into the fear zone, the biggest drag on the 8/28 composite decline. The collapse in stocks’ excess return vs bonds signals waning risk-on momentum — if Monday’s reading continues down, risk-off is confirmed and the index falls further; if it recovers, 8/28 was a one-off pulse
- Put/Call (81.8→73.2) partial put-protection return + safe-haven turning to fear: the “unhedged market” state has eased marginally, but VIX 14.43 remains low, defensive pricing still insufficient
- The Aug 27 break of 57.2 was rejected within one session — breakout-failure risk carried into the weekend, sentiment back to the 53-57 mid-band; Monday’s open decides direction
Positive signals (vs last week)
- Stock price strength recovering a 3rd straight day (0.41→0.44→0.49), approaching the 0.5 neutral line — a break above 0.5 would genuinely strengthen individual-stock momentum and provide breadth for the next leg up
- But breadth (1,050→1,037) momentum fading and momentum (44→40) falling: the single-point strength recovery has not yet lifted the whole structure; needs 2-3 consecutive days of confirmation
Secondary contradictions:
- Market momentum (40, fear) vs S&P 500 at 7,712 → CNN piecewise weighting is conservative; index level disconnected from internal momentum
- Breadth greed (58.8) vs safe-haven fear (39.8) → advancing names still dominate on the surface, but relative capital preference has turned defensive; index supported by weight and credit optimism
Trend Assessment
- Range position: Upper edge of the neutral zone (45-55); Aug 28 pullback to 54.4, back to the 53-57 mid-band; data paused over weekend, no new signals
- Direction: 8/13 peak 66.6 → 8/20 low 53.1 → 53-57 band oscillation ~7 days → 8/27 rebound 58.2 broke 57.2 → 8/28 fell to 54.4, breakout rejected within one day. Breakout-failure risk persists, short-term back to range oscillation, direction neutral-to-mildly-bearish
- Key watch points (pending Monday 8/31 open):
- Support 53.1/53.9 (double bottom): a loss opens the downside of the range and escalates the pullback; resistance 57.2-58.2 (failed-break zone), 62-64 (Aug 12-14 platform)
- Whether the safe-haven collapse (39.8, fear) continues: if Monday keeps falling, risk-off is confirmed and the index drawdown deepens; if it stabilizes, treat it as a one-off pulse
- Whether stock price strength (0.486) breaks the 0.5 neutral line: decides whether individual-stock momentum truly strengthens, key to internal repair
- If junk bond demand (90.2) rolls over from highs, credit turning hawkish would amplify drawdowns — the biggest single risk
- Historical comparison: A month ago (37.89) in the fear zone; the 16.5-pt rebound has retraced most of mid-July’s pullback. But 7 sessions without breaking out of the 53-57 band, sentiment is “high-level numbing” — index at highs while sentiment stalls, plus safe-haven turning, short-term upside momentum insufficient; support at the 53 band floor matters more than the 57 ceiling
🚨 Crash-Precursor Indicator Dashboard
1. Credit Spreads
- High-Yield OAS: 2.63% | 🟢 Normal (<3% normal | 3-5% caution | 5-8% panic | >8% crisis)
- Investment-Grade OAS: 0.79% | 🟢 Normal
- Trend: Slightly down (FRED 8/27 data, HY 2.67%→2.63% -4.0bp, IG 0.80%→0.79% -1.0bp), staying low
- Note: The F&G junk bond demand sub-indicator (90.2, extreme greed, new recent high) shows extreme spread compression, consistent with absolute spread lows — credit remains the most bullish corner
2. Yield Curve
- 10Y-2Y Spread: +39bp | 🟢 Normal-ish flat (not inverted)
- 10Y: 4.67% | 2Y: 4.20% | 30Y: 5.19%
- 10Y-30Y: -52bp (30Y above 10Y, long end normally upward-sloping)
- Trend: 10Y-2Y narrowed from +47bp to +39bp (-8bp), yields broadly up ~1bp (prior 10Y 4.66%/2Y 4.19%/30Y 5.18%), curve shape stable, no inversion pressure
3. Margin Debt (FINRA)
- Latest: $1.417T (July 2026, FINRA official, released 2026-08-20)
- MoM: -$85B (down 5.7% from June’s record $1.502T, 2nd straight monthly decline)
- YoY: +38.6% (vs $1.022T July 2025)
- Status: 🔴 Still in historical-high territory
- Read: After June’s record $1.502T, July pulled back to $1.417T — the leverage amplifier has cooled but remains elevated. The combination of absolute margin debt and passive inflows is still the main source of systemic fragility — August data (late Sep release), if continuing down, would confirm deleveraging has begun
4. IPO Market
- 2026 stats: 93 IPOs (≥$50mm market cap, Renaissance Capital), proceeds ~$144B (+631% YoY), driven by SpaceX (largest ever) and other mega-deals
- Count: Full count (incl. small-cap/SPAC) much higher, but quality concentrated in top mega-deals; August in summer pause, calendar picks up after Labor Day in September
- Comparison: 2025 had more IPOs but far less proceeds — this cycle is “moderate count, exploding dollar amount,” mega-deal dominated
- Status: 🟡 Proceeds near record but count not frothy, limited breadth
5. ETF Fund Flows
- 2026 YTD ETF net inflows: US-listed $1.23T (through end-July, ETFGI), July +$193.4B, 51st straight month of net inflows
- Comparison: Far above 2025’s full-year record of $678B; H1 US-listed ETFs already exceeded $1T, State Street projects $2.3T full year (another record)
- Status: 🔴 Inflows at all-time highs
- Read: Passive money flooding in on top of elevated margin debt — systemic risk accumulating; a reversal could trigger stampede
Summary
- 🟢 Normal: 3 (HY OAS, IG OAS, yield curve)
- 🟡 Caution: 1 (IPO market)
- 🔴 Risk: 2 (margin debt, ETF inflows)
Wrap-up: This report is a Monday early-morning snapshot — US market still in weekend (Sun evening ET), CNN F&G latest reading remains the Aug 28 (Fri) close of 54.4 (neutral), same source as the weekend report, data unchanged. Core conclusions persist: credit spreads and the yield curve remain healthy, no new deterioration in the crash-precursor side (3🟢/1🟡/2🔴). F&G Aug 28 close 54.4, down 3.7 pts — the Aug 27 break of 57.2 was rejected within one session, breakout-failure risk persists, index sits mid-band of 53-57 awaiting Monday’s direction. Internal divergence continues: safe-haven (56.2→39.8) fell into fear, Put/Call (81.8→73.2) put protection returned, in stark contrast to junk bond demand (90.2, new recent high) — credit extremely bullish while equity relative preference turns defensive, divergence 61.2 pts (10th straight session). The only positive is stock price strength recovering 3 straight days (0.486, near the 0.5 neutral line). Positioning: the 53.1/53.9 double bottom is the range lifeline; at Monday’s open (21:30 Beijing) first watch whether safe-haven demand keeps falling (deciding if risk-off is confirmed) and whether strength breaks 0.5; above, 57.2-58.2 is the failed-break zone, range oscillation unchanged until reclaimed on volume.