CNN Fear & Greed Sentiment Analysis 2026-08-30
Weekend snapshot (8/30 Sun): the latest CNN FNG reading is still the 8/28 (Fri) close of 54.4 (Neutral), the same source as yesterday's report — 8/29-8/30 are non-trading days, so sentiment readings are frozen at Friday's close. The 8/28 close fell 3.7 points from the prior 58.2; the 8/27 break above 57.2 was undone within a single session, breakout-invalidation risk is rising, and the index has returned to 53-57 chop. The pullback was driven by Safe Haven Demand (3.00→1.46 one-session collapse, 56.2→39.8 into fear) and Put/Call (81.8→73.2, put protection drifting back); meanwhile Junk Bond Demand (90.2, extreme greed) hit a fresh high and Stock Price Strength (29, fear) recovered for a 3rd day to 0.486 — the credit/equity divergence widened to 61.2 points (10th session). No new deterioration on the crisis side (FRED 8/27): HY OAS 2.63% normal, IG OAS 0.79% normal, 10Y-2Y +39bp normal-flat; margin debt July $1.417T MoM -5.7% (🔴 elevated), IPO fundraising $160.6B through 8/19 approaching the 2021 record (🟡), ETF inflows YTD $1.23T record (🔴). Composite: 3🟢/1🟡/2🔴.
Composite Index Overview
- Latest Score: 54.4 — Neutral
- Data as of: 8/28 (Fri) close (8/29-8/30 weekend, non-trading; CNN data frozen here)
- Prior Close: 58.2 — Greed (8/27, CNN API prior value; the same-day historical-series reading is 55.4, a CNN daily back-revision artifact)
- Daily Change: -3.7 points
- Weekly Change: -0.1 points (vs 54.51 a week ago)
- Monthly Change: +16.5 points (vs 37.89; one month ago it sat in fear territory)
- Yearly Change: -10.0 points (vs 64.43)
This report is a weekend snapshot: 8/30 is a Sunday, US markets are closed on 8/29 (Sat) and 8/30 (Sun), and the latest CNN Fear & Greed reading remains frozen at the 8/28 (Fri) close of 54.43 — the same data source and readings as yesterday’s report. The 8/28 close fell 3.7 points from the prior 58.17: yesterday’s break above the key 8/19 resistance of 57.2 failed within a single session — the breakout held for only one day before being pulled back, and the index has slipped back into range-bound chop within the 53-57 band. The next reading update comes after Monday’s 8/31 close.
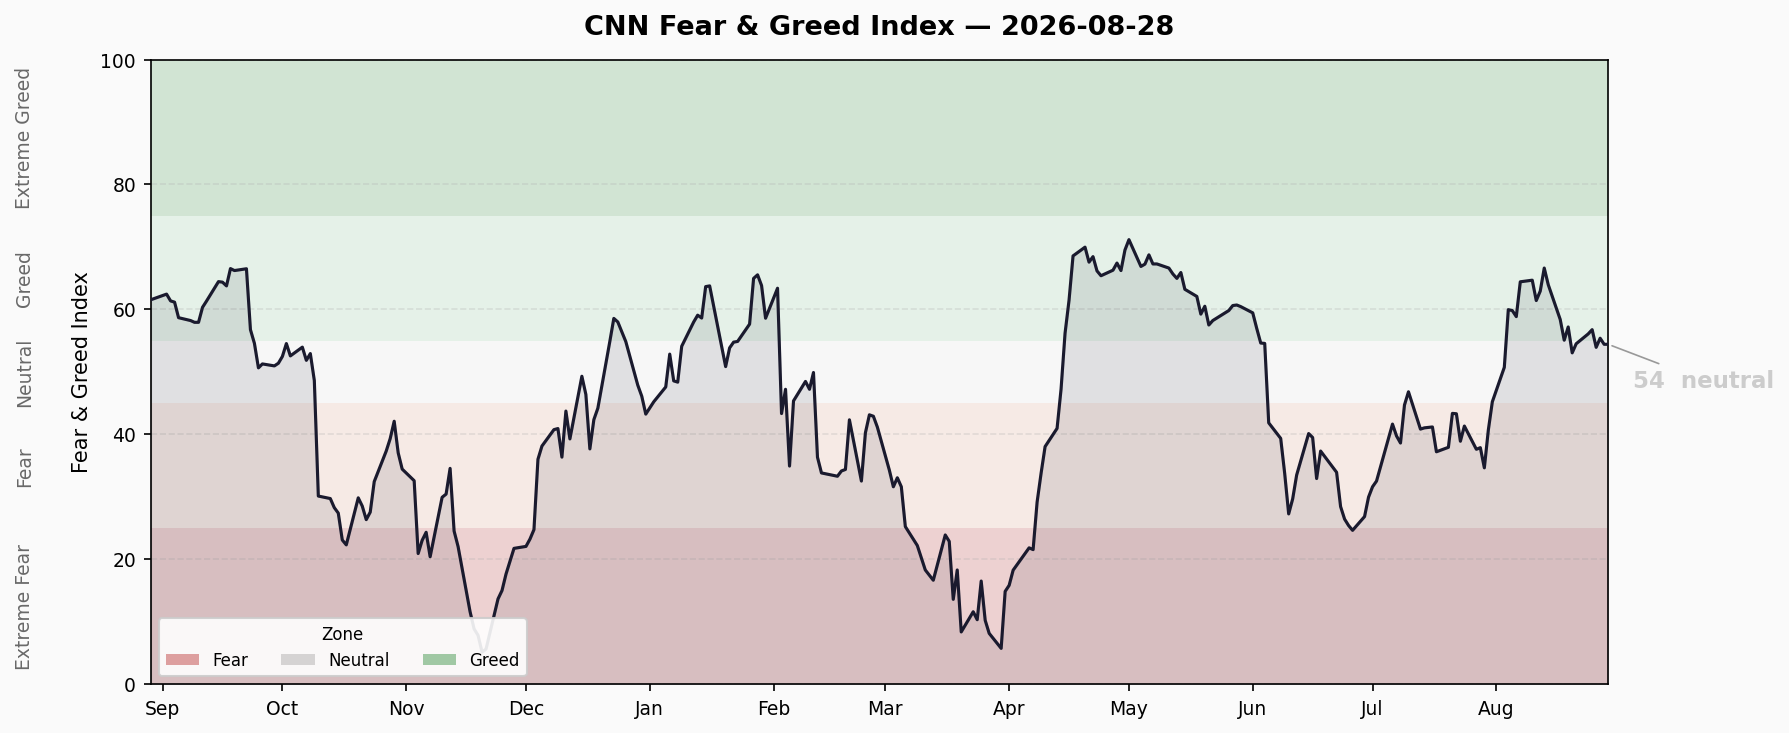
Last 10 Trading Sessions
| Date | Score | Rating |
|---|---|---|
| 8/17 | 58.4 | Greed |
| 8/18 | 55.1 | Greed |
| 8/19 | 57.2 | Greed |
| 8/20 | 53.1 | Neutral |
| 8/21 | 54.5 | Neutral |
| 8/24 | 56.1 | Greed |
| 8/25 | 56.8 | Greed |
| 8/26 | 53.9 | Neutral |
| 8/27 | 55.4* | Greed |
| 8/28 | 54.4 | Neutral |
*Note: the CNN API prior-day value for 8/27 is 58.2 while the historical series reads 55.4 — the usual CNN dual-pipeline back-revision gap (same as yesterday).
Trend read: after topping at 66.6 on 8/13, the index gave back about 13 points, touched a low of 53.1 on 8/20, and has now chopped within the 53-57 band for 7 sessions. 8/26 retested 53.9 (second leg of the double bottom), 8/27 bounced to 58.2 breaking 57.2, but 8/28 fell back to 54.4 — the breakout did not hold, indicating supply remains above in the 57.2-58.2 zone. The index is still range-bound with no directional trend. The 53.1/53.9 double bottom is the firmest support below; 62-64 (the 8/12-8/14 platform) is stronger resistance above.
Seven Sub-Indicators Scan
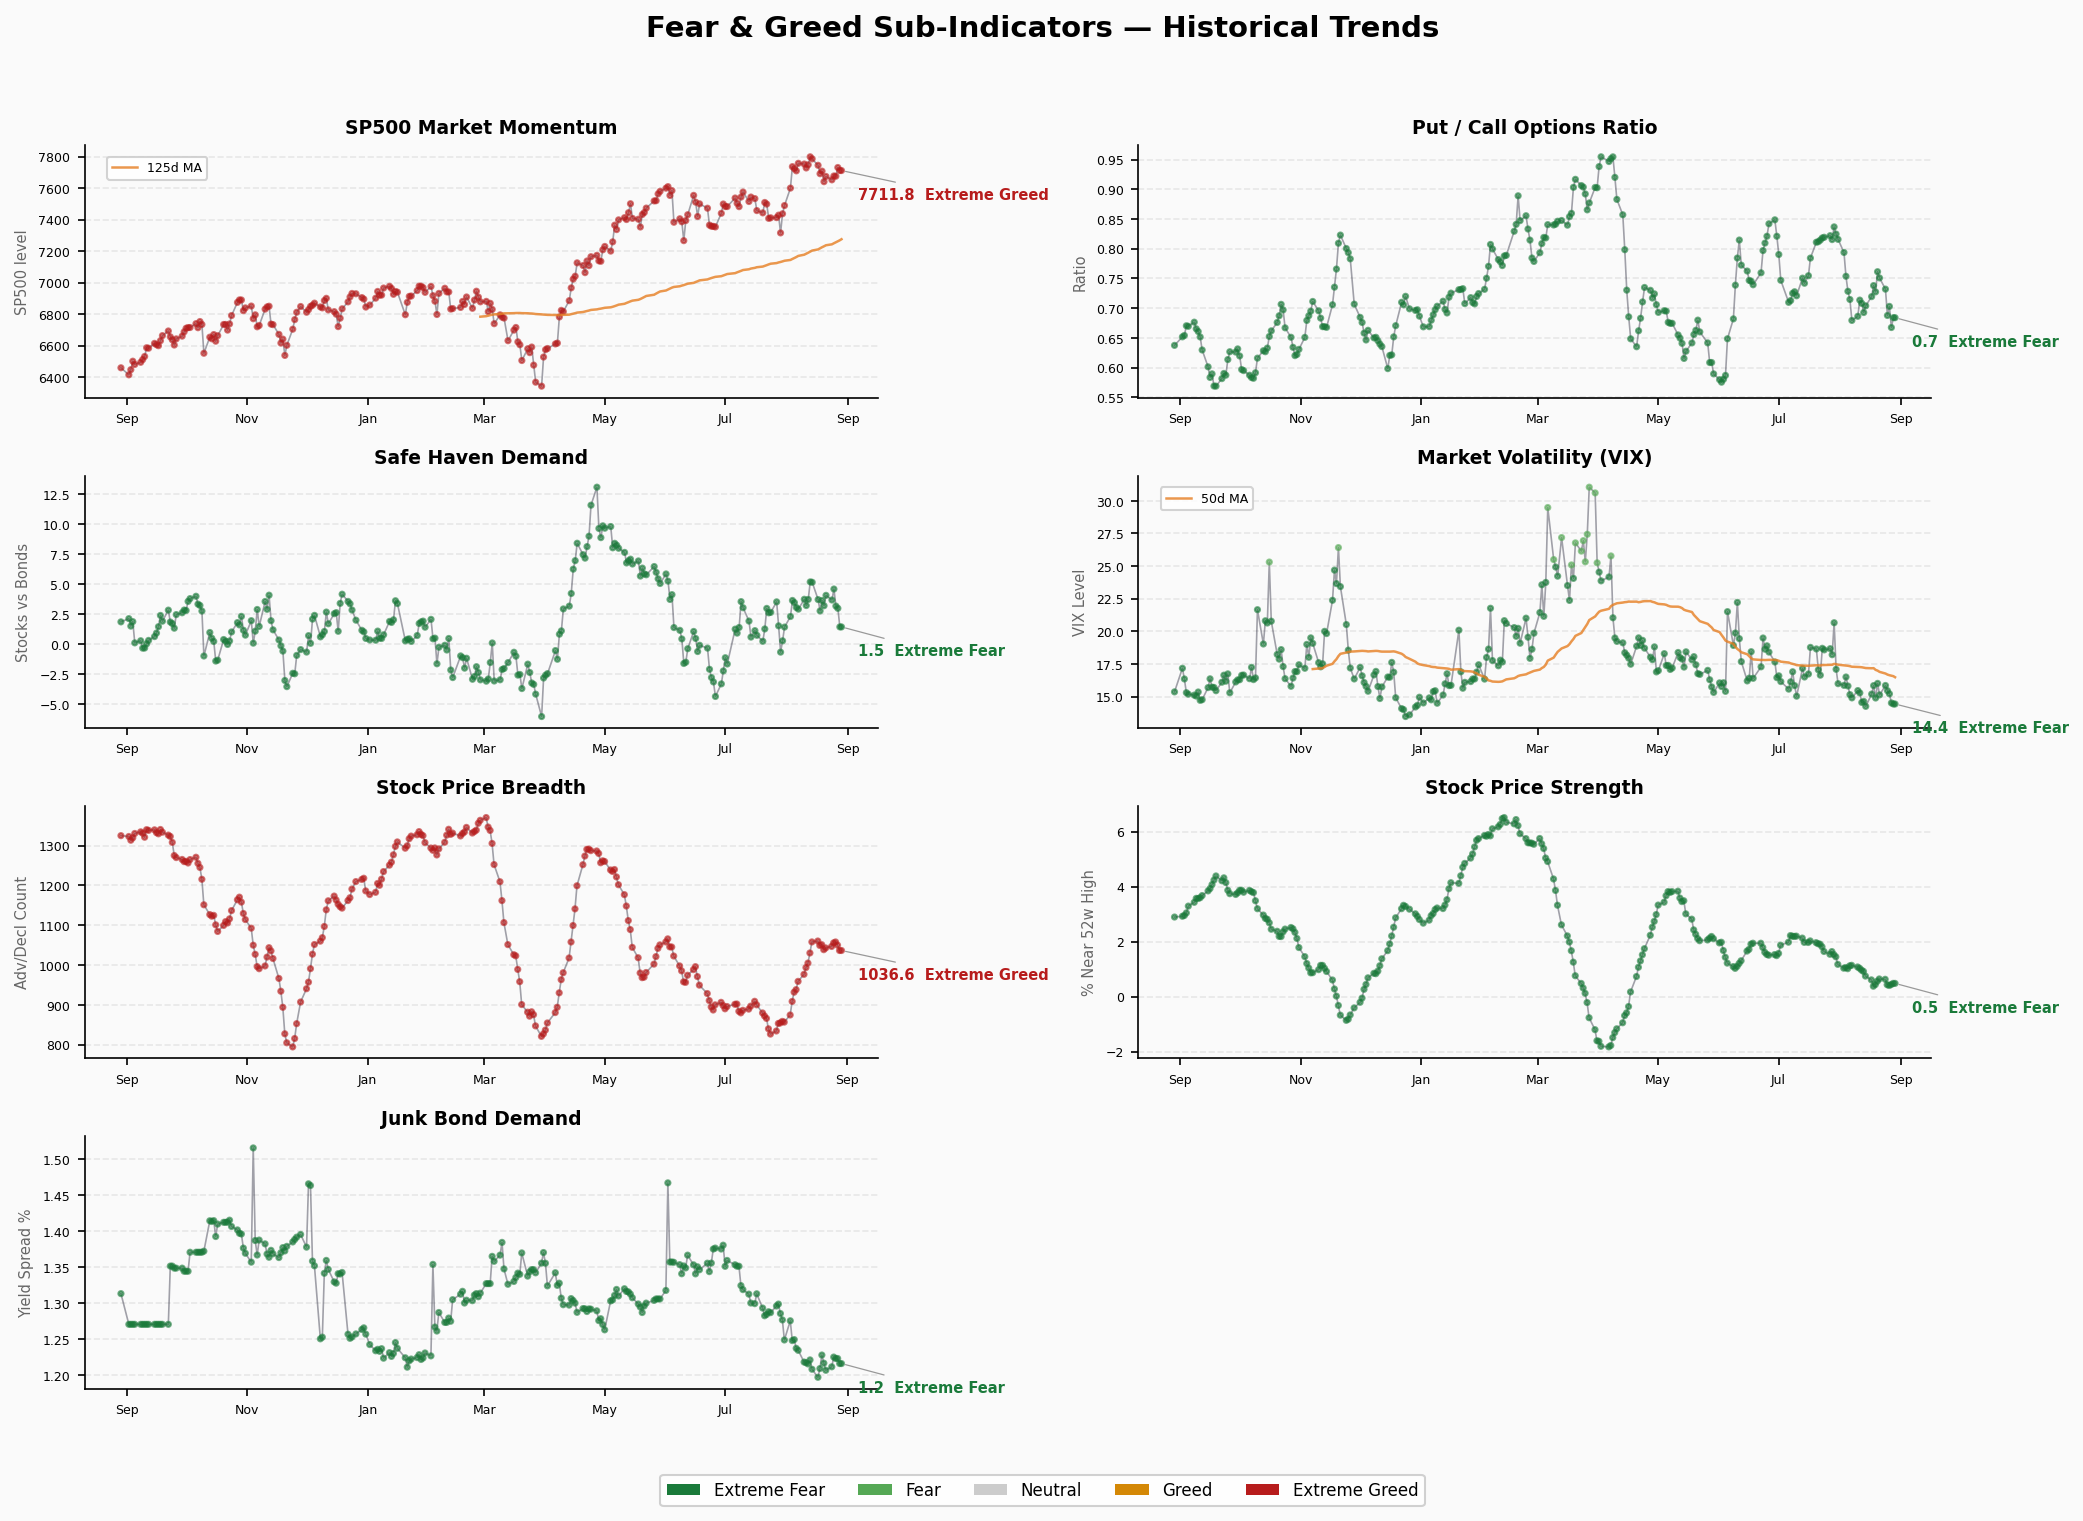
Market Momentum: 40 — Fear
- Raw value: S&P 500 @ 7,711.76 (8/28), prior 7,730.99 (8/27), -19.2 (-0.25%)
- Direction: Pullback (44 → 40, -4)
- Read: after a brief bounce to 44 the day before, momentum rolled back again as the S&P slipped 0.25% to 7,712, widening the gap back to the 8/13 high of 7,798.99. Momentum has now spent an 8th consecutive session in fear territory (<50); the disconnect between index level and the momentum reading shows CNN’s piecewise weighting is conservative, and the underlying momentum base of the rebound remains thin
Stock Price Strength: 29 — Fear
- Raw value: 0.486 (share of stocks near 52-week highs, 8/28), prior 0.441 (8/27)
- Direction: Recovering (0.441 → 0.486, +0.045) — third straight session of improvement
- Read: after the two-day collapse (0.63→0.44→0.41), strength has now repaired for a third consecutive day (0.41→0.44→0.49) — the most constructive piece of the current internal structure. But 0.486 is still in fear territory, approaching the 0.5 neutral line — individual-stock momentum is at the cusp of shifting from “stabilizing” to “strengthening”; a close above 0.5 would be a genuine signal that the breadth base of this rebound is turning up
Stock Price Breadth: 58.8 — Greed
- Raw value: 1,036.63 (new highs minus new lows count, 8/28), prior 1,050.10 (8/27)
- Direction: Slight decline (-13.5)
- Read: a 6th consecutive session in greed territory, but the reading continues to drift lower from its high. Strength recovering while breadth falls keeps the gap between the two (29 vs 58.8) roughly flat versus yesterday (28.2 vs 60.2) — the internal concentration conflict is not worsening further, but breadth momentum itself is fading: the participation base of the advance is not broadening
Put/Call Options: 73.2 — Greed
- Raw value: 0.684 (P/C ratio, 8/28), prior 0.6675 (8/27)
- Direction: Cooling (81.8 → 73.2, -8.6)
- Read: P/C ticked up from 0.667 to 0.684 as some put protection drifted back in, cooling the options market from yesterday’s “extreme greed” to “greed.” The “market defenseless” condition flagged yesterday has eased marginally, but 0.684 is still low and hedging demand remains weak — if sentiment turns, the lack of buffer leaves downside risk intact
Market Volatility (VIX): 50 — Neutral
- Raw value: 14.43 (8/28), prior 14.51 (8/27)
- Direction: Slight decline (-0.08)
- Read: VIX eased another 0.08 to 14.43, near the low end of its yearly range — panic pricing remains thin. Very low volatility means tail risk is underpriced, corroborating the low P/C: the market is still buying very little downside “insurance”
Junk Bond Demand: 90.2 — Extreme Greed
- Raw value: 1.2165 (HY/IG spread ratio, 8/28), prior 1.2235 (8/27)
- Direction: Still rising (86.8 → 90.2, +3.4), fresh recent high
- Read: credit spreads compressed further and junk-bond demand set a new extreme-greed reading. Credit remains the most bullish corner of the market, extending the late-cycle character — the divergence versus the weak internal equity structure (strength 29, momentum 40) widened to 61.2 points, the single biggest structural contradiction right now
Safe Haven Demand: 39.8 — Fear
- Raw value: 1.4568 (20-day stock vs bond excess return, 8/28), prior 3.00 (8/27)
- Direction: Sharp drop (3.00 → 1.46, -1.55; 56.2 → 39.8, -16.4), falling from greed into fear
- Read: the single largest point move on 8/28 — the stock-over-bond excess return collapsed by more than half in one session, sending the reading from greed straight into fear territory. This is a clear marginal risk-off signal: although the index barely fell, the relative preference for stocks over bonds deteriorated sharply, and risk appetite has already cooled at the sentiment level. Watch whether this is a leading indicator of a broader sentiment shift
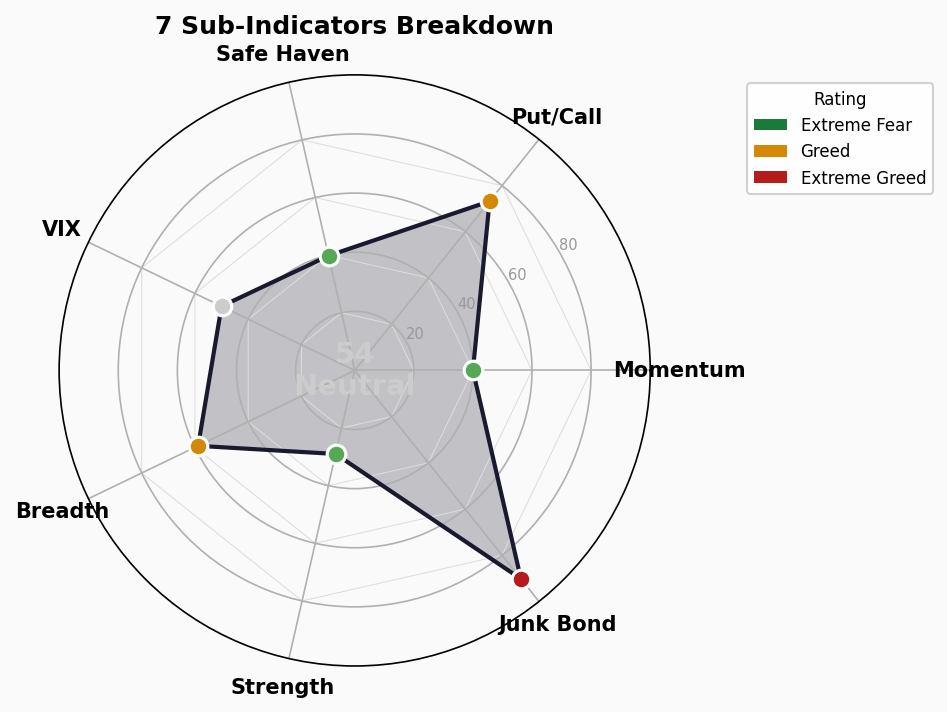
Structural Contradiction Analysis
Core contradiction: Junk Bond Demand extreme greed (90.2) vs Stock Price Strength fear (29)
The 61.2-point chasm has now persisted for a 10th consecutive session (re-widened +2.6 from yesterday’s 58.6):
- Fixed income: spreads compressed to the limit (HY OAS 2.63% at absolute lows), junk-bond demand set a fresh high as investors chase credit risk — risk appetite is extreme
- Equities: the index eased to 54.4, while Stock Price Strength (29, fear) and Market Momentum (40, fear) remain in fear territory — even with a third straight day of individual-stock repair, the internal structure stays weak
- Historical lesson: a credit market that is extremely optimistic sitting alongside weak internal equity momentum has historically been a top-zone configuration. Credit optimism is a lagging signal — once it turns, it amplifies equity drawdowns. The divergence is now in its 10th day and still widening — the single biggest overhang
Weekend note (data frozen, carrying yesterday’s watch items)
- Safe Haven Demand (3.00→1.46, 56.2→39.8) plunged into fear territory in a single session — the biggest drag on the 8/28 composite decline (roughly a -16-point-scale move). A collapsing stock-over-bond excess return means risk-on momentum is fading; risk appetite has cooled on the sentiment side first
- Put/Call (81.8→73.2) with put protection partially returning + safe haven demand turning fearful: the “market defenseless” condition flagged yesterday has eased marginally, but VIX at 14.43 remains low and defensive pricing is still insufficient
- The 8/27 break above 57.2 was pulled back after only one day — breakout-invalidation risk is rising and sentiment has reverted to the 53-57 mid-band; this state persists into the weekend, watch Monday’s open for whether it continues
Positive signal (vs yesterday)
- Stock Price Strength recovered for a 3rd straight session (0.41→0.44→0.49), approaching the 0.5 neutral line — a close above 0.5 would mark a genuine strengthening in stock-level momentum and provide a breadth base for the next leg up
- But breadth momentum (1,050→1,037) is fading and momentum (44→40) pulled back: the single-point strength repair has not yet lifted the overall structure — it needs 2-3 more sessions of confirmation
Secondary contradictions:
- Market Momentum (40, fear) vs S&P 500 at 7,712 → CNN’s piecewise weighting is conservative; index level is decoupled from internal momentum
- Breadth greed (58.8) vs Safe Haven fear (39.8) → advancers still numerically dominate, but relative capital preference has turned defensive; the index is propped up by weight and credit optimism
Trend Assessment
- Zone positioning: upper edge of the neutral band (45-55); 8/28 pulled back to 54.4, back to the 53-57 mid-band; data frozen here over the weekend, no new signals
- Direction: 8/13 top 66.6 → 8/20 low 53.1 → ~7 sessions of 53-57 chop → 8/27 bounce to 58.2 breaking 57.2 → 8/28 fallback to 54.4, the breakout undone in a single day. Breakout-invalidation risk is rising; short-term back to range-bound, direction neutral-to-weak
- Key levels to watch (waiting for Monday 8/31’s open update):
- Support below 53.1/53.9 (double bottom): losing it means a range breakdown and deeper pullback; resistance above 57.2-58.2 (failed-breakout zone), 62-64 (8/12-8/14 platform)
- Whether Safe Haven Demand (39.8, fear) keeps falling: further declines on Monday would confirm risk-off and deepen the pullback
- Whether Stock Price Strength (0.486) can close above the 0.5 neutral line: the key to whether stock-level momentum truly strengthens and the internal structure repairs
- Whether Junk Bond Demand (90.2) rolls over from its high: a hawkish turn in credit would amplify drawdowns — the single biggest point risk
- Historical contrast: a month ago (37.89) the index was in fear territory; this +16.5-point rebound has recovered most of mid-July’s drawdown. But 7 sessions of 53-57 chop without resolution, with sentiment going “numb at the top” — index making new highs while the sentiment reading stalls — combined with safe haven demand turning, means short-term upside momentum is lacking; the lower band at 53 deserves more attention than the upper at 57
🚨 Crisis Precursor Indicator Dashboard
1. Credit Spreads
- High-Yield OAS: 2.63% | 🟢 Normal (<3% normal | 3-5% watch | 5-8% panic | >8% crisis)
- Investment-Grade OAS: 0.79% | 🟢 Normal
- Trend: slight decline (8/27 FRED data, HY 2.67%→2.63% -4.0bp, IG 0.80%→0.79% -1.0bp), holding at low levels
- Note: the FNG junk-bond-demand sub-indicator (90.2, extreme greed, fresh recent high) shows spreads compressed to the limit, consistent with the low absolute spread levels — credit remains the most bullish corner of the market
2. Yield Curve
- 10Y-2Y Spread: +39bp | 🟢 Normal-flat (not inverted)
- 10Y: 4.67% | 2Y: 4.20% | 30Y: 5.19%
- 10Y-30Y: -52bp (30Y above 10Y, long end normally upward-sloping)
- Trend: 10Y-2Y narrowed from +47bp to +39bp (-8bp); yields ticked up ~1bp overall (prior 10Y 4.66%/2Y 4.19%/30Y 5.18%); curve shape stable, no inversion pressure
3. Margin Debt (FINRA)
- Latest: $1.417T (July 2026, FINRA official)
- MoM: -$85B (down 5.7% from June’s record $1.502T, 2nd straight monthly decline)
- YoY: +38.6% (vs $1.022T in July 2025)
- Status: 🔴 still in elevated historical territory
- Read: after hitting a record $1.502T in June, July eased to $1.417T — the leverage amplifier is cooling but remains high. The combination of elevated absolute margin debt and passive inflows is still the main source of systemic fragility — if August data (published in September) keeps declining, it will confirm the start of a deleveraging cycle
4. IPO Market
- 2026 YTD: fundraising ~$160.6B (through 8/19, Renaissance Capital), already approaching the 2021 full-year record of $175B (with 4+ months to go)
- Count: 232 total (+4.0% YoY); 93 at the ≥$50mm market-cap threshold
- Drivers: SpaceX (~$86.2B, largest ever) carries the bulk; an Anthropic IPO is rumored to file as early as month-end and could rival SpaceX
- Status: 🟡 active with fundraising approaching records, but the count is not bubble-like — propped up by mega-deals, breadth is limited; August is in a summer pause, calendar expected to pick up after Labor Day in September
5. ETF Fund Flows
- 2026 YTD ETF net inflows: US-listed $1.23T (through end-July, ETFGI); July alone +$193.4B, a 51st consecutive month of net inflows
- Comparison: far above the 2025 full-year record of $678B; H1 US-listed ETF flows already exceeded $1T, and State Street projects $2.3T for the year (another record)
- Status: 🔴 inflows at all-time highs
- Read: persistent passive inflows layered on top of still-elevated margin debt are building systemic risk — a reversal would be prone to a stampede
Composite Assessment
- 🟢 Normal: 3 (HY OAS, IG OAS, yield curve)
- 🟡 Watch: 1 (IPO market)
- 🔴 Risk: 2 (margin debt, ETF inflows)
Summary: This report is a weekend snapshot — 8/30 (Sun) is a non-trading day, so the latest CNN FNG reading remains the 8/28 (Fri) close of 54.4 (Neutral), the same source and unchanged from yesterday; all sentiment readings are identical. Core conclusions carry over: credit spreads and the yield curve remain healthy, no new deterioration on the crisis side (3🟢/1🟡/2🔴). FNG closed 8/28 at 54.4, down 3.7 points from the prior day — yesterday’s break of 57.2 was undone within a single session, breakout-invalidation risk is rising, and the index is back to 53-57 chop. Internal divergence intensified: Safe Haven Demand (56.2→39.8) collapsed into fear in one session and Put/Call (81.8→73.2) saw put protection drift back in, in stark contrast to Junk Bond Demand (90.2, fresh high) — credit extremely optimistic while equity relative preference turns defensive; the divergence widened to 61.2 points (10th straight session). The only positive is Stock Price Strength recovering for a 3rd day (0.486, approaching the 0.5 neutral line). Operationally: the 53.1/53.9 double bottom is the range lifeline; at Monday’s open first check whether Safe Haven Demand keeps falling (decides if risk-off is confirmed); 57.2-58.2 above is the failed-breakout zone — until recaptured on volume, the range-bound regime holds.