CNN Fear & Greed Analysis 2026-08-28
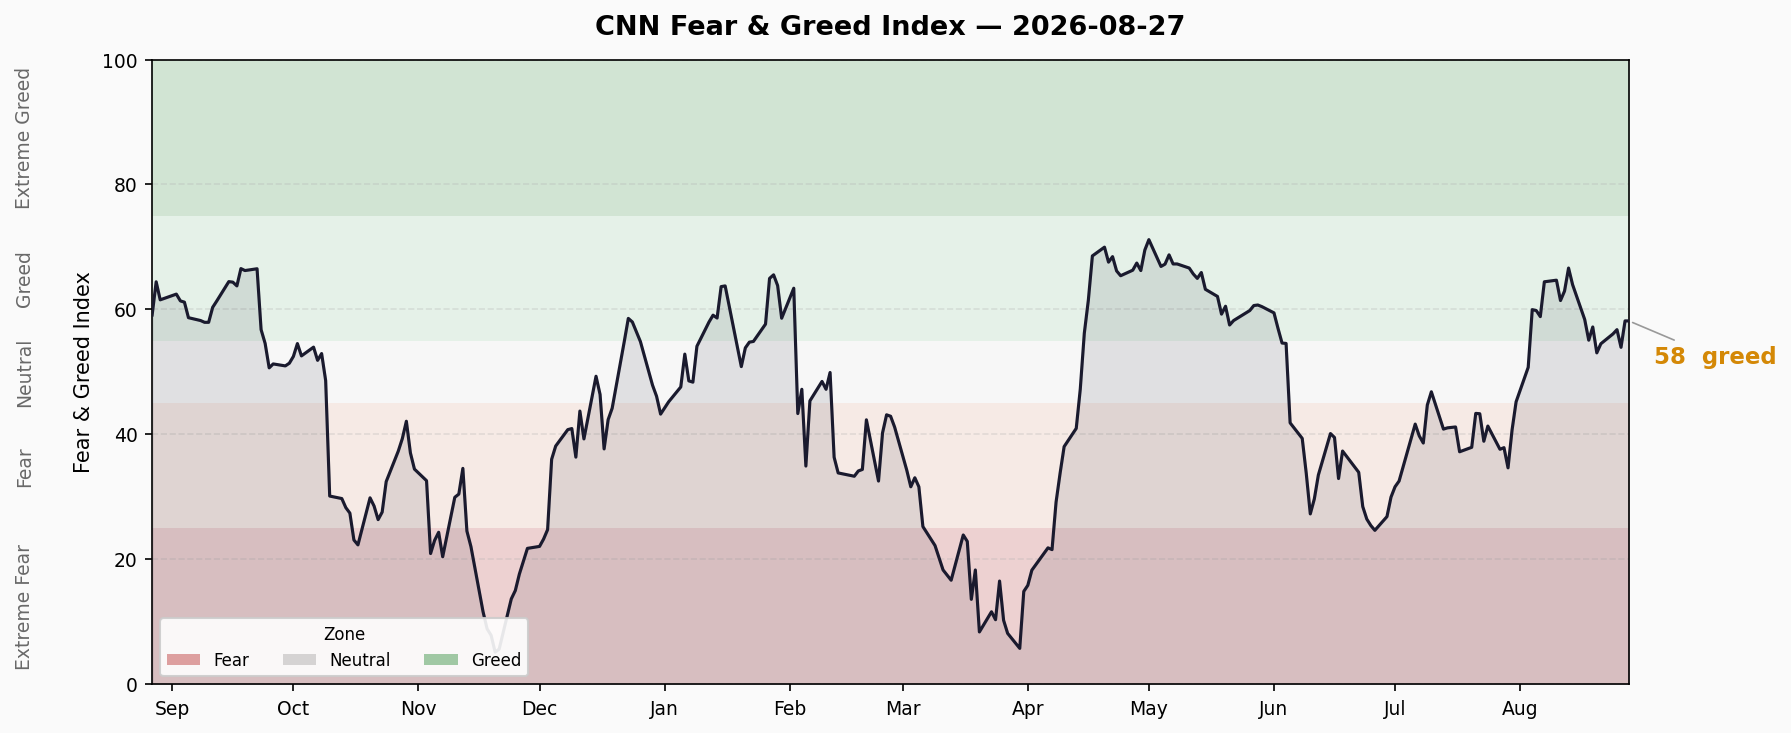
8/27 (Thu) close FNG 58.2 (Greed), +3.0 vs prior 55.2, breaking above the 8/19 high of 57.2 — confirming the 53.1/53.9 double-bottom support, the first valid breakout signal within the pullback channel from the 8/13 peak of 66.6. The rally is driven mainly by Put/Call (81.8, extreme greed, P/C 0.703→0.667 as put protection exits) and Market Momentum (37→44, S&P 500 rebounding to 7,731); Stock Price Strength (28.2, fear) ticked up to 0.441 for the first time after a two-day collapse (0.63→0.44→0.41) — a positive internal signal, yet still in fear zone. Junk Bond Demand (86.8, extreme greed) vs Stock Price Strength (28.2) divergence of 58.6 pts persists for the 9th straight session (narrowed 2.8 from 61.4). Crisis side unchanged: HY OAS 2.67% normal (-3bp), IG OAS 0.80% normal, 10Y-2Y +47bp normal-flat, margin debt July $1.417T MoM -5.7% (🔴 high), ETF inflows YTD $1.23T record (🔴). Total 3🟢/1🟡/2🔴.
Composite Index Overview
- Latest Score: 58.2 — Greed
- Data as of: 8/27 (Thu) close
- Prior Close: 55.2 — Greed (8/26, CNN API prior value; same-day revised history reads 53.9, due to CNN’s daily back-revision)
- Daily Change: +3.0 pts
- Weekly Change: +5.1 pts (vs 53.06 a week ago)
- Monthly Change: +20.5 pts (vs 37.63, in fear zone a month ago)
- Yearly Change: -0.9 pts (vs 59.11)
The composite closed at 58.17 on 8/27, rebounding +3.0 from the prior pullback low. The pullback channel from the 8/13 peak of 66.6 continues, but the 53-level double-bottom (8/20: 53.1, 8/26: 53.9) held, and 8/27 broke decisively above the 8/19 rebound high of 57.2 — the first valid breakout signal within the pullback channel, a preliminary confirmation of double-bottom stabilization. 57.2 now flips from resistance to support; the next resistance sits at 62-64 (the 8/12-8/14 platform).
Last 10 Trading Days
| Date | Score | Rating |
|---|---|---|
| 8/14 | 64.0 | Greed |
| 8/17 | 58.4 | Greed |
| 8/18 | 55.1 | Greed |
| 8/19 | 57.2 | Greed |
| 8/20 | 53.1 | Neutral |
| 8/21 | 54.5 | Neutral |
| 8/24 | 56.1 | Greed |
| 8/25 | 56.8 | Greed |
| 8/26 | 53.9 | Neutral |
| 8/27 | 58.2 | Greed |
Trend: After peaking at 66.6 on 8/13 and pulling back ~13 pts, the index hit 53.1 on 8/20 and oscillated in a 53-57 band for ~5 sessions. 8/26 re-tested 53.9 (second leg of the double bottom), and 8/27 rebounded to 58.2, breaking the 57.2 resistance to confirm the 53.1/53.9 double bottom. Next resistance: 62-64 (8/12-8/14 platform). A loss of 55 would invalidate the rebound and escalate the pullback — near-term bias is constructive, but 57 must hold with volume.
Seven Sub-Indicators Scan
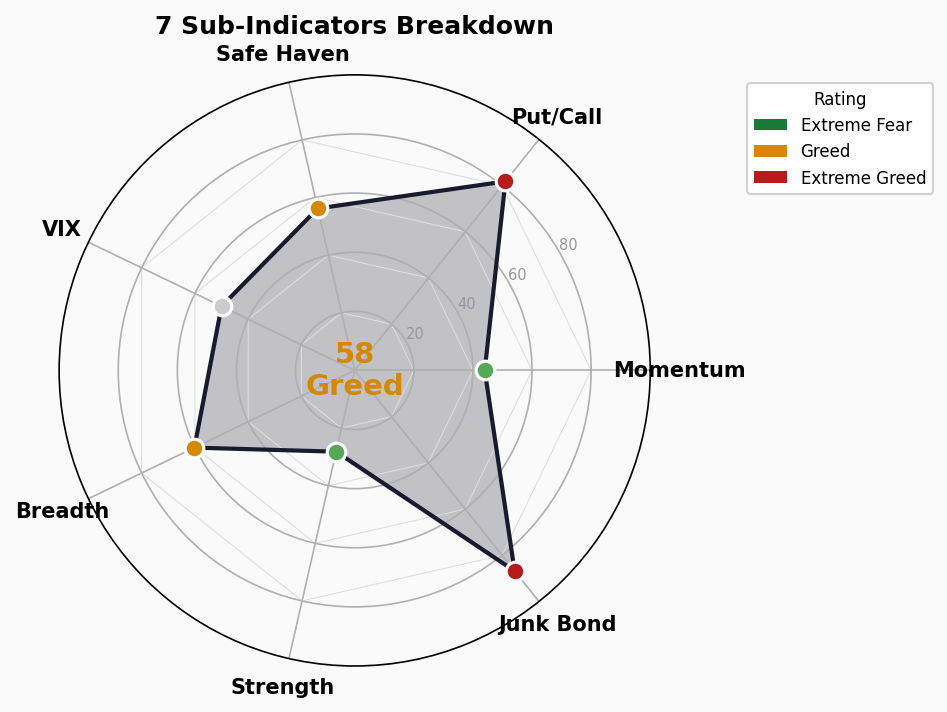
Market Momentum: 44 — Fear
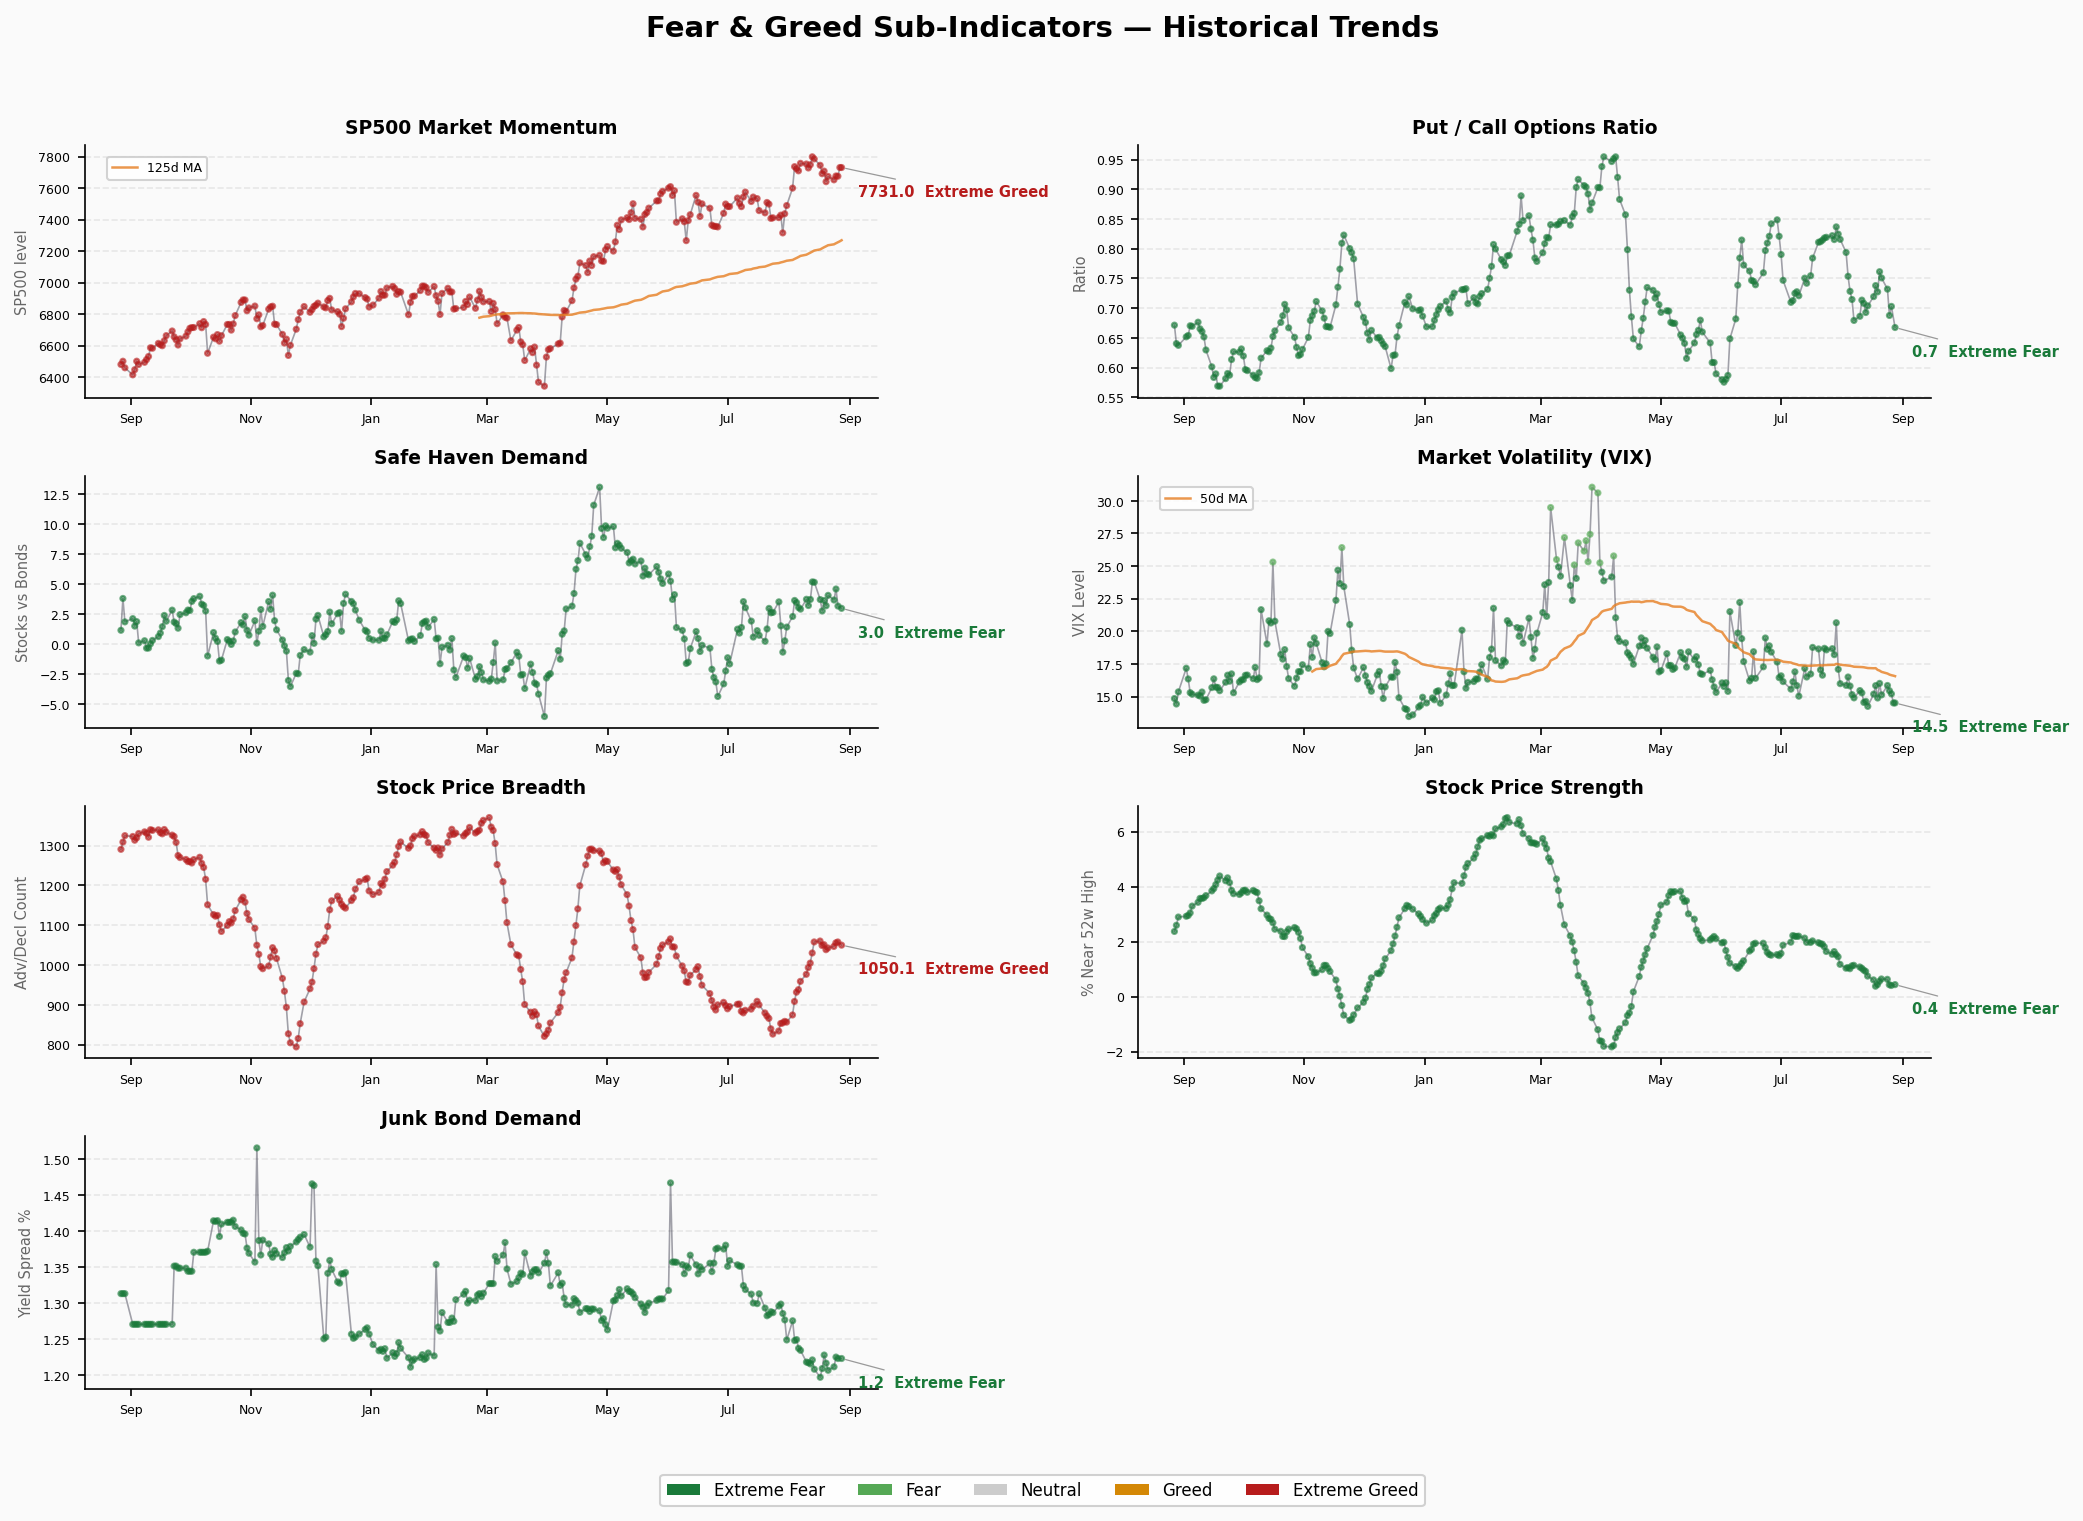
- Raw: S&P 500 @ 7,730.99 (8/27), prior 7,675.70 (8/26), +55.3 (+0.72%)
- Trend: Rebounded (37 → 44, +7)
- Read: First rebound after 6 straight sessions in fear zone; S&P 500 rose 0.72% to 7,731, within striking distance of the 8/13 high of 7,798.99. Momentum reading still in fear zone (<50); CNN’s piecewise weighting stays conservative, so the reading lags the index’s absolute level
Stock Price Strength: 28.2 — Fear
- Raw: 0.441 (share of stocks near 52-week highs, 8/27), prior 0.409 (8/26)
- Trend: Rebounded (0.409 → 0.441, +0.032) — first up-tick after a two-day collapse (0.63→0.44→0.41)
- Read: The “weakest internal link” flagged yesterday stabilized today — a constructive signal for the rebound’s sustainability. But 0.441 remains in fear zone; momentum is “stabilizing,” not yet “strengthening,” and still short of neutral (0.5+). Breadth support is repairing but not yet solid
Stock Price Breadth: 60.2 — Greed
- Raw: 1,050.10 (new highs minus new lows, 8/27), prior 1,058.08 (8/26)
- Trend: Slightly lower (-8.0)
- Read: Fifth straight session in greed zone, but easing off the highs. With strength up and breadth down a touch, the gap (28.2 vs 60.2) is converging — yesterday’s “advance narrowing into a few large caps” concentration concern is easing at the margin
Put/Call Options: 81.8 — Extreme Greed
- Raw: 0.667 (P/C ratio, 8/27), prior 0.703 (8/26)
- Trend: Sharply stronger (63.2 → 81.8, +18.6)
- Read: P/C fell from 0.70 to 0.667 as put-protection buyers exited further; options market flipped to extreme optimism — the biggest single driver of today’s composite rise. With hedging demand at such lows, the market is “unprotected” into the rebound; a turn could produce a faster drawdown
Market Volatility (VIX): 50 — Neutral
- Raw: 14.51 (8/27), prior 15.21 (8/26)
- Trend: Lower (-0.70)
- Read: VIX eased to 14.51, panic pricing remains thin, cushioning the rally. But ultra-low vol also means underpriced tail risk — reinforcing the P/C extreme optimism; the safety buffer is thinner than it looks
Junk Bond Demand: 86.8 — Extreme Greed
- Raw: 1.2235 (HY/IG spread ratio, 8/27), prior 1.2235 (8/26)
- Trend: Flat (88.4 → 86.8, -1.6)
- Read: Sustained extreme greed for many sessions; credit spreads stay ultra-compressed and credit remains the most optimistic corner of the market. Late-cycle characteristics persist — the divergence with weaker internal equity structure (strength 28.2, momentum 44) remains the core contradiction
Safe Haven Demand: 56.2 — Greed
- Raw: 3.00 (stocks vs bonds 20-day excess return, 8/27), prior 3.19 (8/26)
- Trend: Lower (3.19 → 3.00, 59.4 → 56.2, third straight session)
- Read: Stocks’ relative edge over bonds is narrowing for the third straight day, approaching neutral (50) — risk-on cooling at the margin. The index is rising, but relative preference for equities is fading; the quality of this rally is questionable — it reads more like large-cap lifting than broad risk-on
Structural Contradiction Analysis
Core contradiction: Junk Bond Demand extreme greed (86.8) vs Stock Price Strength fear (28.2)
The 58.6-point extreme gap persists for the 9th straight session (narrowed 2.8 from 61.4):
- Fixed income: Spreads compressed to the extreme (HY OAS 2.67% at absolute lows); investors chase credit risk for yield — risk appetite at extremes
- Equities: Index rebounded to 58.2 breaking 57.2, but Stock Price Strength (28.2, fear) and Market Momentum (44, fear) remain in fear zone — the rally is driven by Put/Call (81.8) and falling safe-haven demand, not a broad internal turn
- Historical lesson: Credit bullishness + weakening equity internals is a pattern often seen near tops — credit optimism is usually a lagging signal, and once it turns it magnifies equity drawdowns
New watch point today: questionable rally quality + an “unprotected” market
- The +3.0 composite gain was driven mainly by P/C (63.2→81.8, extreme greed) and momentum (37→44), while Stock Price Strength (28.2) stays in fear and Safe Haven Demand (56.2) approaches neutral
- P/C 0.667 (extreme greed) + VIX 14.51 lows + safe-haven demand fading: risk appetite looks “inflated” while defenses are thin. With put-protection buyers gone and panic pricing weak, a reversal could come faster than expected, lacking the hedging buffer
Positive signal (vs yesterday)
- Stock Price Strength rebounded to 0.441 for the first time after a two-day collapse (0.63→0.44→0.41); the strength-breadth gap (28.2 vs 60.2) is converging — yesterday’s “advance concentrating into a few large caps, real participation shrinking” alarm is easing at the margin
- But strength is still short of neutral (0.5+); breadth support is only half-repaired. Only 2-3 straight sessions above 0.45-0.50 would confirm that individual-stock momentum is genuinely turning
Secondary contradictions:
- Market Momentum (44, fear) vs S&P 500 at 7,731 (within reach of the 7,799 high) → CNN’s piecewise weighting stays conservative; index level decoupled from internal momentum, rally led by weight
- Safe Haven Demand (3.19 → 3.00) falling for the third day → stocks’ excess return over bonds narrowing, risk-on cooling, chasing momentum fading
Trend Assessment
- Zone: Lower edge of the greed band (55-75); 8/27 rallied to 58.2 breaking the key 57.2 resistance; double-bottom (53.1/53.9) support confirmed
- Direction: 8/13 peak 66.6 → 8/20 low 53.1 → 53-57 band for ~5 sessions → 8/26 re-test 53.9 → 8/27 rally 58.2 breaking 57.2. First valid breakout within the pullback channel; near-term constructive, but 57 must hold with volume or the breakout fails
- Key levels to watch:
- 57.2 (8/19 high, now support): resistance above at 62-64 (8/12-8/14 platform) and the 8/13 high of 66.6; support below at 55 and 53.1 (a loss invalidates the double bottom)
- Stock Price Strength (28.2) rebounded but not out of fear — a sustained rally needs strength above 40 (neutral); another rollover would undo the consolidation
- P/C 0.667 (extreme greed) + VIX 14.51 lows: market unprotected, a turn could be fast — the biggest emotional-side fragility point
- Junk Bond Demand (86.8): if it rolls over from highs, a credit-market hawkish turn magnifies the drawdown — the biggest single-point risk
- Today (US 8/28 12:30 EDT) FINRA releases August margin debt — if deleveraging continues (July -5.7% MoM), combined with high margin debt ($1.417T) and record passive flows (YTD $1.23T), systemic fragility is not resolved
- Historical context: A month ago (37.63) was in fear zone; this 20.5-point rebound has essentially retraced the mid-July drawdown (66→42). Credit easing + record passive flows underpin the market. But high margin debt + weak internals (strength/momentum in fear) mean the rebound’s base is not solid — breaking 57.2 is only step one; holding 62+ is needed to confirm a reversal
🚨 Stock-Market Crash Precursor Dashboard
1. Credit Spreads
- High-Yield OAS: 2.67% | 🟢 Normal (<3% normal | 3-5% caution | 5-8% panic | >8% crisis)
- Investment-Grade OAS: 0.80% | 🟢 Normal
- Trend: Slightly lower (8/26 data, HY 2.70%→2.67% -3.0bp, IG 0.81%→0.80% -1.0bp), staying low
- Note: The FNG Junk Bond Demand sub-indicator (86.8, extreme greed) reflects ultra-compressed spreads, consistent with the absolute low level — credit remains the most optimistic corner of the market
2. Yield Curve
- 10Y-2Y Spread: +47bp | 🟢 Normal-flat (not inverted)
- 10Y: 4.66% | 2Y: 4.19% | 30Y: 5.18%
- 10Y-30Y: -52bp (30Y above 10Y, normal upward slope at the long end)
- Trend: Yields ticked up ~2bp (prior 10Y 4.64%/2Y 4.17%/30Y 5.17%); curve shape stable, no inversion pressure
3. Margin Debt (FINRA)
- Latest: $1.417T (July 2026, FINRA official)
- MoM: -$85B (-5.7% from the June record $1.502T, second straight monthly decline)
- YoY: +38.6% (vs July 2025 $1.022T)
- Status: 🔴 Still at historical-high levels
- Read: After the $1.502T record in June, July eased to $1.417T — the leverage amplifier is cooling but remains elevated. August data is released today (US 8/28 12:30 EDT) by FINRA — a continued decline would confirm the start of a deleveraging cycle, pressuring crowded leveraged trades
4. IPO Market
- 2026 YTD: 93 IPOs (Renaissance Capital, ≥$50mm market cap)
- Proceeds: ~$144.0B (+631% YoY; SpaceX $75B largest-ever IPO + SK hynix $26.5B + CXMT $8.5B carry the bulk)
- Status: 🟡 Active but not frothy by count (IPO count -24.4% YoY, proceeds driven by outliers); August in summer pause, calendar expected to re-accelerate after Labor Day in September
5. ETF Fund Flows
- 2026 YTD Net Inflows: US-listed $1.23T (through July, ETFGI), +$193.4B in July alone, 51st consecutive month of positive inflows
- Compare: Far above the 2025 full-year record of $678B; total assets $15.74T at an all-time high (end of July)
- Status: 🔴 Record inflows (State Street projects $2.3T for the full year)
- Read: Persistent passive inflows layered on still-elevated margin debt concentrate systemic risk — a reversal could trigger a stampede
Summary
- 🟢 Normal: 3 (HY OAS, IG OAS, yield curve)
- 🟡 Caution: 1 (IPO market)
- 🔴 Risk: 2 (margin debt, ETF inflows)
Bottom line: Credit spreads and the yield curve remain healthy; no new deterioration on the crisis side. FNG closed 8/27 at 58.2 (Greed), +3.0 on the day, breaking above the 8/19 high of 57.2 — double-bottom support confirmed, first valid breakout within the pullback channel. Internals improved at the margin: Stock Price Strength (28.2) rebounded for the first time after a two-day collapse (0.409→0.441), narrowing the strength-breadth gap. But the composite gain was driven mainly by Put/Call (81.8, extreme greed) and Market Momentum (44); strength (28.2) and momentum (44) remain in fear — the rally is pulled by large caps and options optimism, while breadth support and individual-stock momentum have yet to fully turn. The Junk Bond Demand (86.8) vs Stock Price Strength (28.2) divergence of 58.6 pts persists for the 9th session (narrowed 2.8 from 61.4). Watch 62-64 above and 55/53.1 below; today’s FINRA August margin-debt release is the near-term focus — continued deleveraging on top of high margin debt ($1.417T) and record passive flows (YTD $1.23T) could make any drawdown more violent than expected.