CNN Fear & Greed Sentiment Analysis 2026-08-27
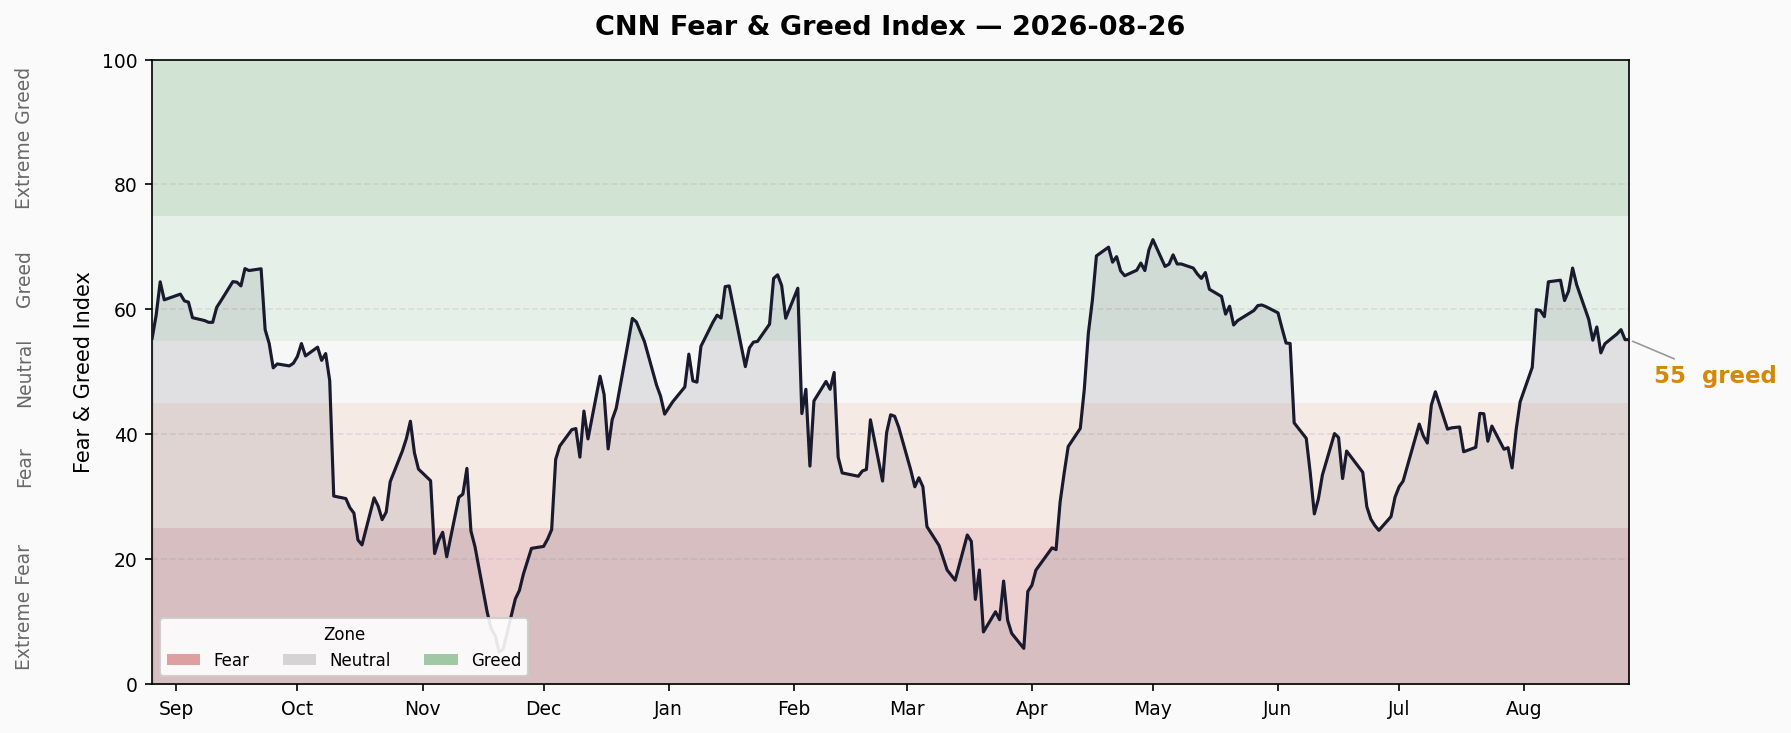
8/26 (Wed) close FNG 55.2 (Greed), down 3.6 pts from prior 58.8 (CNN same-date historical series shows 8/25=56.8; readings are subject to daily retroactive revisions). The 8/19 high of 57.2 was not reclaimed and support at 55 is being tested again. New deterioration inside the structure: Stock Price Strength (27, Fear) broke down for a 2nd consecutive day (0.63→0.44→0.41, % of stocks near 52-week highs contracting 0.22 in two days) while Breadth (61.4) strengthened — new highs held but the share of stocks near highs collapsed, concentration into a few mega-caps is accelerating. Junk Bond Demand 88.4 (Extreme Greed) vs Stock Price Strength 27 gap of 61.4 pts persists for an 8th trading day (narrowing 3 pts from 64.4). Crisis side unchanged: HY OAS 2.70% normal, IG OAS 0.81% normal, 10Y-2Y +47bp normal, margin debt Jul $1.417T -5.7% MoM (🔴 elevated), ETF inflows YTD $1.23T record (🔴). Composite 3🟢/1🟡/2🔴.
Composite Index Overview
- Latest Score: 55.2 — Greed
- Data As Of: 8/26 (Wed) close
- Previous Close: 58.8 — Greed (8/25, CNN API prior value; same-date historical series reads 56.8 due to CNN daily retroactive revisions)
- Daily Change: -3.6 pts
- Weekly Change: -2.0 pts (vs 57.2 on 8/19)
- Monthly Change: +13.8 pts (vs 41.34, one month ago in Fear zone)
- Yearly Change: -0.2 pts (vs 55.4)
The composite closed at 55.17 on 8/26, retreating from the prior rebound high. The downtrend channel since the 8/13 peak of 66.6 remains unbroken, with sentiment oscillating in a 53-57 band for roughly 6 sessions. 8/25 probed 56.8 but the 8/19 rebound high of 57.2 was never reclaimed, and 8/26 slipped back to the 55 line — 55 and 53.1 are the key supports, 57.2 the key resistance.
Last 10 Trading Days
| Date | Score | Rating |
|---|---|---|
| 8/14 | 64.0 | Greed |
| 8/17 | 58.4 | Greed |
| 8/18 | 55.1 | Greed |
| 8/19 | 57.2 | Greed |
| 8/20 | 53.1 | Neutral |
| 8/21 | 54.5 | Neutral |
| 8/24 | 56.1 | Greed |
| 8/25 | 56.8 | Greed |
| 8/26 | 55.2 | Greed |
Trend: After peaking at 66.6 on 8/13 and pulling back roughly 13 pts, the index has ranged 54-57 for four sessions since the 8/20 low of 53.1. The 8/25 rebound to 56.8 failed at 57.2 and 8/26 slipped to 55.2. A break above 57.2 confirms a double-bottom rebound; a loss of 53.1 escalates the pullback — still a narrow consolidation ahead of direction selection.
Seven Sub-Indicator Scan
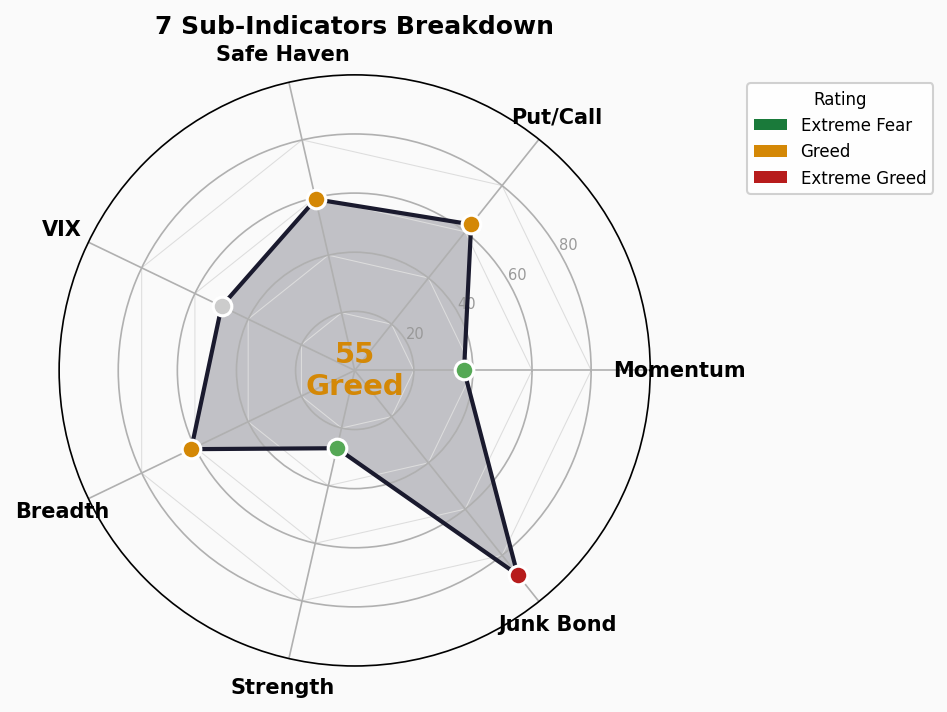
Market Momentum: 37 — Fear
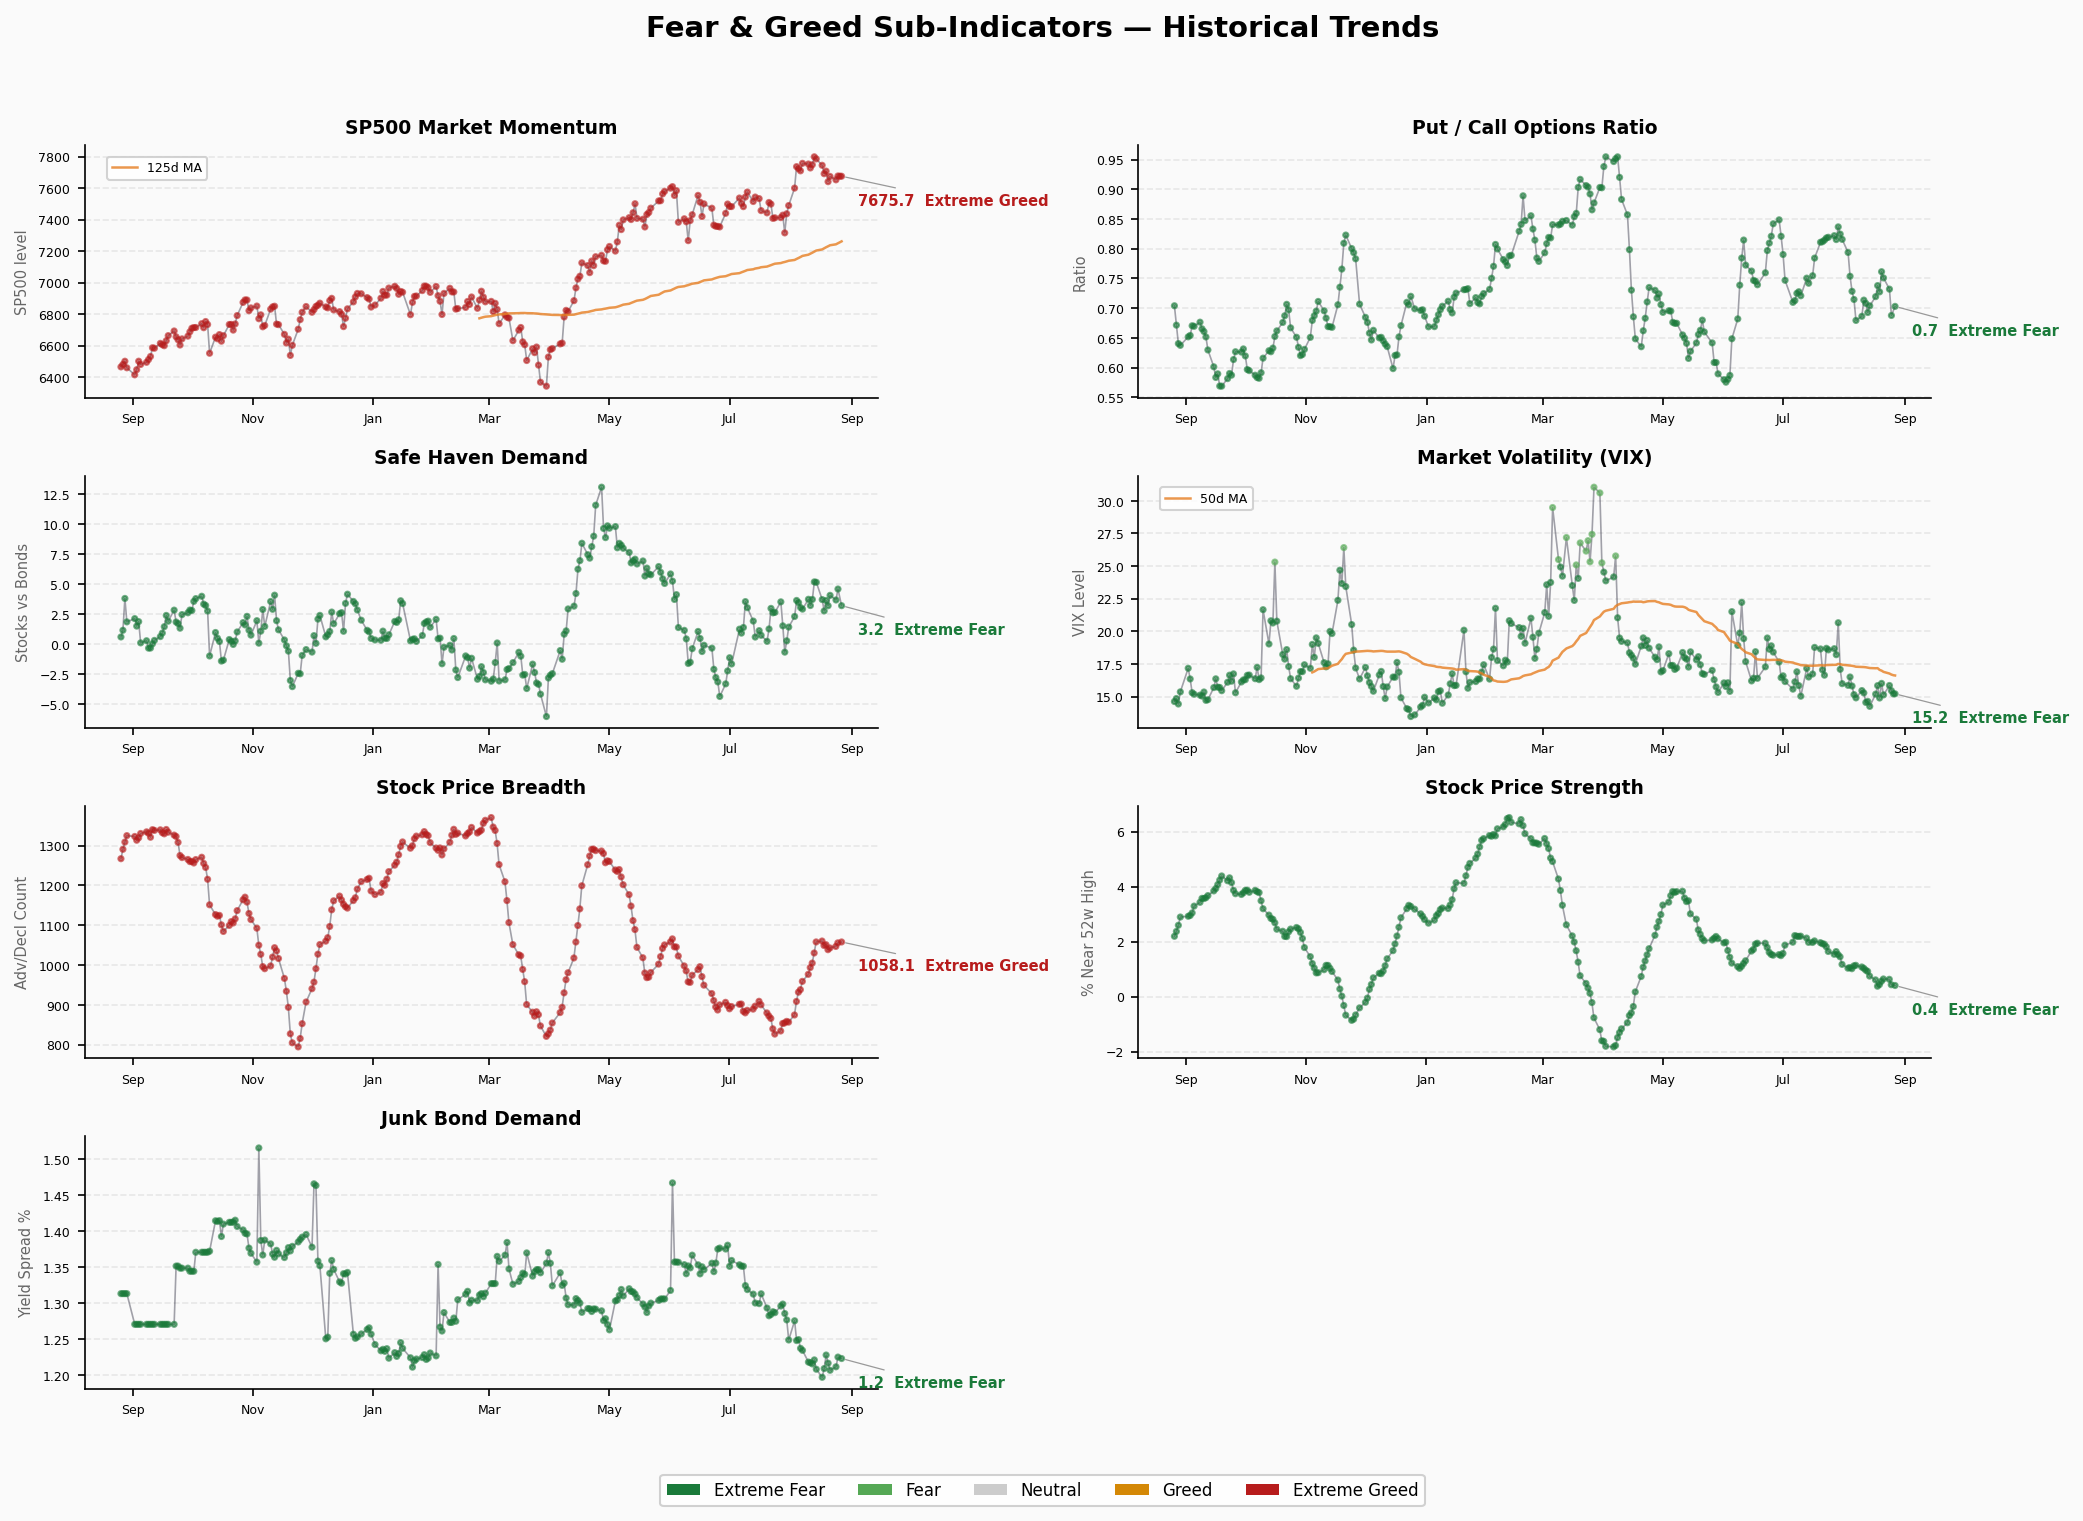
- Raw value: S&P 500 @ 7,675.70 (8/26), prior 7,677.28 (-1.6)
- Direction: flat-to-lower
- Note: Sixth straight session in the Fear zone (35.8-37.0), in tension with the index’s absolute level (still near its 125-day MA) — the CNN piecewise weighting is conservative; read alongside the price level
Stock Price Strength: 27 — Fear
- Raw value: 0.41 (% of stocks near 52-week highs, 8/26), prior 0.44 (8/25)
- Direction: accelerating decline, 2nd consecutive day (0.63 → 0.44 → 0.41, -0.22 over two days)
- Note: The weakest component of this structure and today’s key deterioration. The share of stocks near 52-week highs shrank sharply over two days — the index holds up but underlying breadth of individual names is clearly weakening
Stock Price Breadth: 61.4 — Greed
- Raw value: 1,058.08 (new highs minus new lows, 8/26), prior 1,055.80 (8/25)
- Direction: higher (+2.3)
- Note: Breadth up for a 4th straight session into Greed territory, market participation recovering. But new-high counts held while the share of stocks near highs collapsed — gains are concentrating into a few mega-caps, and the breadth reading masks this rising internal concentration
Put/Call Options: 63.2 — Greed
- Raw value: 0.70 (P/C ratio, 8/26), prior 0.69 (8/25)
- Direction: roughly flat
- Note: P/C holds at a low 0.70, scarce put-hedging demand, options market leaning bullish with no panic signals
Market Volatility (VIX): 50 — Neutral
- Raw value: 15.21 (8/26), prior 15.45 (8/25)
- Direction: lower (-0.24)
- Note: VIX at low 15.21, thin panic pricing, buffer intact for the index’s elevated range
Junk Bond Demand: 88.4 — Extreme Greed
- Raw value: 1.22 (HY/IG spread ratio, 8/26), prior 1.23 (8/25)
- Direction: slightly lower
- Note: Easing a bit from the 8/24 high of 94.2 but still Extreme Greed with credit spreads at extreme compression. Credit market risk appetite undiminished, in sharp divergence from weak equity internal momentum — late-cycle signature persists, credit remains the most bullish corner
Safe Haven Demand: 59.4 — Greed
- Raw value: 3.23 (stock vs bond 20-day excess return, 8/26), prior 4.61 (8/25)
- Direction: lower (4.61 → 3.23)
- Note: Equity’s relative edge over bonds narrowed markedly, sub-index down from 66.6 to 59.4 and approaching neutral — risk-on cooling at the margin but still in Greed territory
Structural Contradiction Analysis
Core contradiction: Junk Bond Demand Extreme Greed (88.4) vs Stock Price Strength Fear (27)
The 61.4-pt extreme gap persists for an 8th consecutive trading day (narrowing 3 pts from 64.4):
- Fixed income market: spreads compressed to the limit (HY OAS 2.70% at an absolute low), investors chasing credit risk for yield, risk appetite extreme
- Equity market: index consolidating at the 55 line, but Stock Price Strength (27, Fear) is accelerating lower and Market Momentum (37, Fear) stays in Fear — only Breadth (61.4) is firm; strength and momentum lag
- Historical lesson: credit not bearish while equity internal momentum weakens — such dislocation historically appears near tops; credit’s optimism is often a lagging signal, and its turn would amplify equity drawdowns
New deterioration (today’s focus): Price Strength collapse vs Breadth strength
- The % of stocks near 52-week highs contracted from 0.63 to 0.41 in two days (-0.22), while the new-highs-minus-new-lows spread (breadth) rose from 1,046.8 to 1,058.08
- Implication: gains are accelerating into a few mega-caps while most stocks have left their 52-week highs. Breadth reads “strong” but true participation is shrinking — the index’s high-level consolidation is costing internal structure
- If strength keeps sliding, the index range is unlikely to hold, and drawdowns would first unfold at the single-stock level
Secondary contradictions:
- Market Momentum reading (37, Fear) vs the index’s absolute level — conservative piecewise weighting
- Safe Haven Demand (4.61 → 3.23) fell fast over two days — equity’s excess return vs bonds narrowing, risk-on cooling, chasing momentum fading
- Junk Bond Demand (94.2 → 88.4) cooled from the top but still above the Extreme Greed threshold
Trend Assessment
- Zone: lower edge of Greed (55-75), oscillating in a 53-57 band for ~6 sessions
- Direction: peaked 66.6 on 8/13, low 53.1 on 8/20, rebound to 56.8 on 8/25 failed at 57.2, slipped to 55.2 on 8/26. Failing upside + deteriorating internal strength → short-term odds tilt lower; a loss of 55 tests 53.1
- Key levels to watch:
- 57.2 (8/19 rebound high): break confirms double-bottom, rebound extends; below 53.1 escalates the pullback
- Stock Price Strength (27) collapsing two days running — if it continues on 8/27, the index range won’t hold; the most important signal this cycle
- Junk Bond Demand (88.4) rolling over from highs would mark credit turning hawkish and amplify drawdowns — the largest single-point risk
- VIX (15.21) low + P/C (0.70) still bullish — sentiment buffer intact
- Historical comparison: one month ago (41.3) in Fear, this cycle rebounded from Fear to the 66.6 peak then settled at 55 — the sentiment center is still above last month. Easy credit + passive inflows (ETF YTD $1.23T record) provide support, but elevated margin debt ($1.417T) + internal concentration keep fragility unresolved. Tomorrow (8/28) FINRA releases August margin debt; if deleveraging continues (Jul -5.7% MoM), the pullback magnitude would follow the mid-July episode (66→42)
🚨 Crash Precursor Indicator Dashboard
1. Credit Spreads
- High-Yield OAS: 2.70% | 🟢 Normal (<3% normal | 3-5% caution | 5-8% panic | >8% crisis)
- Investment-Grade OAS: 0.81% | 🟢 Normal
- Trend: Stable (8/25 data, HY 2.70%, IG 0.81%, holding low levels)
- Note: The FNG Junk Bond Demand sub-index (88.4, Extreme Greed) confirms extreme spread compression consistent with the low absolute levels — credit remains the most optimistic corner
2. Yield Curve
- 10Y-2Y Spread: +47bp | 🟢 Normal-flat (not inverted)
- 10Y: 4.64% | 2Y: 4.17% | 30Y: 5.17%
- 10Y-30Y: -53bp (30Y above 10Y, normal upward long-end slope)
- Trend: Curve shape stable, no inversion pressure
3. Margin Debt (FINRA)
- Latest: $1.417T (July 2026, FINRA)
- MoM: -$85B (-5.7% from the June record $1.502T, second consecutive month down after three straight gains)
- YoY: +38.6% (vs $1.022T in July 2025)
- Status: 🔴 Still historically elevated
- Note: After the June record of $1.502T, July fell to $1.417T — the leverage amplifier cooled but remains high. August data releases 8/28 (tomorrow); continued declines would be an early signal of a deleveraging cycle starting, pressuring crowded leveraged trades
4. IPO Market
- 2026 YTD: 93 IPOs (Renaissance Capital, latest available)
- Proceeds: ~$144.0B (+631% YoY; SpaceX $75B largest-ever IPO + SK hynix $26.5B carry the bulk)
- Status: 🟡 Active but count not frothy (IPO count -24.4% YoY, proceeds driven by outliers); summer pause in August, calendar expected to revive after Labor Day
5. ETF Fund Flows
- 2026 YTD ETF net inflows: US-listed $1.23T (through end-July, ETFGI; crossed $1T in H1, a first-half record)
- Comparison: Far above the full-year 2025 record of $678B; June +$196B was the 2nd-best month ever, July marked a 51st straight month of inflows
- Status: 🔴 Record fund inflows (State Street projects $2.3T for the year)
- Note: Passive flows pouring in atop elevated margin debt — systemic risk building; a reversal could trigger a stampede
Composite Assessment
- 🟢 Normal: 3 (HY OAS, IG OAS, yield curve)
- 🟡 Caution: 1 (IPO market)
- 🔴 Risk: 2 (margin debt, ETF inflows)
Summary: Credit spreads and the yield curve stay healthy; no new deterioration on the crisis side. FNG closed at 55.2 (Greed) on 8/26, down 3.6 pts, with the 8/19 high of 57.2 not reclaimed and support at 55 under renewed pressure. Internal structure shows new deterioration: Stock Price Strength (27, Fear) broke down two days running (0.63→0.41) while Breadth (61.4) firmed — gains concentrating into mega-caps with true participation shrinking, the most urgent signal to watch. The 61.4-pt gap between Junk Bond Demand (88.4) and Price Strength (27) persists an 8th session (narrowing 3 pts from 64.4). The 57.2 / 53.1 levels are the two direction-defining watersheds; tomorrow’s (8/28) FINRA August margin debt release is the near-term focus — continued deleveraging atop elevated margin ($1.417T) and record passive inflows (YTD $1.23T) could make the drawdown more violent than expected.