CNN Fear & Greed Analysis 2026-08-24
Pre-market Monday snapshot; FNG data still frozen at the 8/21 (Fri) close of 55.2 (Greed) — no new session over the weekend through Monday pre-market. Today's US open (9:30 ET / 21:30 Beijing) will produce the first fresh data point and test whether the 55 line holds. The internal structural divergence persists: Junk Bond Demand 95.8 (Extreme Greed) vs Stock Price Strength 29.4 (Fear) — a 66.4-point gap for the 6th trading session. Crisis-signal side unchanged: HY OAS 2.75% (8/20) normal, 10Y-2Y +50bp normally steep, margin debt $1.417T in July with the first -5.7% MoM decline (red/high zone), ETF inflows at a record $1.23T YTD (red). Composite 3 green / 1 yellow / 2 red.
Composite Index Overview
- Latest score: 55.2 — Greed
- Data as of: 8/21 (Fri) close — pre-market Monday snapshot, no new session over the weekend; identical to the prior Saturday report
- Prior close: 53.1 — Neutral (8/20)
- Daily change: +2.1
- Weekly change: -8.8 (vs 63.97 on 8/14)
- Monthly change: +11.8 (vs 43.37, still above last month’s fear zone)
- Yearly change: +2.6 (vs 52.60)
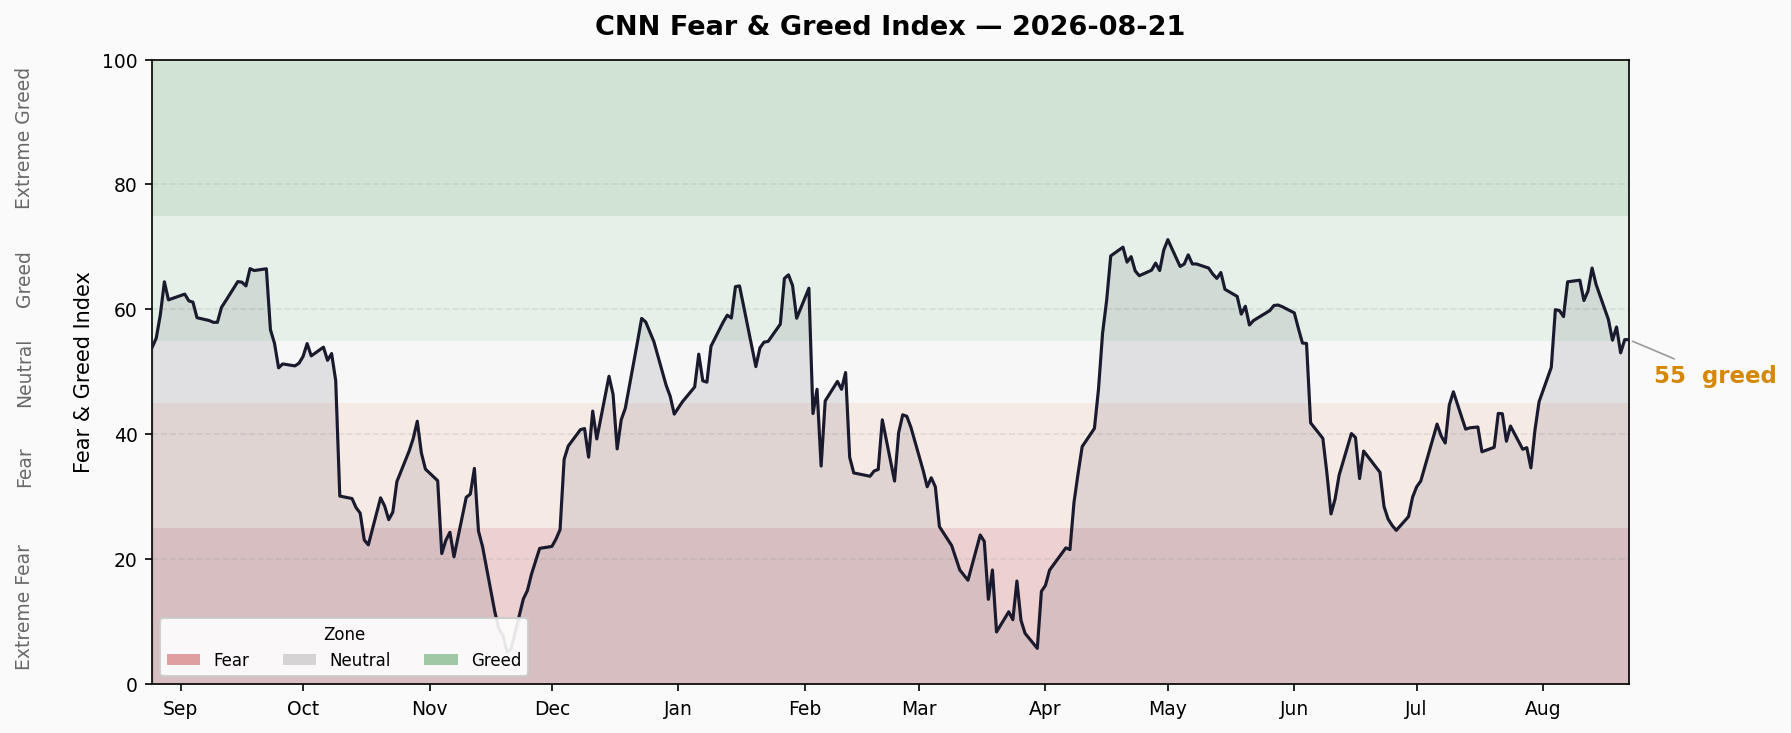
The composite closed at 55.2 on 8/21, back above the lower edge of the Greed zone. The drawdown from the 8/13 peak of 66.6 has not been broken, but the index has held above 55 for two consecutive sessions after hitting 53.1 on 8/20. This is a pre-market Monday snapshot: data is frozen at the 8/21 close, and the first fresh data point from today’s US open (9:30 ET) will decide whether stabilization holds — whether the 55 line is defended is the week’s first line in the sand.
Last 10 Trading Days
| Date | Score | Rating |
|---|---|---|
| 8/11 | 61.4 | Greed |
| 8/12 | 62.9 | Greed |
| 8/13 | 66.6 | Greed |
| 8/14 | 64.0 | Greed |
| 8/17 | 58.4 | Greed |
| 8/18 | 55.1 | Greed |
| 8/19 | 57.2 | Greed |
| 8/20 | 53.1 | Neutral |
| 8/21 | 55.2 | Greed |
Trend: After peaking at 66.6 on 8/13, the index fell ~13 points, hit a swing low of 53.1 on 8/20, then rebounded +2.1 to 55.2. The rebound high (55.2) still sits below 8/19’s 57.2, so the downtrend channel is not yet broken — this is “testing stabilization,” not a reversal. Data is frozen until Monday’s open, which will verify whether the 55 line is defended.
Seven Sub-Indicators
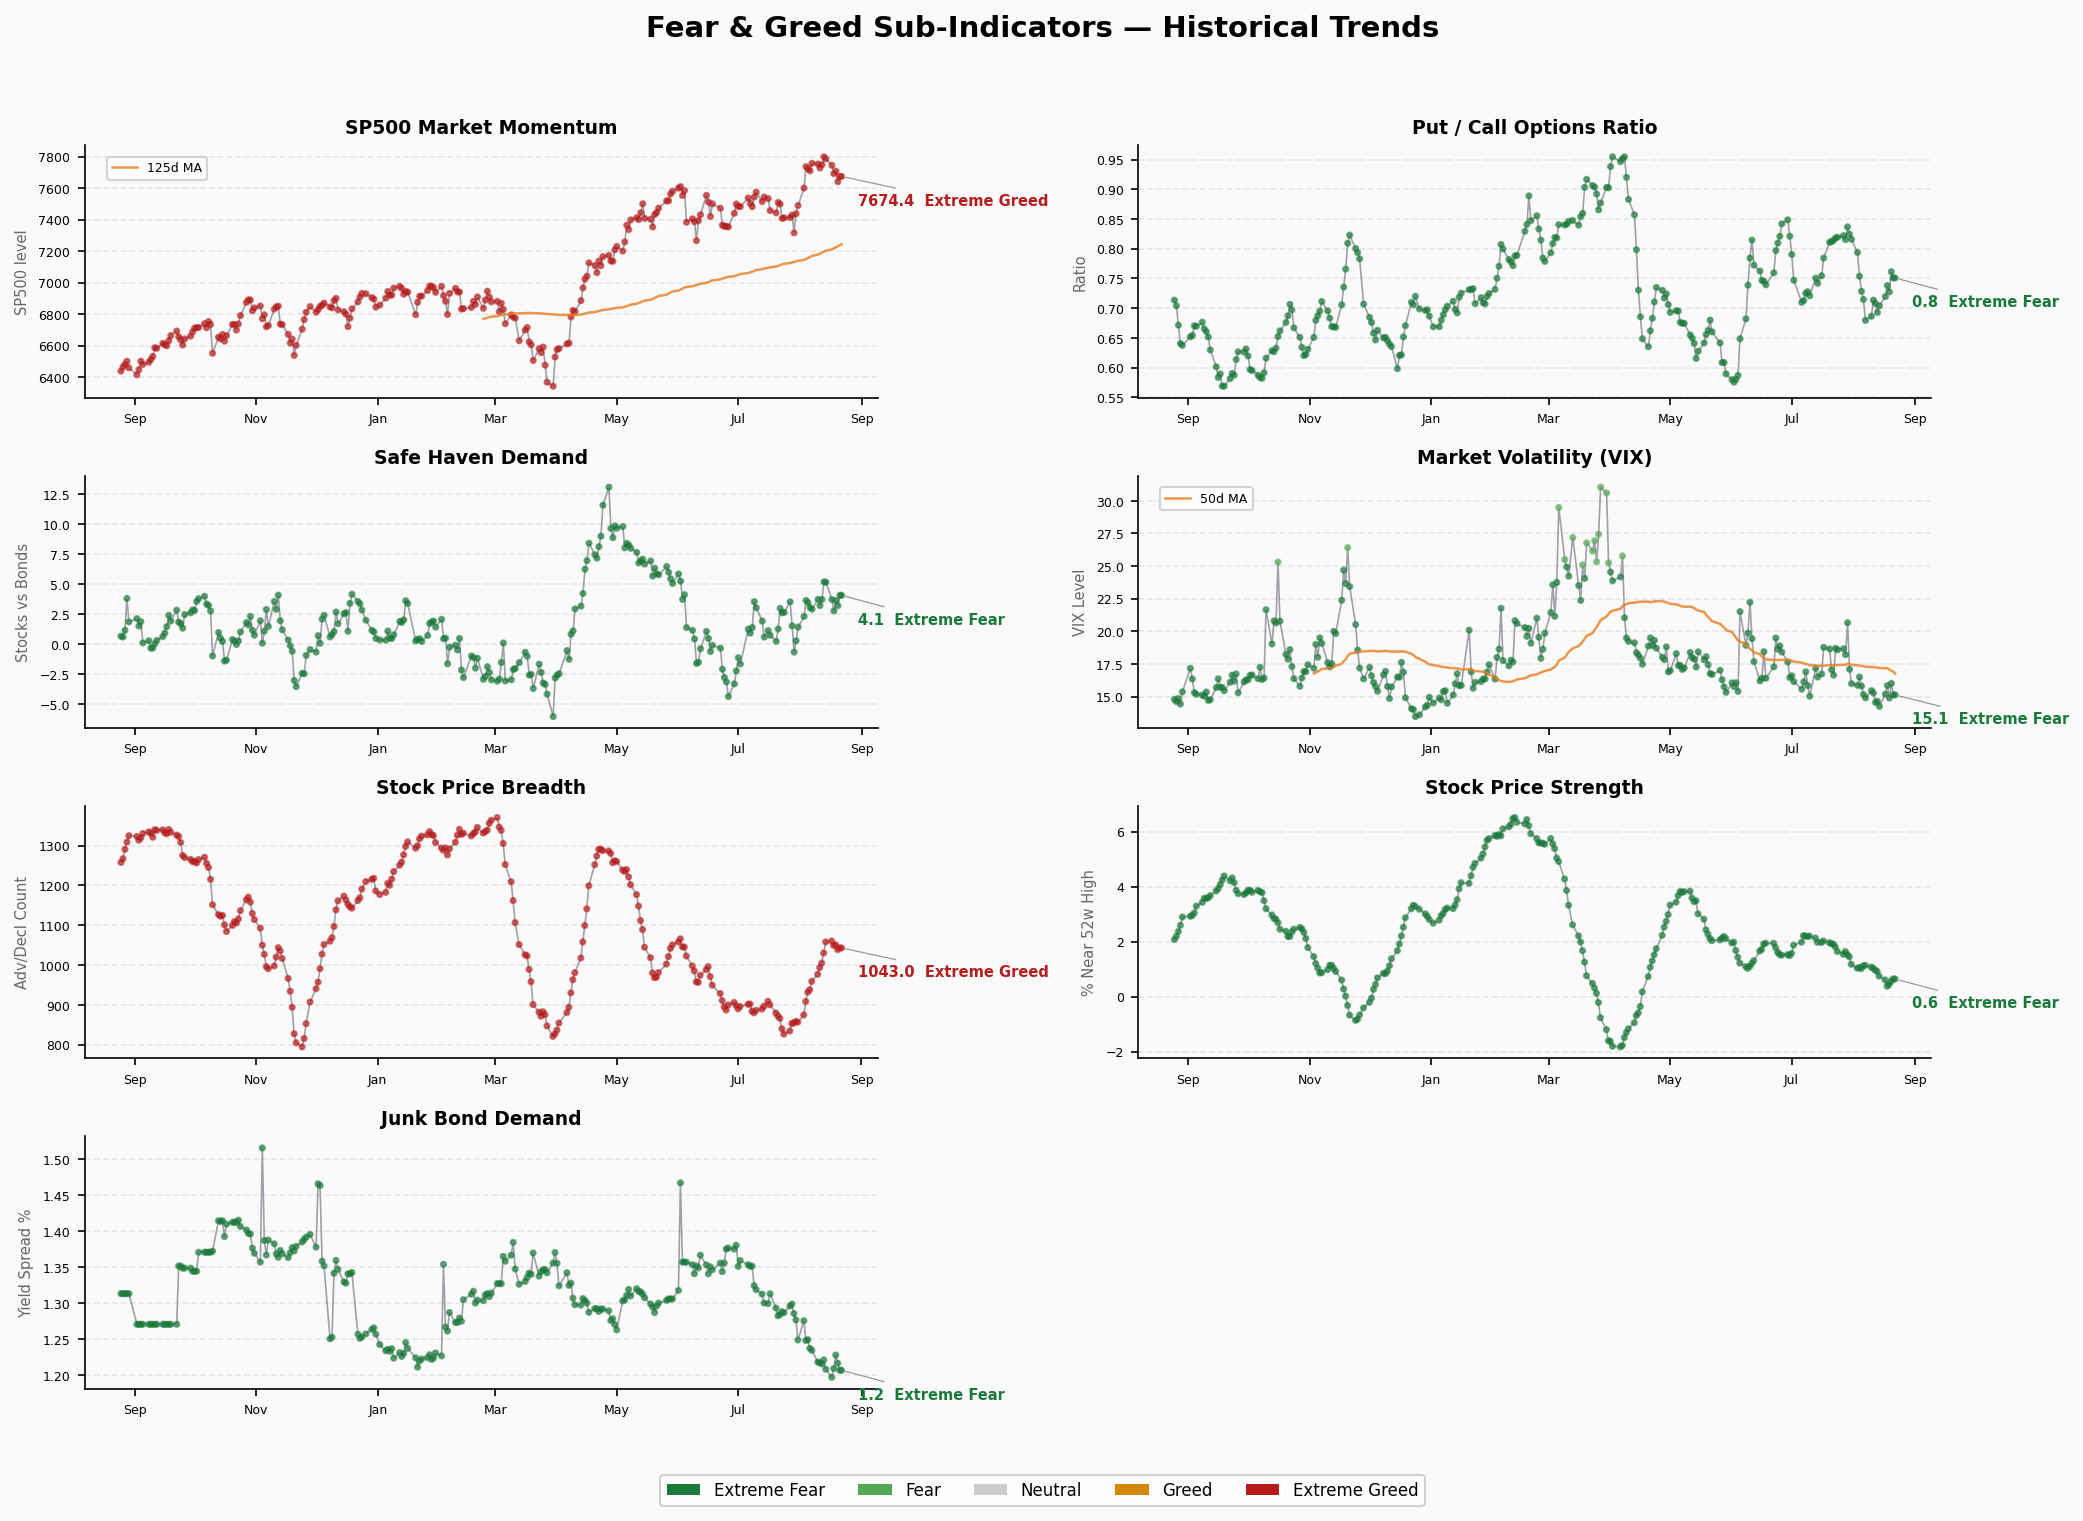
Market Momentum: 39 — Fear
- Raw: S&P 500 @ 7,674.37 (8/21), prior 7,641.16 (+33.2)
- Direction: index edging higher; sub-score stuck at 39 for the 3rd session
- Read: Index is ~6% above its 125-day MA, yet CNN’s reading stays conservative — the segment-weighted formula over-weights recent drawdown. Don’t over-read the single point.
Stock Price Strength: 29.4 — Fear
- Raw: 0.646 (share of stocks near 52-week highs, 8/21)
- Direction: rising (0.562 → 0.646)
- Read: Net-new-highs ratio improving for a 4th session, but absolute level remains low and the score stays in Fear (<30) — the index rebound has not fully transmitted to market breadth.
Stock Price Breadth: 57.6 — Greed
- Raw: 1,043.0 (net advancers vs decliners above 50-day MA, 8/21)
- Direction: rising (1,038.7 → 1,043.0)
- Read: Advancing-name advantage widening modestly; breadth up a 2nd session and holding Greed, improving in sync with price strength — the most solid leg of this rebound.
Put/Call Options: 43.4 — Fear
- Raw: 0.750 (P/C ratio, 8/21)
- Direction: falling (0.761 → 0.750)
- Read: Put hedging demand easing slightly; options market thawing but still in Fear — hedging pressure is abating but not gone.
Market Volatility (VIX): 50 — Neutral
- Raw: 15.13 (8/21)
- Direction: falling (16.01 → 15.13)
- Read: VIX back near 15; volatility regime is benign, no obvious panic pricing — supportive of an extended rebound.
Junk Bond Demand: 95.8 — Extreme Greed
- Raw: 1.207 (HY/IG spread ratio, 8/21)
- Direction: marginally lower (1.217 → 1.207)
- Read: Credit spreads remain extremely compressed, risk appetite stays high, diverging sharply from equity-side momentum — a late-cycle signature; credit remains the most optimistic corner.
Safe Haven Demand: 71 — Greed
- Raw: 4.08% (20-day stock vs bond excess return, 8/21)
- Direction: rising (3.22 → 4.08)
- Read: Stocks’ advantage over bonds widening; no defensive rotation yet, risk appetite recovering — supports the risk-on view.
Structural Contradiction Analysis
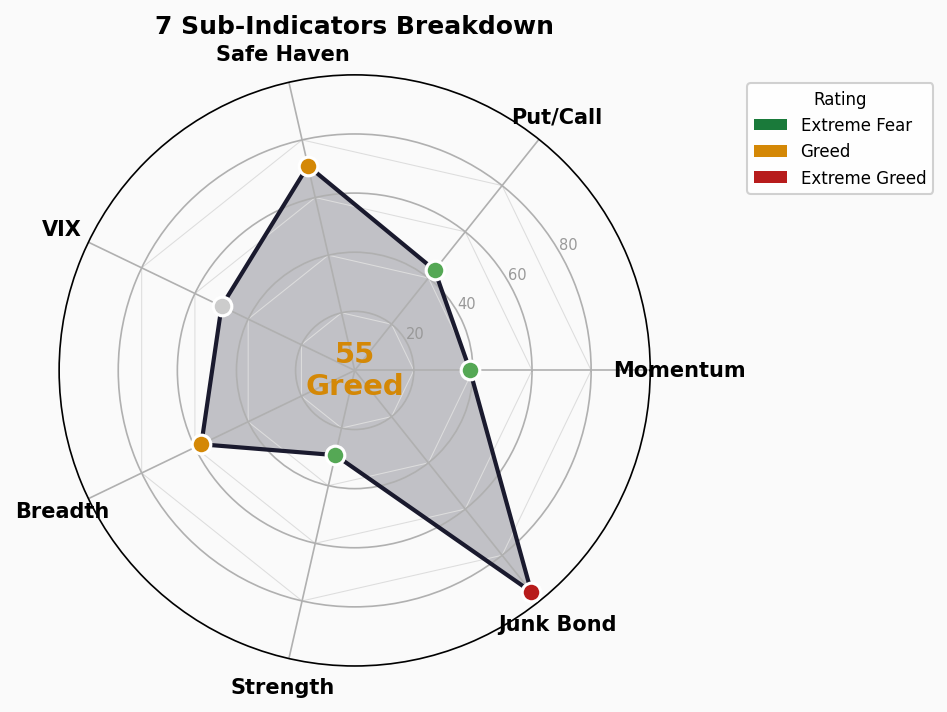
Core contradiction: Junk Bond Demand Extreme Greed (95.8) vs Stock Price Strength Fear (29.4)
The extreme 66.4-point gap persists for the 6th consecutive trading session (no new session over the weekend, count unchanged):
- Fixed income: Spreads compressed to the extreme (HY OAS 2.75% at absolute lows); investors chase credit risk for yield, risk appetite is extreme.
- Equities: Index back at the lower edge of Greed, but Stock Price Strength (29.4) and Market Momentum (39) remain in Fear — Breadth (57.6) is repairing, Strength has not caught up.
- Historical lesson: Credit not bearish while equity internal momentum is weak — this mismatch historically appears near tops. Credit optimism tends to be a lagging signal; if it flips, it can amplify equity drawdowns.
Secondary contradictions:
- Market Momentum reading (39, Fear) vs the index’s actual position (~6% above the 125-day MA) — CNN’s segment weighting for this sub-indicator is conservative; read it alongside price.
- Stock Price Strength (29.4) and Breadth (57.6) divergence is converging: Strength up 4 sessions, Breadth up 2 sessions, internals repairing — but Strength still in Fear, so the rebound still needs breadth→strength confirmation.
- Safe Haven Demand (71) stays Greedy and VIX fell to 15 — a risk-on + low-vol combination favors the short term, but it is also sentiment re-aggregation; the top-region tug-of-war is not resolved.
Trend Assessment
- Zone: Back at the lower edge of the Greed zone (55-75), out of Neutral.
- Direction: Peaked at 66.6 on 8/13, hit a low of 53.1 on 8/20, rebounded +2.1 to 55.2 on 8/21. This rebound looks better than 8/19’s: breadth, strength, put/call and safe-haven demand all improved and VIX fell. But the rebound high has not broken 57.2, so it remains inside the downtrend channel — “testing stabilization,” not a reversal.
- Key levels to watch:
- 57.2 (8/19 rebound high): a break today confirms a double-bottom stabilization; otherwise it is still a rebound within the downtrend channel.
- Junk Bond Demand (95.8): if it rolls over from this high, a hawkish turn in credit would amplify drawdowns — the single biggest point risk.
- Stock Price Strength (29.4) still in Fear — breadth has led the repair; strength needs to follow to confirm rebound quality.
- Historical comparison: One month ago (43.37) was in the fear zone; this cycle rebounded from fear to a 66.6 peak, then fell back to 53.1 and returned to 55.2 — the sentiment center is still above last month, supported by credit easing and passive flows, but leverage and dispersion are both elevated. This is a pre-market Monday snapshot; if the first monthly margin-debt decline (see dashboard below) extends into deleveraging this week, the drawdown scale would reference the mid-July episode (66→42).
🚨 Crisis Precursor Dashboard
1. Credit Spreads
- High-Yield OAS: 2.75% | 🟢 Normal (<3% normal | 3-5% caution | 5-8% panic | >8% crisis)
- Investment-Grade OAS: 0.82% | 🟢 Normal
- Trend: Unchanged (2.75% vs 2.75% prior; 8/20 data, no weekend update)
- Note: The FNG Junk Bond Demand sub-indicator (95.8, Extreme Greed) shows extreme spread compression, consistent with absolute-low spreads — credit remains the most optimistic corner.
2. Yield Curve
- 10Y-2Y Spread: +50bp | 🟢 Normal (holding +50bp for a 5th session, flattened curve stabilizing)
- 10Y: 4.69% | 2Y: 4.19% | 30Y: 5.23%
- 10Y-30Y: -54bp (30Y above 10Y; long end normally upward-sloping)
- Trend: Curve shape stable, no inversion pressure.
3. Margin Debt (FINRA)
- Latest: $1.417T (July 2026, FINRA)
- MoM: -$85B (-5.7% from June’s record $1.502T; first decline after three straight increases)
- YoY: +38.6% (vs $1.022T in July 2025)
- Status: 🔴 Still in record-high territory
- Read: After June’s record $1.502T, margin debt posted its first MoM decline in July to $1.417T. The absolute level is still historically high and +~40% YoY — the leverage amplifier has cooled slightly but has not deleveraged meaningfully. The August figure is due 8/28 (Fri) from FINRA; a continued decline would be an early sign of a deleveraging cycle, pressuring crowded high-leverage trades.
4. IPO Market
- 2026 YTD: 93 listings (Renaissance Capital, ≥$50M market cap)
- Proceeds: ~$144.0B (+631% YoY; SEC basis H1 traditional IPOs ~$114.1B, dominated by SpaceX’s record $75B IPO + SK hynix $26.5B)
- Status: 🟡 Active but not frothy by count (IPO count -24.4% YoY); proceeds are driven by outliers. August is in a summer pause; the calendar is expected to pick up after Labor Day in September.
5. ETF Fund Flows
- 2026 YTD net inflows: Record $1.23T for US-listed funds (through July, ETFGI; July alone +$193.4B, 51st consecutive month of inflows)
- Comparison: Far above 2025’s full-year record of $678B; equity YTD $567.25B (more than double the $249.69B at the same point last year)
- Status: 🔴 Record inflows (State Street projects $2.3T full year)
- Read: Passive money keeps pouring in on top of still-elevated margin debt — systemic risk is building; a reversal would be prone to a stampede.
Composite Assessment
- 🟢 Normal: 3 (HY OAS, IG OAS, yield curve)
- 🟡 Caution: 1 (IPO market)
- 🔴 Risk: 2 (margin debt, ETF inflows)
Summary: Credit spreads and the yield curve remain healthy — no imminent crisis signal. This is a pre-market Monday snapshot; the crisis-precursor side has no new data and matches the prior Saturday report. Margin debt’s first monthly decline (-5.7% to $1.417T) is an early deleveraging hint, with the August print on 8/28 to confirm whether it continues; ETF inflows hit a new record in July (YTD $1.23T) as passive money keeps adding. The “leverage down a touch + passive money up” mix means fragility is not resolved, only its momentum has moderated at the margin. FNG is frozen at the 8/21 close of 55.2 (Greed), with the 66.4-point divergence between Junk Bond Demand (95.8) and Stock Price Strength (29.4) persisting for a 6th session — if credit’s over-optimism turns while margin debt starts deleveraging, the drawdown could be worse than expected. Today’s US open (9:30 ET) delivers the first fresh data point: 57.2 and 53.1 are the two lines dividing rebound confirmation from drawdown escalation.