CNN Fear & Greed Analysis 2026-08-22
Composite index 55.2 (Greed), up +2.7 from prior close, reclaiming the 55 lower edge of the greed zone. Junk bond demand 95.8 (extreme greed) vs stock price strength 29.4 (fear) divergence at 66.4 points, held for the 5th straight day. HY OAS 2.75%, 10Y-2Y +50bp, margin debt $1.502T (June record high, July data due 8/28).
Composite Overview
- Latest score: 55.2 — Greed
- Previous close: 52.5 — Neutral
- Daily change: +2.7 pts (+5.1%)
- Weekly change: -8.8 pts (vs 63.97)
- Monthly change: +11.8 pts (vs 43.37, still above the fear-zone level of a month ago)
- Yearly change: +2.6 pts (vs 52.60)
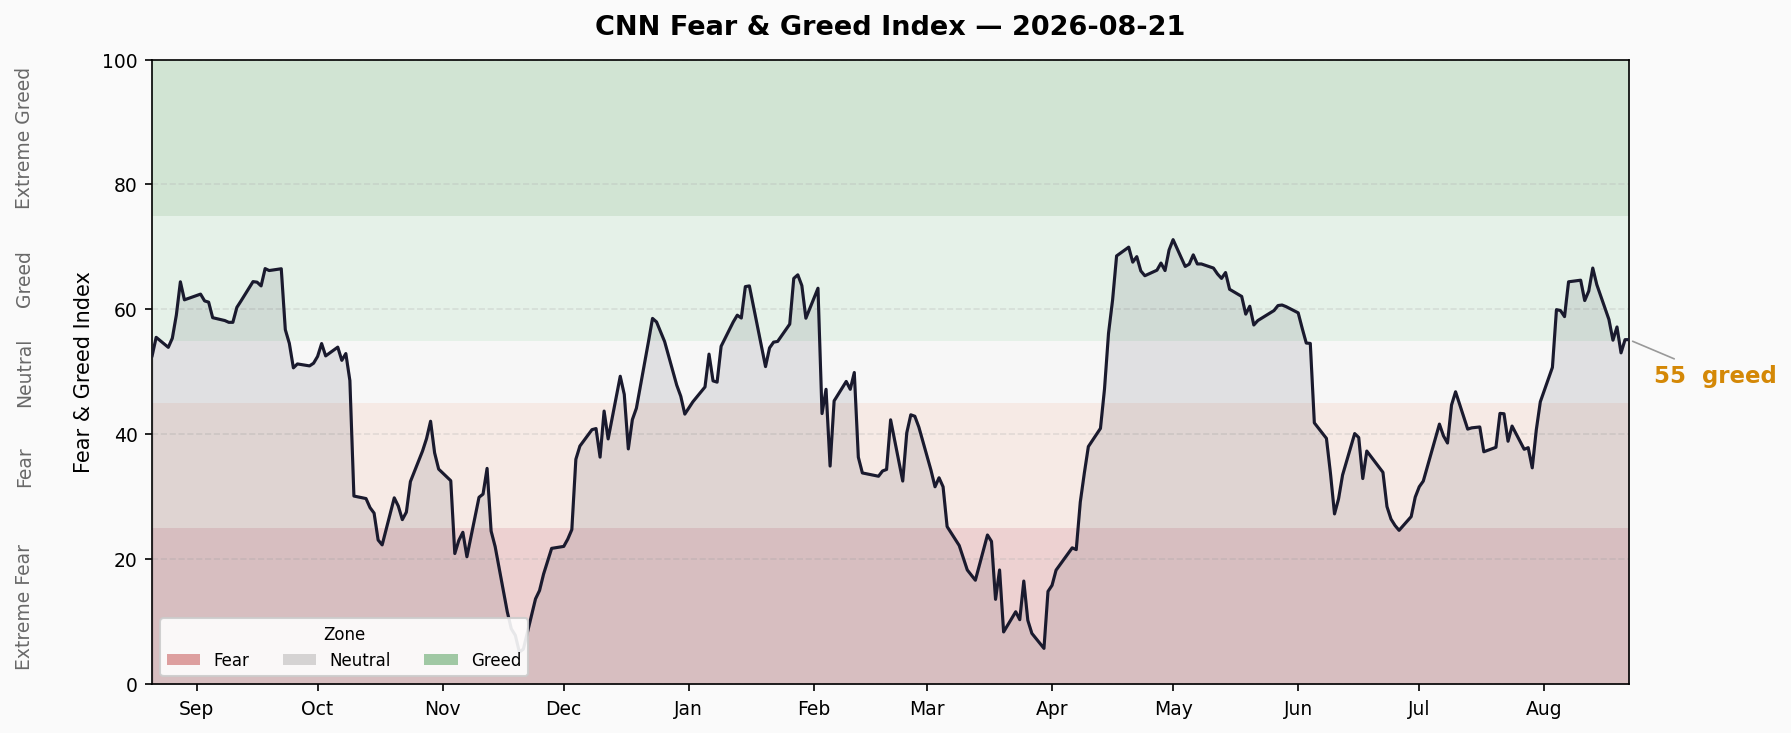
The composite rose 2.7 points, reclaiming the 55 lower edge of the greed zone (upper edge of the 50-55 neutral band). The downtrend from the 8/13 peak of 66.6 is still intact, but after touching 53.1 on 8/20, the index bounced with breadth, strength, options and safe-haven demand all improving simultaneously — a firmer stabilization than the simple bounce on 8/19.
Last 10 Trading Days Trend
| Date | Score | Rating |
|---|---|---|
| 8/11 | 61.4 | Greed |
| 8/12 | 62.9 | Greed |
| 8/13 | 66.6 | Greed |
| 8/14 | 64.0 | Greed |
| 8/17 | 58.4 | Greed |
| 8/18 | 55.1 | Greed |
| 8/19 | 57.2 | Greed |
| 8/20 | 53.1 | Neutral |
| 8/21 | 55.2 | Greed |
Trend: Down roughly 13 points from the 8/13 peak of 66.6, hitting 53.1 on 8/20, then bouncing +2.1 to 55.2 on 8/21 and re-entering the greed zone. However, the bounce high (55.2) remains below the 8/19 high of 57.2, so the descending channel is not yet broken — we are in a “bottom-range oscillation / testing stabilization” phase. A reclaim of 57.2 is needed to confirm a double-bottom.
Seven Sub-Indicators
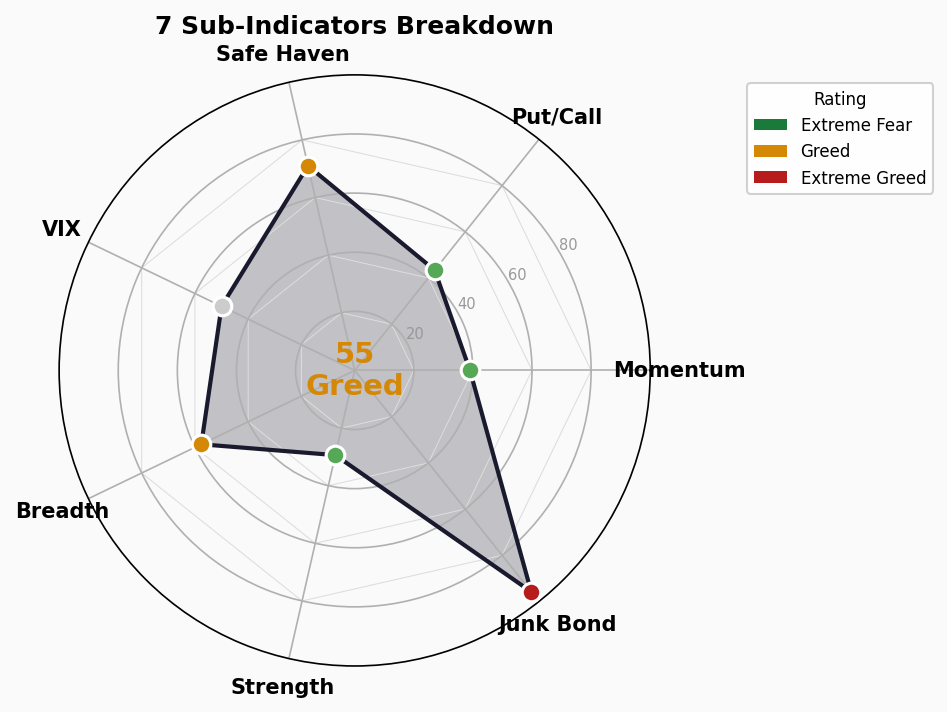
Market Momentum: 39 — Fear
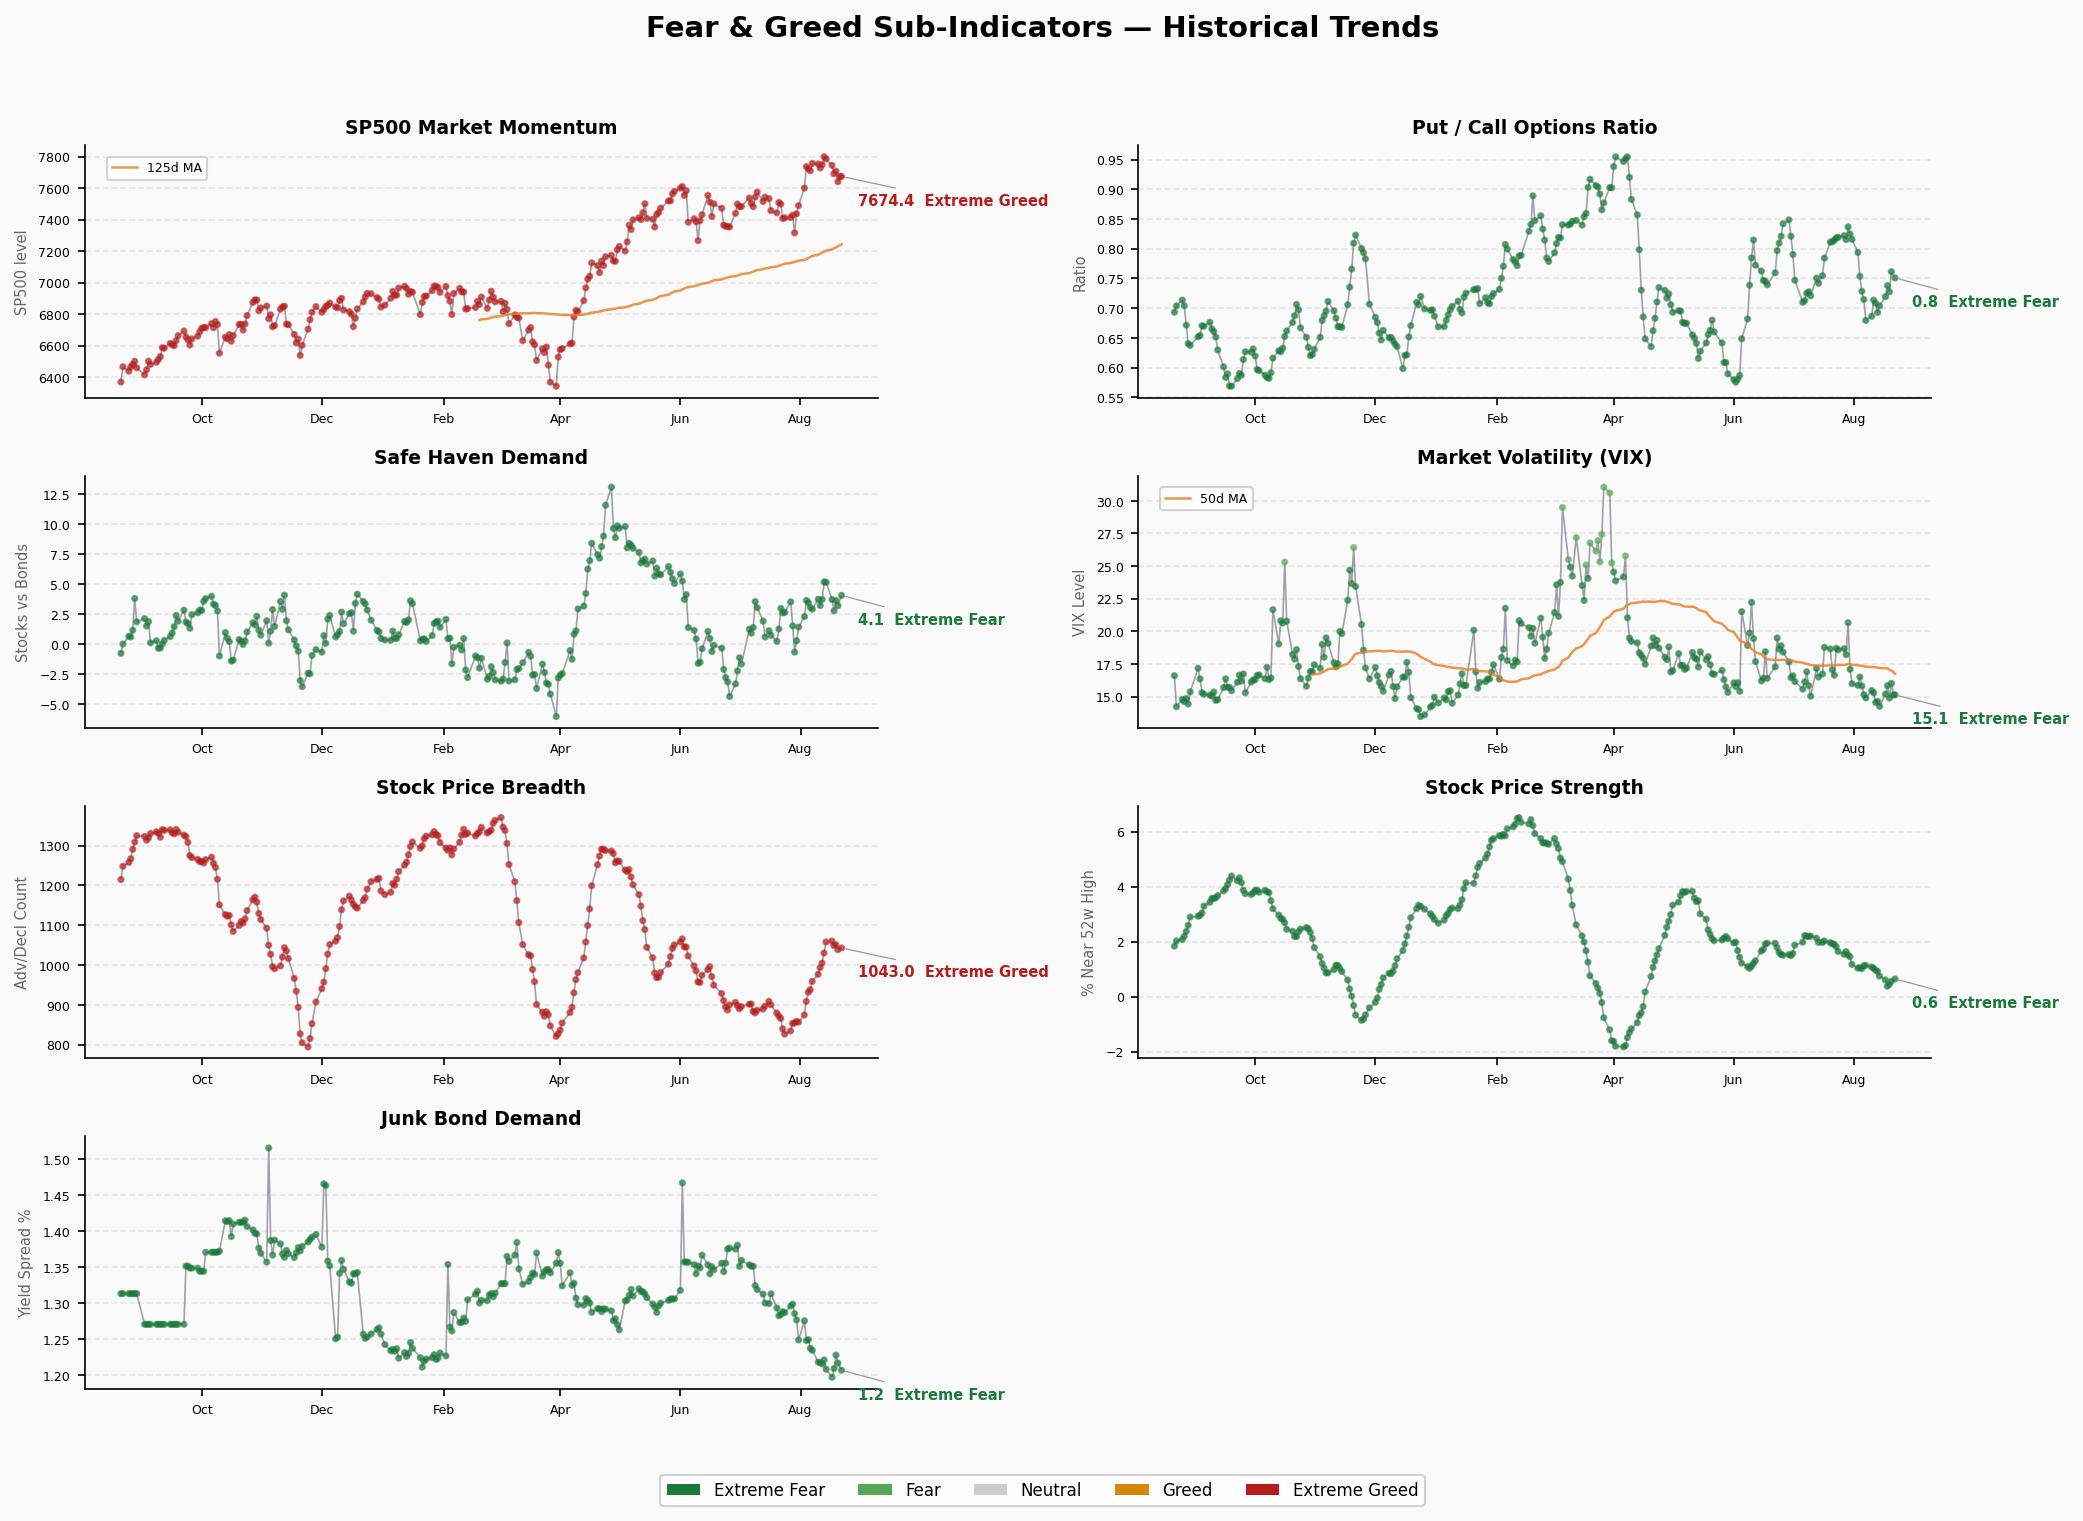
- Raw: S&P 500 @ 7,674.37 (8/21), 125-day MA 7,237.72, deviation +6.0%
- Direction: index up (7,641 → 7,674), sub-score 35.8 → 39
- Note: index rebounded and stays ~6% above its 125-day MA, yet the CNN reading remains in fear — a tension vs the “above MA = greedy” formula, reflecting segmented weighting of the recent pullback. Score improving for a 2nd day but still weak
Stock Price Strength: 29.4 — Fear
- Raw: 0.650 (% of stocks near 52-week highs)
- Direction: up (0.562 → 0.650)
- Note: % of stocks near 52-week highs recovered sharply for a 4th straight day, but absolute level is still low and score stays in fear (<30) — the index bounce has not fully transmitted to broad market internals yet
Stock Price Breadth: 57.6 — Greed
- Raw: 1,043.04 (new highs minus new lows)
- Direction: up (1,038.70 → 1,043.04)
- Note: advancing names widened slightly, breadth up for a 2nd day and holding greed, in sync with strength — the most solid pillar of this bounce
Put/Call Options: 43.4 — Fear
- Raw: 0.750 (P/C ratio)
- Direction: down (0.761 → 0.750)
- Note: put hedging eased, options sentiment warming slightly but still in fear — consistent with the index bounce; hedging pressure is easing but not yet cleared
Market Volatility (VIX): 50 — Neutral
- Raw: 15.13
- Direction: down (16.01 → 15.13)
- Note: VIX back to ~15, volatility benign, no panic pricing — supportive for a continued bounce
Junk Bond Demand: 95.8 — Extreme Greed
- Raw: 1.21 (HY/IG spread ratio)
- Direction: slightly down (1.217 → 1.21)
- Note: credit spreads stay extremely compressed, risk appetite elevated, diverging sharply from weak equity internals — late-cycle feature persists; credit remains the most bullish corner of the market
Safe Haven Demand: 71 — Greed
- Raw: 4.08% (20-day stock vs bond excess return)
- Direction: up (3.226 → 4.08)
- Note: equity outperformance vs bonds widened sharply on the day, defensive rotation not triggered, risk appetite recovering — supports the risk-on read
Structural Contradictions
Core divergence: Junk bond demand extreme greed (95.8) vs stock price strength fear (29.4)
A 66.4-point gap, held for the 5th straight day:
- Fixed income: spreads compressed to the limit (HY OAS 2.75% at absolute lows), investors chasing credit risk for yield — extreme risk appetite
- Equities: index bounced back into the greed zone, but price strength (29.4) and momentum (39) remain in fear — breadth (57.6) is repairing, strength has not caught up
- Historical lesson: credit staying bullish while equity internals are weak is a classic top-region pattern — credit optimism is often a lagging signal; watch for a turn that could amplify equity drawdowns
Secondary divergences:
- Momentum reading (39, fear) vs actual index position (+6% above 125-day MA) → CNN’s segmented weighting skews conservative; read the level alongside the score, avoid over-interpreting the single point
- Strength (29.4) vs breadth (57.6) divergence is converging: strength up 4 days, breadth up 2 days, internals repairing — but strength still in fear; the bounce needs breadth→strength transmission to confirm
- Safe haven demand (71) back to greed, VIX back to 15 → risk-on + low vol combo helps a short-term bounce but also re-accumulates sentiment; the top-range battle is not over
Trend Assessment
- Zone: back above the 55 lower edge of the greed zone (55-75), out of neutral
- Direction: after peaking 66.6 on 8/13, falling to 53.1 on 8/20, bouncing +2.1 to 55.2 on 8/21. This bounce is firmer than 8/19’s: breadth, strength, P/C and safe-haven demand all improved with VIX down. But the high did not break 57.2 — still inside the descending channel, “testing stabilization” not “trend reversal”
- Key levels:
- 57.2 (8/19 bounce high): a break confirms a double-bottom and a sentiment repair; otherwise it’s an oscillation within the channel
- Junk bond demand (95.8): if it rolls over from the top, credit turning hawkish would amplify drawdowns — the single biggest risk
- Stock price strength (29.4) still in fear — breadth has led; strength needs to follow to validate the bounce
- Historical context: a month ago (43.37) was in fear; this cycle rose from fear to 66.6, pulled back to 53.1, now back to 55.2 — sentiment center still above last month. Easy credit and passive flows underpin, but leverage and divergence are both high; a renewed break below 53 would reference the mid-July drawdown scale (66→42)
🚨 Pre-Crash Indicator Dashboard
1. Credit Spreads
- High-Yield OAS: 2.75% | 🟢 Normal (<3% normal | 3-5% caution | 5-8% panic | >8% crisis)
- Investment-Grade OAS: 0.82% | 🟢 Normal
- Trend: +2bp from prior day (2.73% → 2.75%), slight widening but still at absolute lows
- Note: the FNG junk bond demand sub-indicator (95.8, extreme greed) is consistent with the absolute-low spread — credit remains the most optimistic corner of the market
2. Yield Curve
- 10Y-2Y Spread: +50bp | 🟢 Normal (flat-to-stable for a 3rd day at +50bp)
- 10Y: 4.69% | 2Y: 4.19% | 30Y: 5.23%
- 10Y-30Y: -54bp (30Y above 10Y, normal upward long end)
- Trend: 10Y +4bp (4.65 → 4.69), 30Y +4bp (5.19 → 5.23), 2Y flat — both ends up together, curve shape stable, no inversion pressure
3. Margin Debt (FINRA)
- Latest: $1.502T (June 2026, FINRA)
- M/M: +$86B (+6.1% from May’s $1.416T)
- Y/Y: +49% (vs June 2025’s $1.008T)
- Status: 🔴 Record high
- Note: 3rd straight monthly record with accelerating leverage. July data due Aug 28 (next Friday) — a pullback would be an early de-leveraging signal
4. IPO Market
- 2026 YTD: ~93 deals (Renaissance Capital)
- Proceeds: ~$144B (+631%, led by SpaceX’s record $75B IPO + SK hynix $26.5B)
- Status: 🟡 Active but deal count not bubbly; proceeds skewed by a few mega-deals; August in summer pause, calendar expected to rebuild post-Labor Day
5. ETF Fund Flows
- 2026 YTD inflows: US-listed ~$1T+ (as of June, Kobeissi); global $1.71T (as of end-July, ETFGI, 51 months of consecutive inflows)
- Status: 🔴 Record inflows (full year tracking above $2T, far exceeding 2025’s $1.5T record)
- Note: passive money pouring in on top of record margin leverage — systemic risk accumulating; a reversal could trigger a stampede
Summary
- 🟢 Normal: 3 (HY OAS, IG OAS, yield curve)
- 🟡 Caution: 1 (IPO market)
- 🔴 Risk: 2 (margin debt, ETF inflows)
Conclusion: Credit spreads and the yield curve remain healthy — no imminent crisis signal. But margin debt sits at a $1.5T record high and ETF inflows are at records, leaving leverage and passive flows both elevated as fragility. Today the composite reclaimed the greed zone with breadth/strength/options sentiment all warming — a firmer short-term stabilization signal. Yet the 66.4-point divergence between junk bond demand (95.8, extreme greed) and stock price strength (29.4) persists for a 5th day — if credit optimism turns while margin de-leveraging starts, the drawdown intensity could exceed expectations. 57.2 and 53.1 are the two watershed levels for bounce confirmation vs correction escalation.