CNN Fear & Greed Analysis 2026-08-21
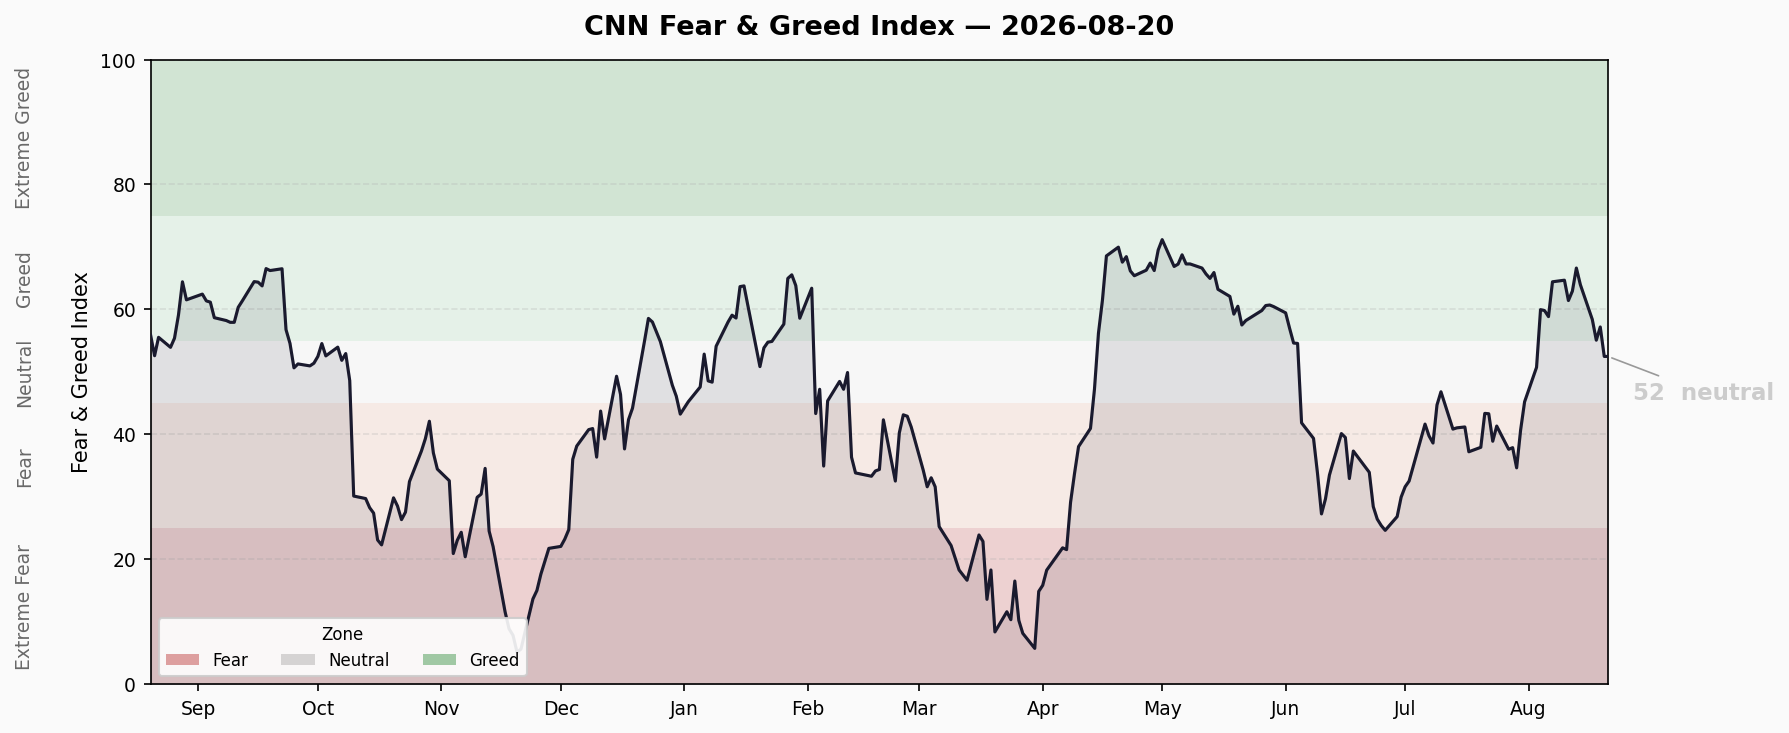
Composite index at 52.5 (Neutral), down 3.9 points vs prior close, breaking below the greed-zone floor of 55 into neutral territory. Junk bond demand 94.6 (extreme greed) vs stock price strength 28 (fear) divergence at 66.6 points, held for a 4th straight day. HY OAS 2.73%, 10Y-2Y +50bp, margin debt $1.502T (Jun record high; Jul data due Aug 28).
Composite Index Overview
- Latest Score: 52.5 — Neutral
- Prior Close: 56.3 — Greed
- Daily Change: -3.9 points (-6.9%)
- Weekly Change: -14.1 points (vs 66.63)
- Monthly Change: +14.5 points (vs 37.94, rebounded from fear then pulled back)
- Yearly Change: -3.4 points (vs 55.91)
The composite index dropped 3.9 points in a single day, breaking below both the greed-zone floor of 55 and the 54-55 support band, settling in neutral territory (50-55). The downtrend since the Aug 13 peak of 66.63 continues — the brief stabilization of the prior two sessions was invalidated by today’s red candle, confirming an escalation of the correction. The index has now weakened for four straight sessions; the top-of-range tug-of-war has, for now, ended with the bears winning.
Last 10 Trading Days
| Date | Score | Rating |
|---|---|---|
| 8/7 | 64.4 | Greed |
| 8/10 | 64.7 | Greed |
| 8/11 | 61.4 | Greed |
| 8/12 | 62.9 | Greed |
| 8/13 | 66.6 | Greed |
| 8/14 | 64.0 | Greed |
| 8/17 | 58.4 | Greed |
| 8/18 | 55.1 | Greed |
| 8/19 | 57.2 | Greed |
| 8/20 | 52.5 | Neutral |
Trend assessment: The index has given back roughly 14 points since its Aug 13 peak of 66.6, today falling out of the greed zone into neutral. The Aug 19 rebound was only a pause; with the 54-55 support broken, the next key level to watch is 50 (the lower edge of neutral) — a break below would formally enter fear territory and shift the backdrop to defensive. The overall structure remains a top-driven correction with no bottoming signal yet.
Seven Indicator Scan
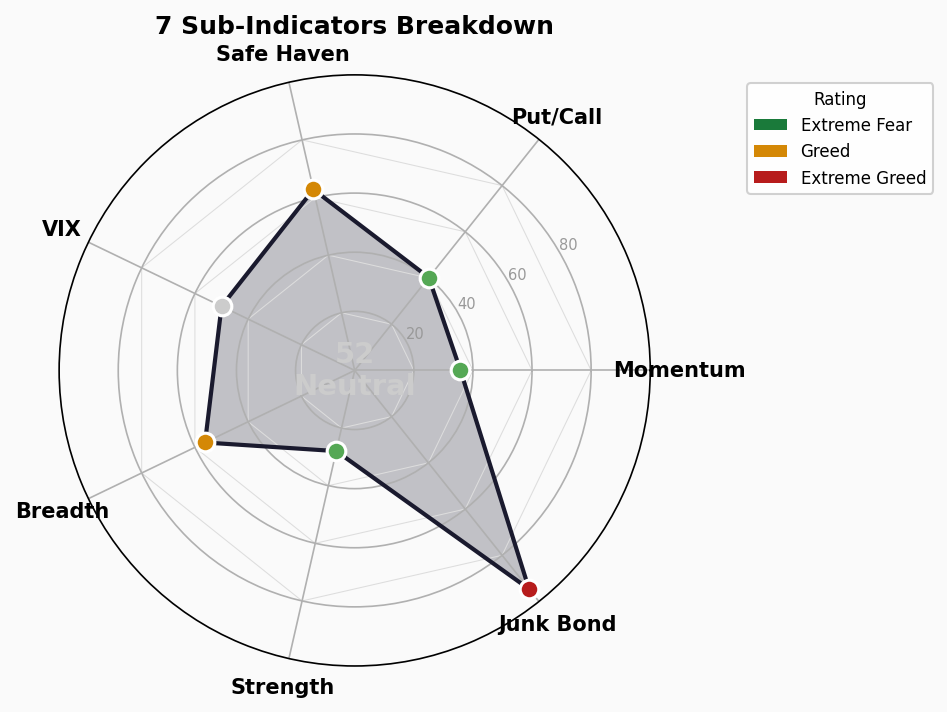
Market Momentum: 35.8 — Fear
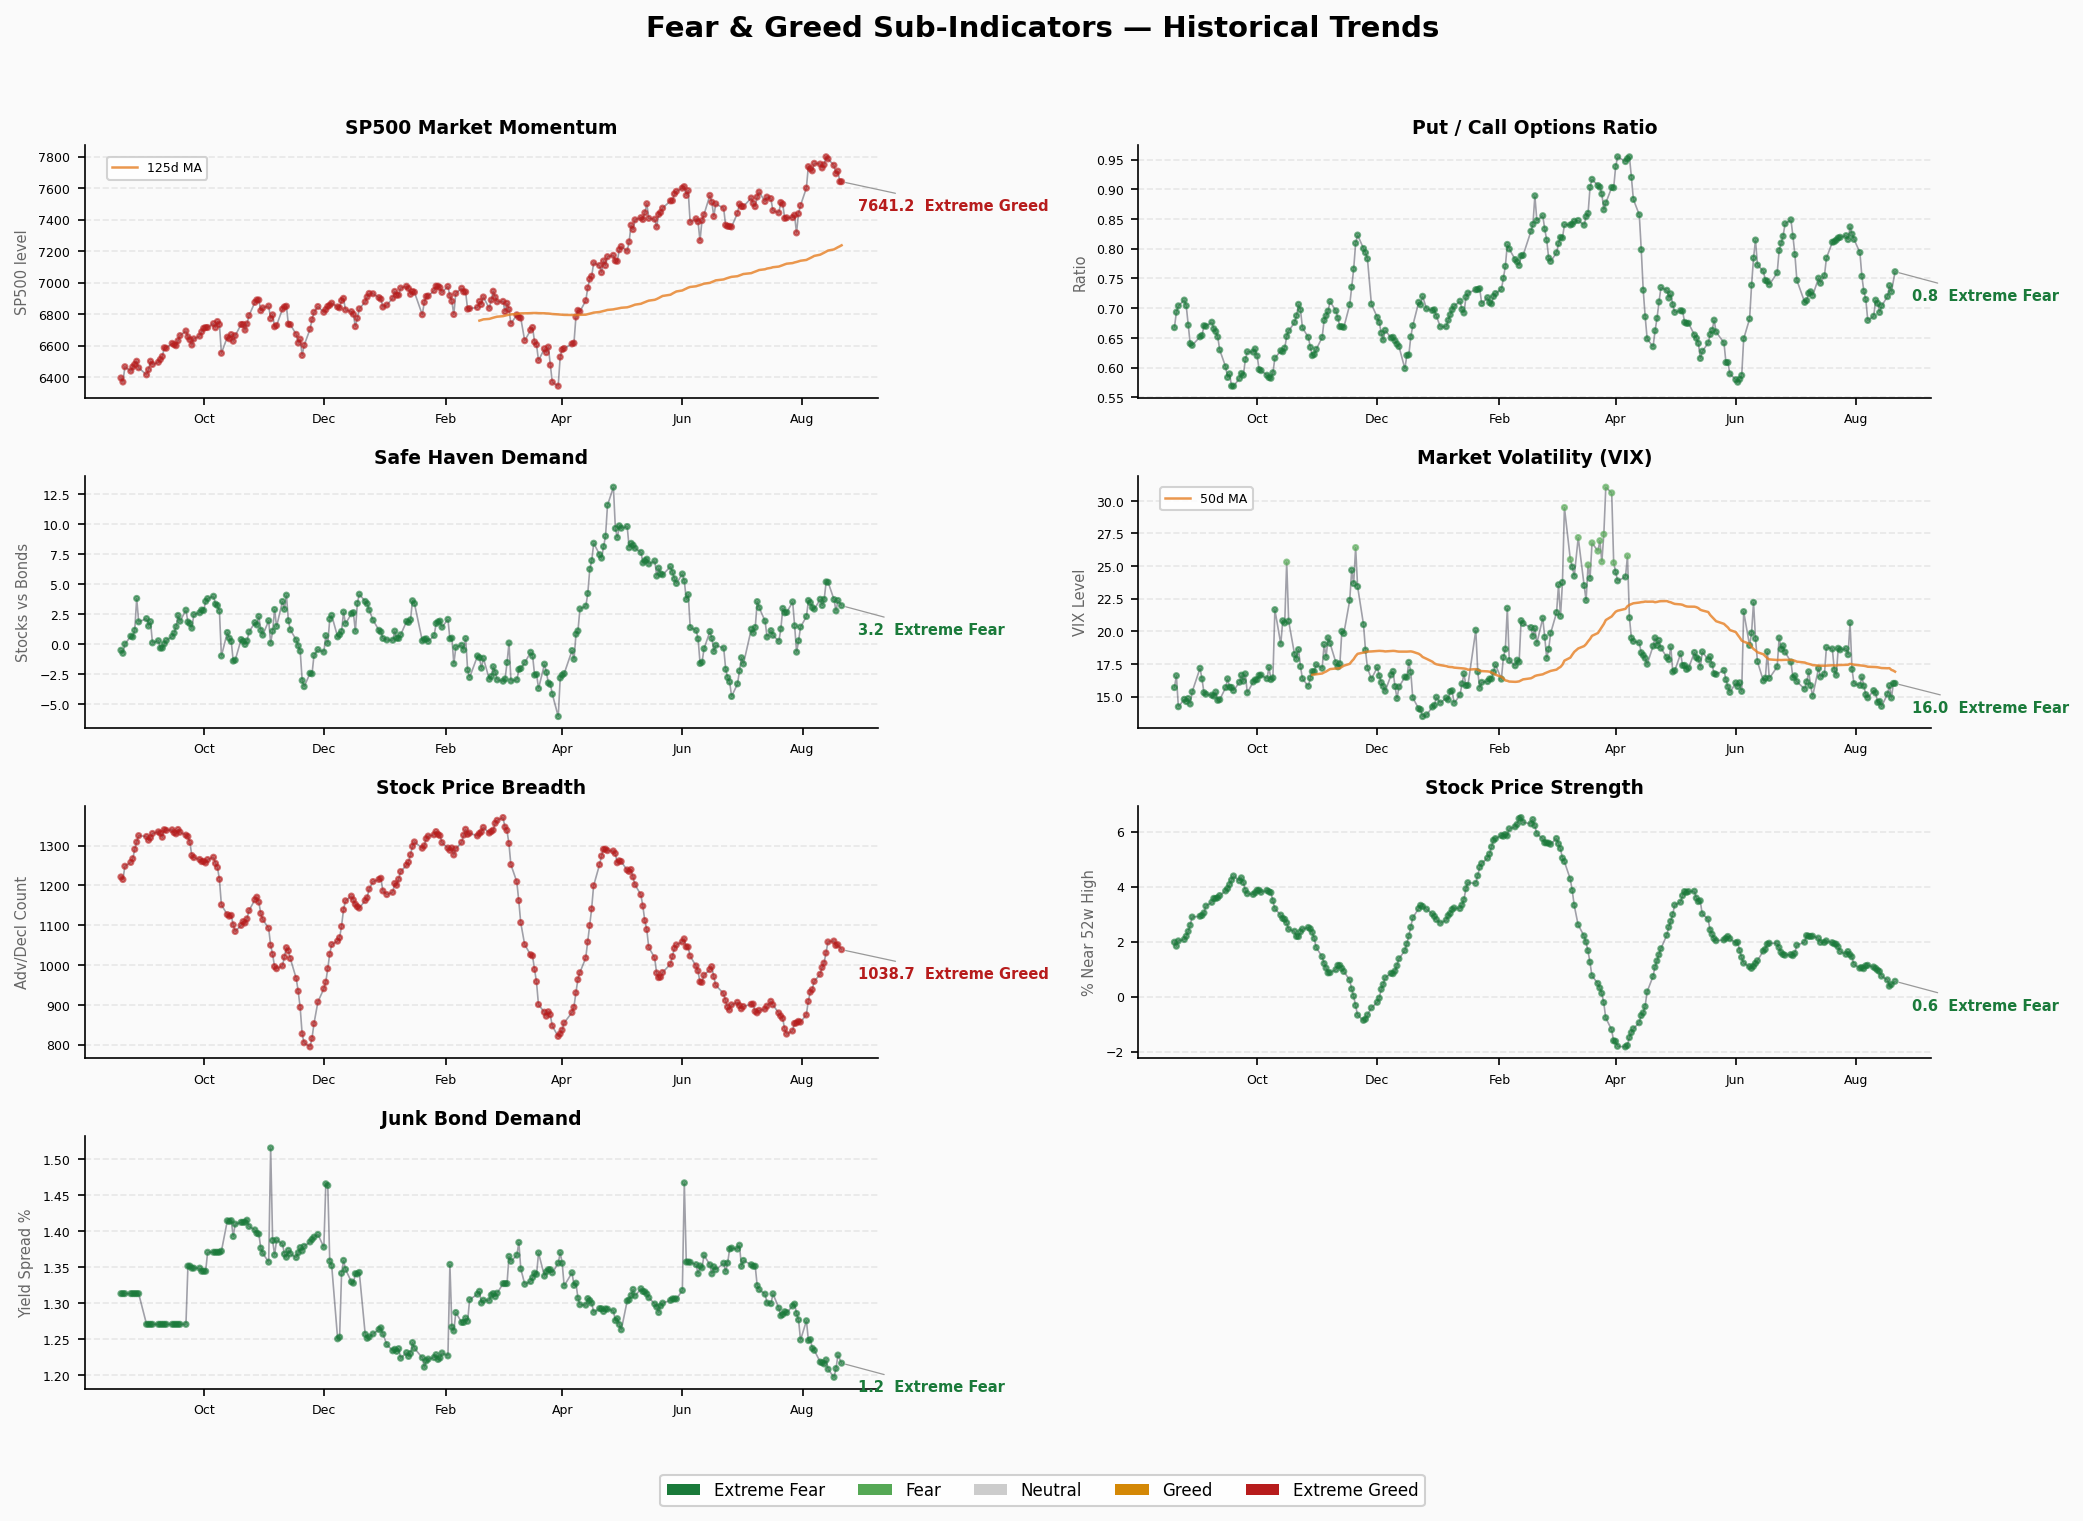
- Raw value: S&P 500 @ 7,641.16 (8/20), below the 125-day MA
- Direction: Falling (7,708 → 7,641)
- Read: The index fell and broke below its intermediate-term average; momentum flipped from stabilizing to weakening — the core drag on today’s composite decline
Stock Price Strength: 28 — Fear
- Raw value: 0.562 (56.2% of stocks above their 50-day MA)
- Direction: Rising for a 3rd day (0.443 → 0.562)
- Read: Breadth is repairing and has reclaimed the 50% threshold, yet the score still sits in fear territory — index down while breadth up, divergence widening; the rebound lacks confirmation until the index cooperates
Stock Price Breadth: 56.2 — Greed
- Raw value: 1,038.70 (advance/decline volume line)
- Direction: Slightly lower (1,051 → 1,039)
- Read: Breadth eased a bit from highs but remains greedy; advancing names still lead overall, corroborating the recovery in stock price strength
Put/Call Options: 40.2 — Fear
- Raw value: 0.761 (P/C ratio)
- Direction: Rising (0.727 → 0.761)
- Read: Hedging demand picked up again; options market sentiment turned cautious, in sync with the index decline — confirming today’s selling pressure is real
Market Volatility (VIX): 50 — Neutral
- Raw value: 16.01
- Direction: Higher (14.89 → 16.01)
- Read: VIX crossed above 15 to 16; some fear crept in but remains in the mild zone — no genuine panic pricing yet
Junk Bond Demand: 94.6 — Extreme Greed
- Raw value: 1.217 (HY/IG spread ratio)
- Direction: Slightly lower (1.228 → 1.217)
- Read: Credit spreads remain extremely compressed with risk appetite still elevated — a stark divergence from the equity pullback, classic late-cycle behavior
Safe Haven Demand: 62.8 — Greed
- Raw value: 3.226% (20-day stock vs bond excess return)
- Direction: Slightly lower (3.655 → 3.226)
- Read: Equities’ relative edge over bonds narrowed a touch but remains clear; no confirmed rotation into defensives, risk assets still attractive
Structural Contradictions
Core contradiction: Extreme-greed junk bond demand (94.6) vs fearful stock price strength (28)
A 66.6-point gap, now held for a 4th straight day:
- Fixed income: Spreads compressed to the limit as investors chase yield and take on credit risk — extreme risk appetite
- Equities: 56.2% of stocks sit above their 50-day MA (breadth repairing), but both market momentum (35.8) and price strength (28) are in fear territory
- Historical lesson: Credit markets not bearish while equity momentum weakens is a pattern often seen at market tops — credit optimism is typically a lagging signal, and momentum breaking below its average today may be the leading turn
Secondary contradictions:
- Composite index broke below the greed zone while junk bond demand (94.6) sits near max → credit and equity sentiment are fully decoupled; the divergence has widened rather than converged after 4 days
- Price strength (28) vs breadth (56.2) moving in opposite directions: more stocks above their 50-day MA while the index breaks down → oversold names are repairing but megacaps drag the index; the rebound structure is fragile
- Safe haven demand (62.8) still in greedy/high territory (equities’ edge intact) → funds have not systematically fled risk assets; this reads as top-of-range churn rather than a trend reversal
Trend Assessment
- Zone position: Broke below the greed-zone floor (55-75), now at the upper edge of neutral (50-55)
- Direction: Consistent decline since the Aug 13 peak of 66.63; the Aug 19 bounce failed as a continuation, and today’s -3.9-point drop pierced the 54-55 support, confirming an escalation. Next key level: 50 — below it, the index formally enters fear territory
- Key levels to watch:
- 50 round number: hold = neutral-zone churn; break = sentiment shifts to fear, upgrading the move from “top-of-range pullback” to “trend correction”
- Junk bond demand (94.6): should it roll over from these highs, a hawkish credit market would amplify equity drawdowns — the single biggest point of risk right now
- Price strength has reclaimed 50% (0.562) but momentum is still weak — breadth is leading; a reclaim of 55 by the index would be the real stabilization signal
- Historical comparison: A month ago the index was in fear (37.94); it rallied to a 66.6 peak and has now faded to 52.5, giving back the central portion of the greed zone. Credit easing and passive flows remain the floor, but with leverage and dispersion both elevated, a break of 50 would reference the July correction’s magnitude (66 → 42)
🚨 Pre-Crash Indicator Dashboard
1. Credit Spreads
- High Yield OAS: 2.73% | 🟢 Normal (<3% normal | 3-5% caution | 5-8% panic | >8% crisis)
- Investment Grade OAS: 0.81% | 🟢 Normal
- Trend: -2bp vs prior day (2.75% → 2.73%); HY spreads narrowed slightly, still at absolute lows
- Note: The FNG junk bond demand sub-indicator (94.6, extreme greed) reflects extreme spread compression, consistent with the low absolute level — credit remains the most bullish corner of the market
2. Yield Curve
- 10Y-2Y Spread: +50bp | 🟢 Normal (+4bp steeper vs prior +46bp)
- 10Y: 4.65% | 2Y: 4.19% | 30Y: 5.19%
- 10Y-30Y: -54bp (30Y above 10Y, normal upward slope at the long end)
- Trend: 10Y-2Y steepened for a 2nd straight day, driven mainly by falling short-end yields; the curve stays positive, no inversion pressure
3. Margin Debt (FINRA)
- Latest: $1.502T (Jun 2026, FINRA)
- MoM: +$86B (+6.1% from May’s $1.416T)
- YoY: +49% (vs $1.008T in Jun 2025)
- Status: 🔴 Record high
- Read: Margin debt set a 3rd straight monthly record in June with accelerating growth; the leverage amplifier runs at full capacity. July data is due Aug 28 — a rollover there would be an early de-leveraging signal
4. IPO Market
- 2026 YTD: ~93 IPOs (Renaissance Capital, -24% vs same period 2025)
- Proceeds: $144B (+631%; SpaceX $75B largest-ever IPO + SK hynix $26.5B)
- Status: 🟡 Active but count not frothy; proceeds driven by outliers
5. ETF Fund Flows
- 2026 YTD net inflows: ~$1.23T (through end-July, ETFGI; 51 straight months of inflows)
- Status: 🔴 Record inflows (vs $678B for full-year 2025)
- Read: Surging passive flows combined with record margin debt concentration of leverage; a reversal would risk a stampede
Summary
- 🟢 Normal: 3 (HY OAS, IG OAS, yield curve)
- 🟡 Caution: 1 (IPO market)
- 🔴 Risk: 2 (margin debt, ETF flows)
Bottom line: Credit spreads and the yield curve remain healthy — no imminent crisis signal. But margin debt at a $1.5T record and YTD ETF inflows of $1.23T leave both leverage and passive money elevated, a genuine fragility. Today’s break of the greed zone is the first cooling of sentiment, combined with the divergence of repairing breadth vs weakening momentum — the market is moving from top-of-range churn toward correction validation. The biggest lingering risk remains junk bond demand (94.6, extreme greed): should credit optimism turn, amplified by any onset of margin-debt de-leveraging, the drawdown could exceed expectations. The 50 level is the next bull/bear watershed.