CNN Fear & Greed Analysis 2026-08-20
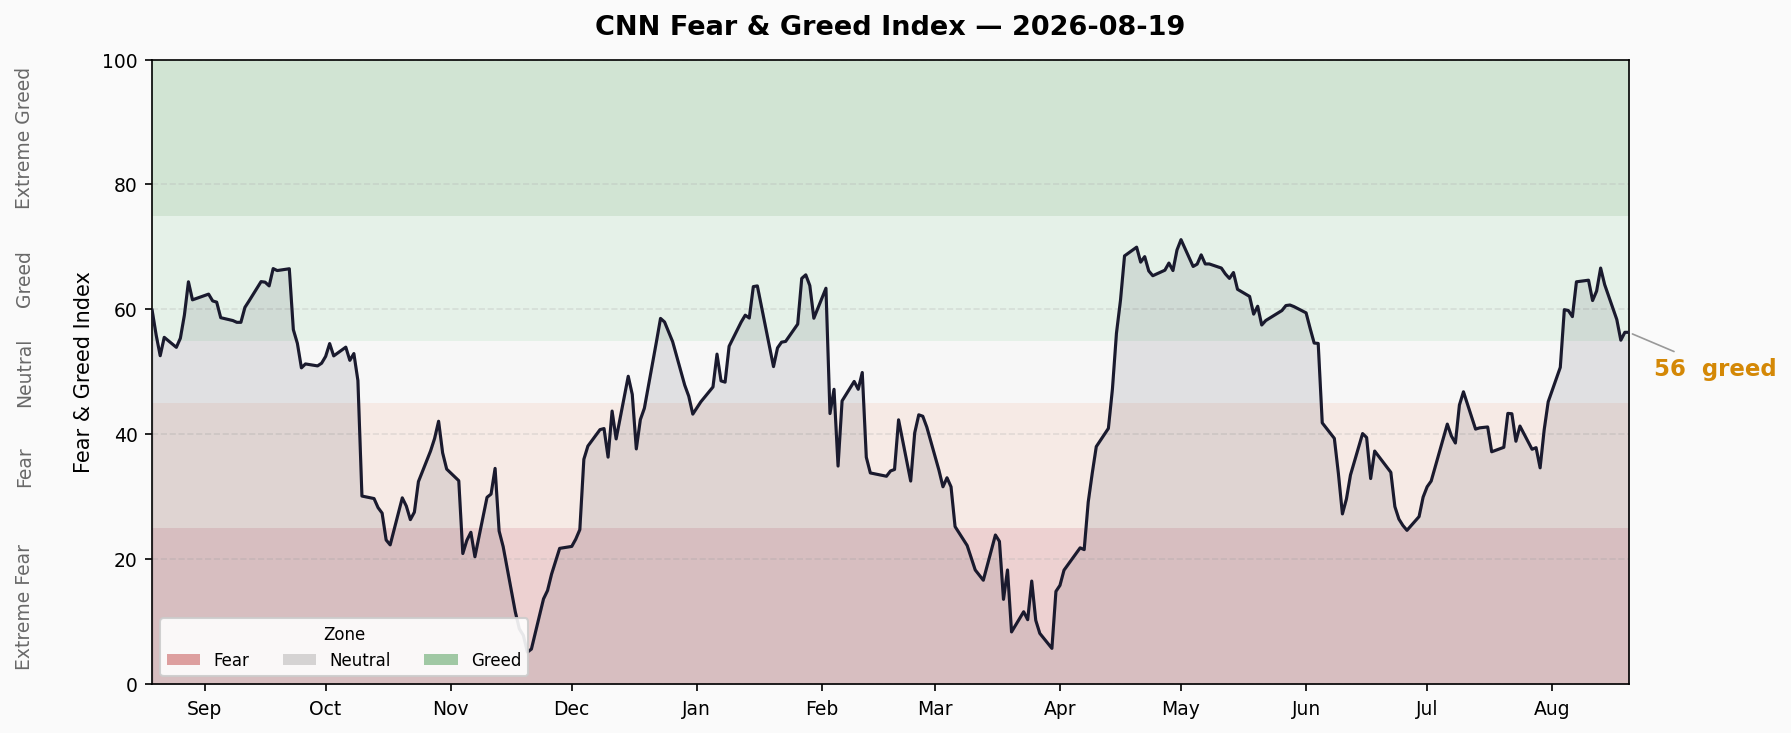
Composite 56.3 (Greed), +1.9 pts from prior close, back above the greed threshold. Junk bond demand 92.8 (extreme greed) vs stock price strength 26.2 (fear) divergence persists at 66.6 pts. HY OAS 2.75%, 10Y-2Y +46bp, margin debt $1.502T (June record high).
Composite Index Overview
- Latest score: 56.3 — Greed
- Prior close: 54.4 — Neutral
- Daily change: +1.9 pts (+3.6%)
- Weekly change: -6.6 pts (vs 62.94)
- Monthly change: +19.1 pts (vs 37.23, rebound from fear zone)
- Yearly change: -3.5 pts (vs 59.89)
The composite bounced back above the greed threshold (55) after briefly dipping below it, reclaiming the greed zone. The overall downtrend since the Aug 13 peak of 66.63 remains intact, but the pullback found support around 54-55 and sentiment did not deteriorate further. The index has now stayed in the greed zone for a third straight week (always ≥55 since Aug 3) — a classic topping-range pattern.
Last 10 Trading Days Trend
| Date | Score | Rating |
|---|---|---|
| 8/6 | 58.86 | Greed |
| 8/7 | 64.43 | Greed |
| 8/10 | 64.69 | Greed |
| 8/11 | 61.43 | Greed |
| 8/12 | 62.94 | Greed |
| 8/13 | 66.63 | Greed |
| 8/14 | 63.97 | Greed |
| 8/17 | 58.40 | Greed |
| 8/18 | 55.09 | Greed |
| 8/19 | 56.34 | Greed |
Trend: The index has spent two full weeks in the greed zone, briefly approaching its lower bound on Aug 18 before rebounding. The structure remains a pullback-plus-bounce tug-of-war since the Aug 13 peak, with no new direction confirmed — ~54 acts as near-term support, while 60+ would signal a return to the strong zone.
Seven Sub-Indicators Scan
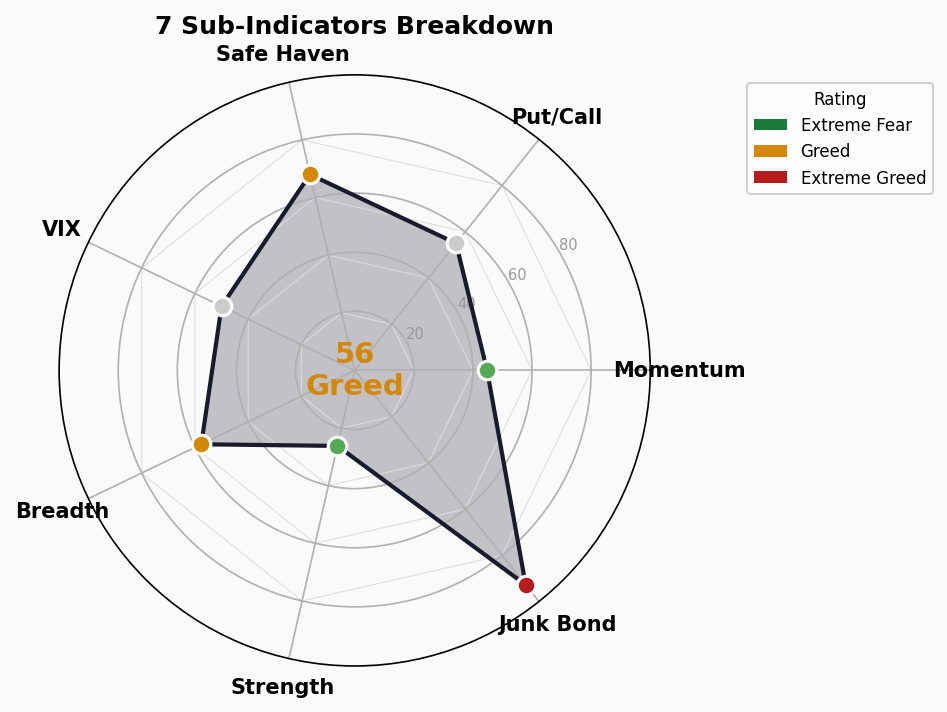
Market Momentum: 44.8 — Fear
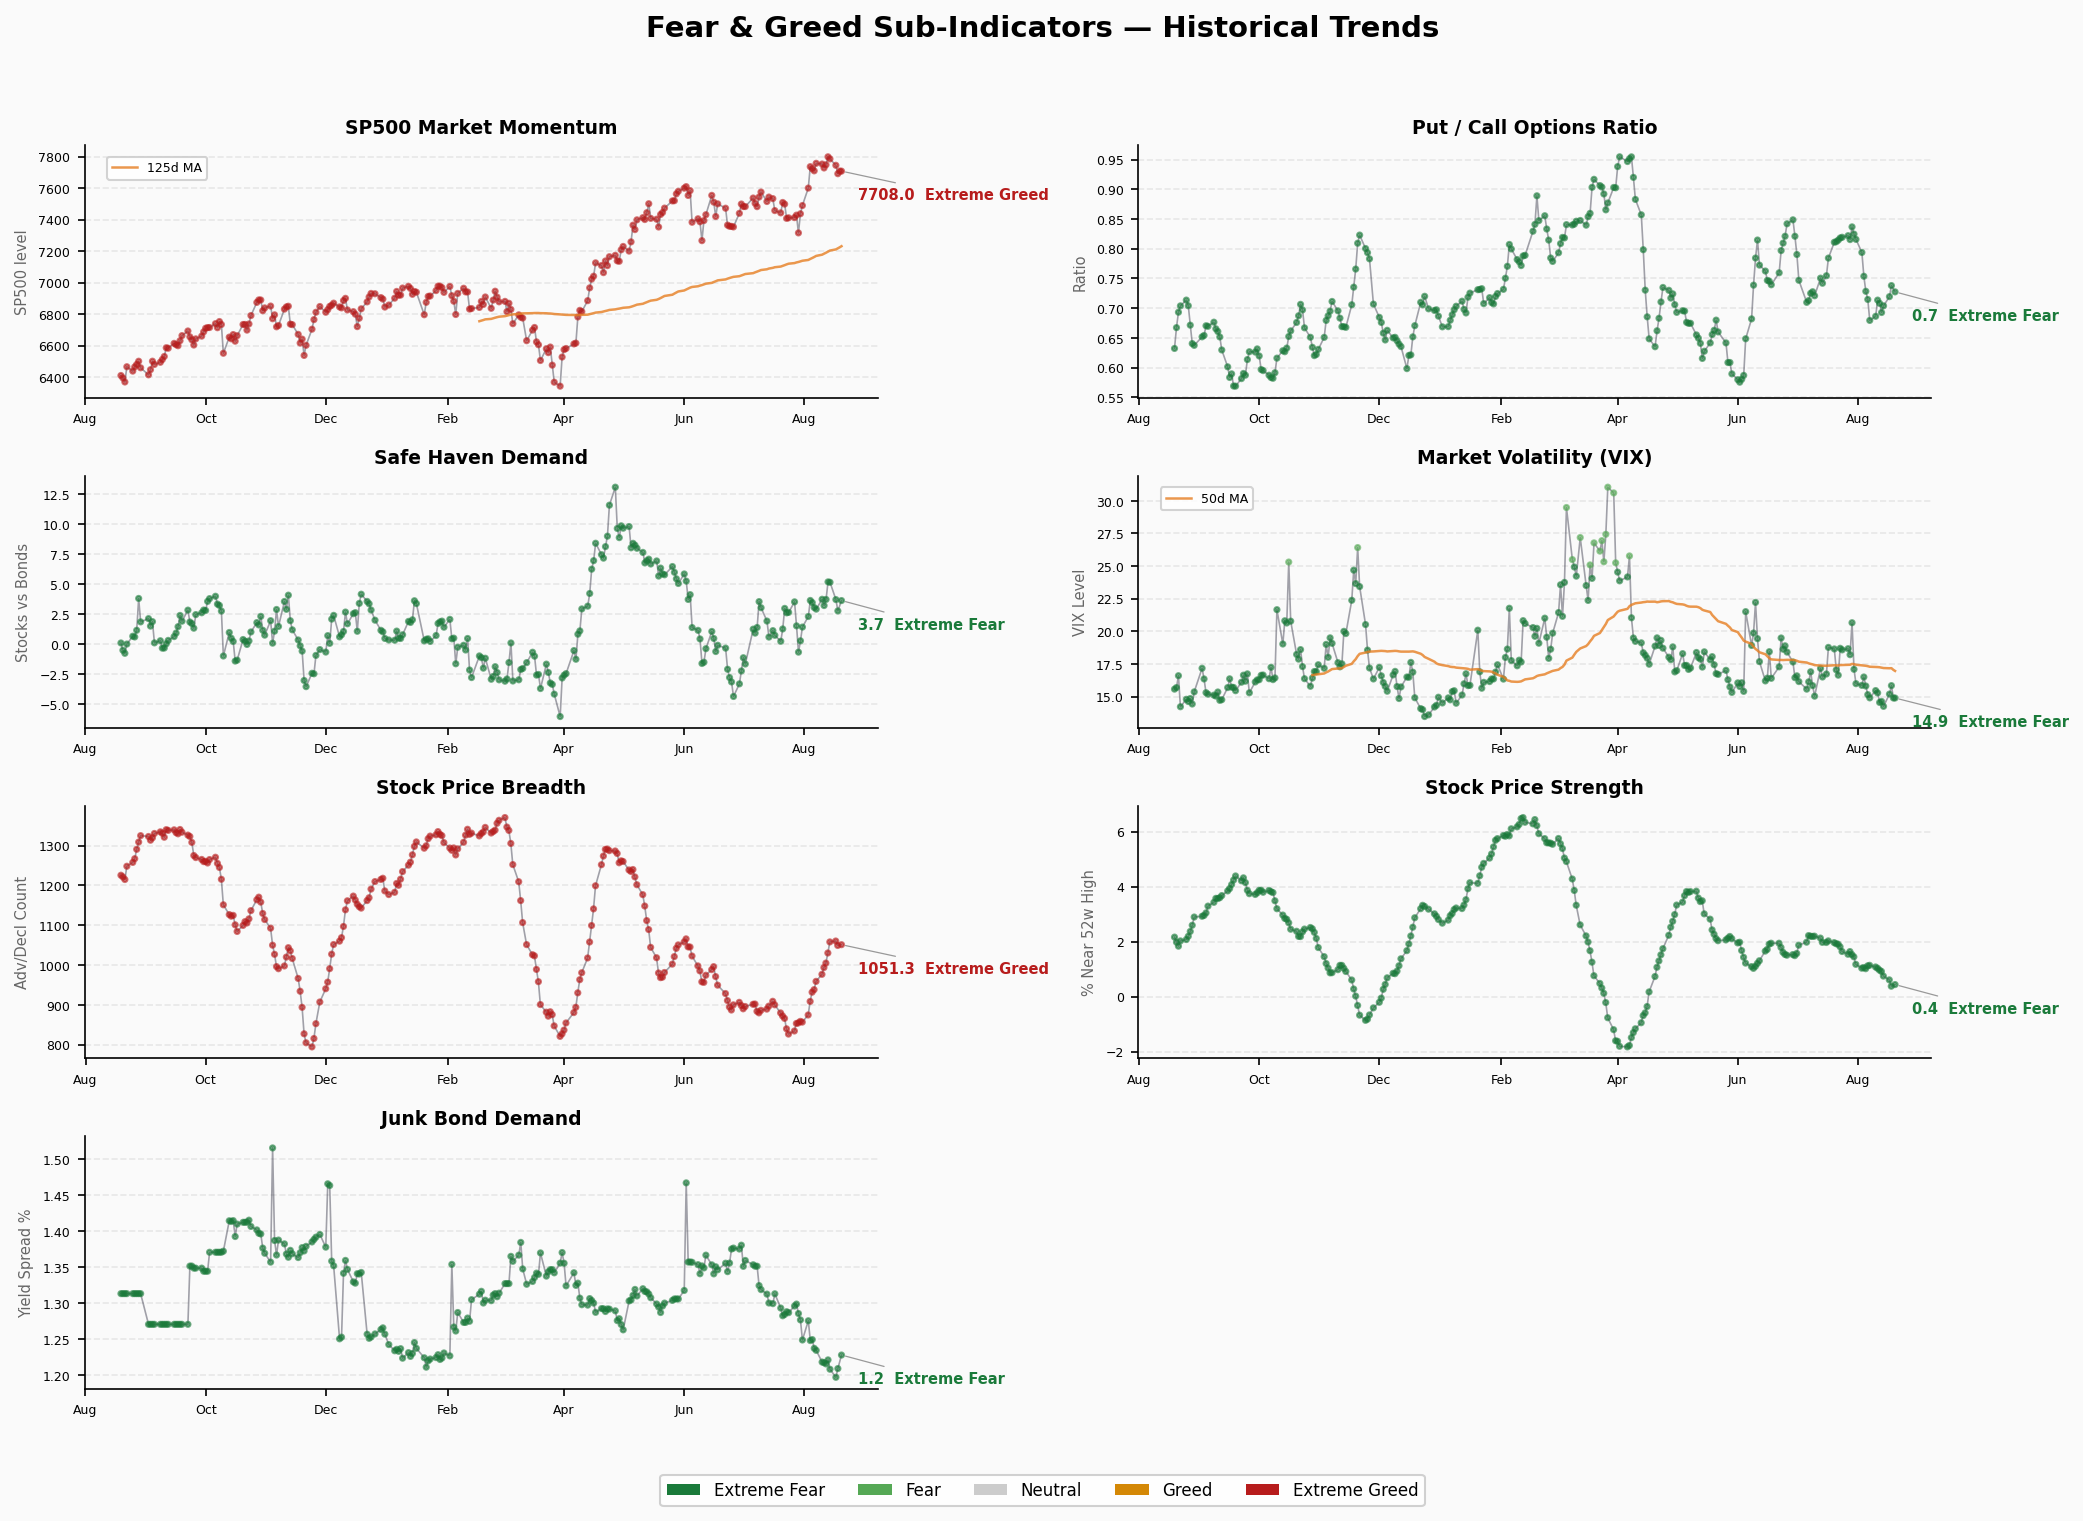
- Raw value: S&P 500 @ 7,707.98 (8/19), still below the 125-day MA
- Direction: stabilizing at lows (7,692 → 7,708)
- Reading: Index is repairing modestly below its medium-term average; momentum stays fearful but is firming at the margin
Stock Price Strength: 26.2 — Fear
- Raw value: 0.443 (44.3% of stocks above their 50-day MA)
- Direction: marginal improvement (0.383 → 0.443)
- Reading: Breadth of new highs recovered ~6 pts from lows but remains deep in fear territory; the breadth base is thin
Stock Price Breadth: 57.6 — Greed
- Raw value: 1,051.27 (advance/decline volume line)
- Direction: mild uptick (1,049 → 1,051)
- Reading: Breadth has risen for two consecutive days; advancing stocks are back in the majority
Put/Call Options: 55 — Neutral
- Raw value: 0.727 (P/C ratio)
- Direction: eased (0.738 → 0.727)
- Reading: Hedging demand loosened slightly; the options market has returned to neutral-to-bullish
Market Volatility (VIX): 50 — Neutral
- Raw value: 14.89
- Direction: flat
- Reading: VIX holds below 15, no panic bids; volatility remains mild
Junk Bond Demand: 92.8 — Extreme Greed
- Raw value: 1.228 (HY/IG spread ratio)
- Direction: grinding higher (1.21 → 1.228)
- Reading: Credit spreads stay extremely compressed with no sign of loosening; risk appetite remains elevated — late-cycle characteristics persist
Safe Haven Demand: 68 — Greed
- Raw value: 3.651% (20-day excess return of stocks vs bonds)
- Direction: rebounded (2.788 → 3.651)
- Reading: Equities’ relative outperformance over bonds has widened again; the defensive rotation of the prior two days has paused
Structural Contradiction Analysis
Core divergence: Junk bond extreme greed (92.8) vs stock price strength fear (26.2)
The extreme ~66.6-pt gap has persisted for a third day:
- Fixed income: Spreads compressed to the limit; investors are chasing credit risk for yield
- Equities: Only 44% of stocks sit above their 50-day MA; breadth is weak despite the modest uptick
- Historical lesson: Credit markets staying bullish while internals of the equity market weaken is a pattern often seen near tops — credit optimism tends to be a lagging signal
Secondary divergences:
- Composite reclaimed the greed zone, yet momentum (44.8) and price strength (26.2) remain in fear → the index is being propped up by large caps while breadth lags; the quality of the bounce is unverified
- Junk bond demand (92.8) stays pinned at highs vs weak price strength → the disconnect has not narrowed for three days
- Safe haven demand (68) recovered from 2.79% to 3.65%, pausing the defensive rotation → supportive for equities near-term, but also signals risk appetite re-heating
Trend Assessment
- Zone: Back at the lower edge of the greed zone (55-75), still adjacent to the neutral boundary
- Direction: Downtrend since the Aug 13 peak of 66.63; a one-day bounce after finding support near 54, now in a 54-60 range
- Key watch points:
- A firm hold above 60 and recapture of the weekly mean (62.9) would signal the pullback is over; another break below 54 would confirm an escalation of the correction
- If junk bond demand (92.8) begins to roll over, a hawkish turn in credit markets would amplify equity drawdowns
- Whether price strength can reclaim 50 is key — without confirmed breadth repair, the bounce is unreliable
- Historical comparison: One month ago (37.23) the market was in the fear zone; this +19-pt rebound remains driven by credit easing and passive inflows rather than earnings or breadth improvement. Sentiment repair underpins the rally, but individual-stock breadth trails the index — watch for the classic top-of-market signature of “index making new highs while stocks don’t”
🚨 Crisis Leading Indicators Dashboard
1. Credit Spreads
- High Yield OAS: 2.75% | 🟢 Normal (<3% normal | 3-5% caution | 5-8% panic | >8% crisis)
- Investment Grade OAS: 0.82% | 🟢 Normal
- Trend: +5bp from prior day (2.70% → 2.75%), slightly wider but still low
- Note: The FNG junk bond demand sub-indicator (92.8, extreme greed) reflects extreme spread compression, consistent with the low absolute OAS
2. Yield Curve
- 10Y-2Y spread: +46bp | 🟢 Normal, flattening
- 10Y: 4.71% | 2Y: 4.19% | 30Y: 5.28%
- 10Y-30Y: -57bp (30Y above 10Y; normal positive slope at the long end)
- Trend: Spread narrowed 7bp (from +53bp), still positive but flattening
3. Margin Debt (FINRA)
- Latest: $1.502T (June 2026, FINRA)
- MoM: +$86B (+6.1% from May’s $1.416T)
- YoY: +49% (vs $1.008T in June 2025)
- Status: 🔴 Record high
- Reading: Margin debt hit a record for a third straight month with accelerating growth; the leverage amplifier is running at full capacity. July data is due Aug 28 — watch whether the elevated level persists
4. IPO Market
- 2026 YTD: ~93 listings (Renaissance Capital, including mid-June SpaceX, the largest IPO ever)
- Status: 🟡 Active but not yet bubble-like
5. ETF Fund Flows
- 2026 YTD net ETF inflows: ~$1.3T (through end of July; H1 alone set a $1T record)
- Status: 🔴 Record inflows
- Reading: Surging passive flows layered on top of high leverage are building systemic fragility — a reversal could trigger a stampede
Summary
- 🟢 Normal: 3 (HY OAS, IG OAS, yield curve)
- 🟡 Caution: 1 (IPO market)
- 🔴 Risk: 2 (margin debt, ETF inflows)
Conclusion: Credit spreads and the yield curve remain healthy — no imminent crisis signal. But margin debt at a record $1.5T and ETF flows approaching $1.3T YTD mean leverage and passive capital are both elevated, creating fragility. The biggest concern remains the FNG junk bond demand reading (92.8, extreme greed) — if this credit-market over-optimism turns, combined with margin-debt deleveraging, the drawdown could be violent. The composite bounced back into the greed zone on the day, but individual-stock breadth is decoupled from the index; sentiment sits at a sensitive topping-range window.