CNN Fear & Greed Sentiment Analysis 2026-08-19
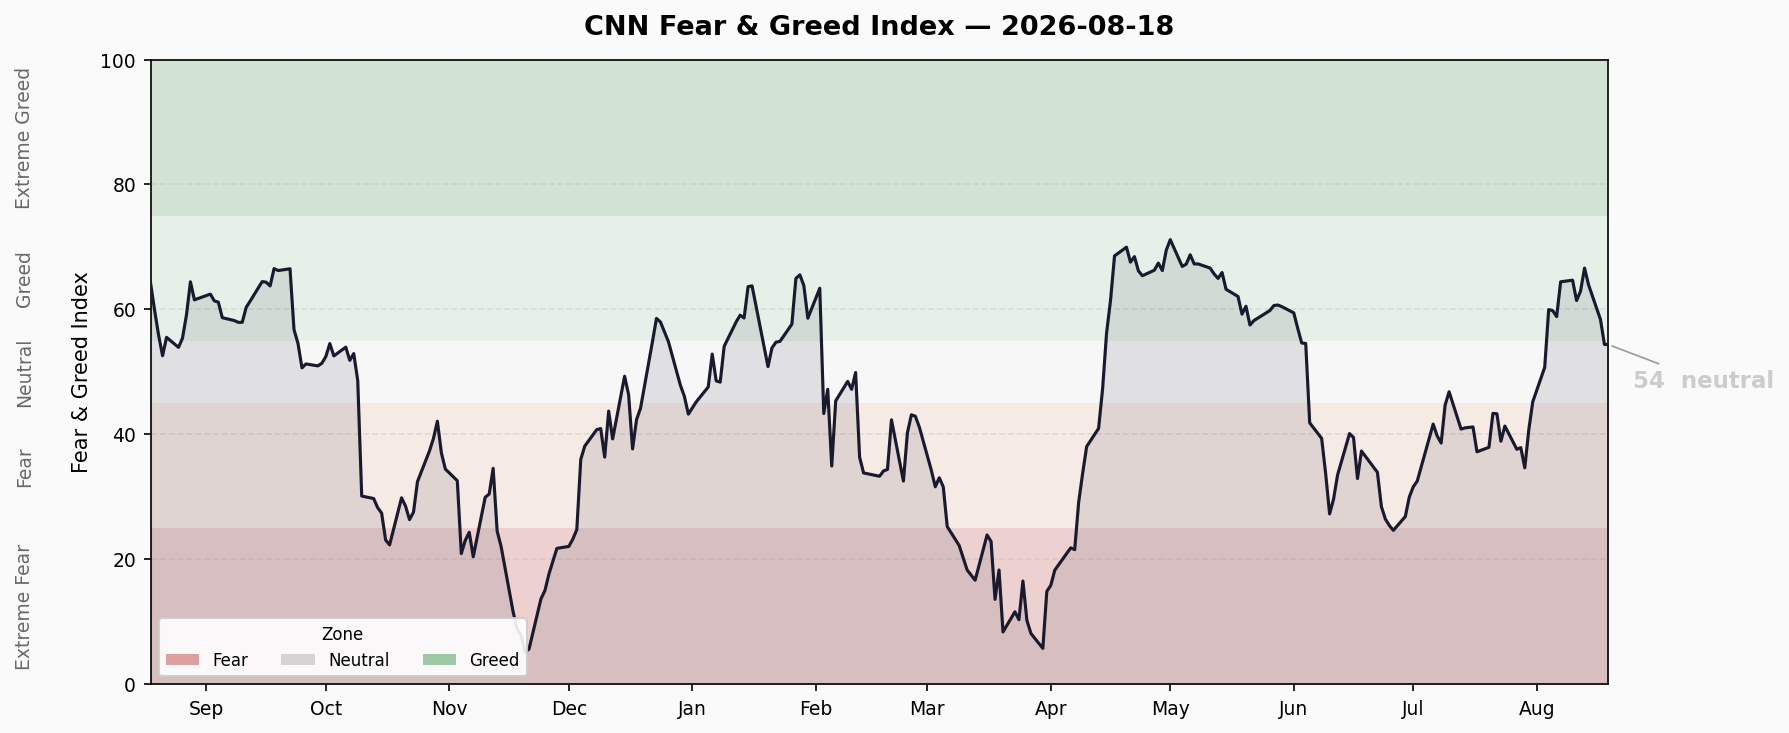
Composite index at 54.4 (Neutral), down -5.6 points from previous close, breaking below the Greed zone. Divergence persists: Junk Bond Demand at 97.4 (Extreme Greed) vs Stock Price Strength at 25.8 (Fear). HY OAS 2.70%, 10Y-2Y +53bp, FINRA Margin Debt $1.502T (June record high).
Composite Index Overview
- Current Score: 54.4 — Neutral
- Previous Close: 59.97 — Greed
- Daily Change: -5.6 points (-9.3%)
- Weekly Change: -7.0 points (vs 61.43)
- Monthly Change: +17.2 points (vs 37.23, rebound from Fear zone)
- Yearly Change: -9.8 points (vs 64.20)
The composite index fell for a third consecutive session and formally broke below the Greed-zone lower bound (55) into Neutral territory. Since the Aug 13 peak of 66.63, it has retraced 12.2 points — nearly half of the four-week rebound. The rapid bounce that briefly held the Neutral line is over; momentum has visibly weakened.
Last 10 Trading Days Trend
| Date | Score | Rating |
|---|---|---|
| 8/5 | 59.83 | Greed |
| 8/6 | 58.86 | Greed |
| 8/7 | 64.43 | Greed |
| 8/10 | 64.69 | Greed |
| 8/11 | 61.43 | Greed |
| 8/12 | 62.94 | Greed |
| 8/13 | 66.63 | Greed |
| 8/14 | 63.97 | Greed |
| 8/17 | 59.97 | Greed |
| 8/18 | 54.40 | Neutral |
Trend assessment: After ~2 weeks in the Greed zone, the decline is steepening (63.97 → 59.97 → 54.4; daily loss widening from -3.7 to -5.6 points). The index now sits just below the Neutral upper bound (55); a continued slide would test the Neutral midpoint at 50.
Seven Sub-Indicators Scan
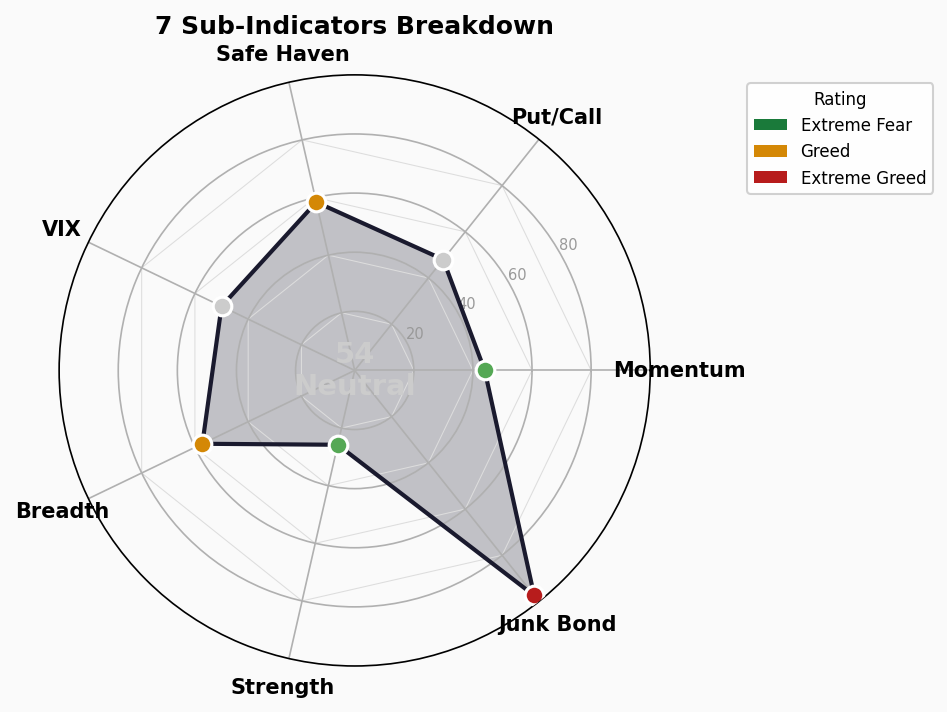
Market Momentum: 44 — Fear
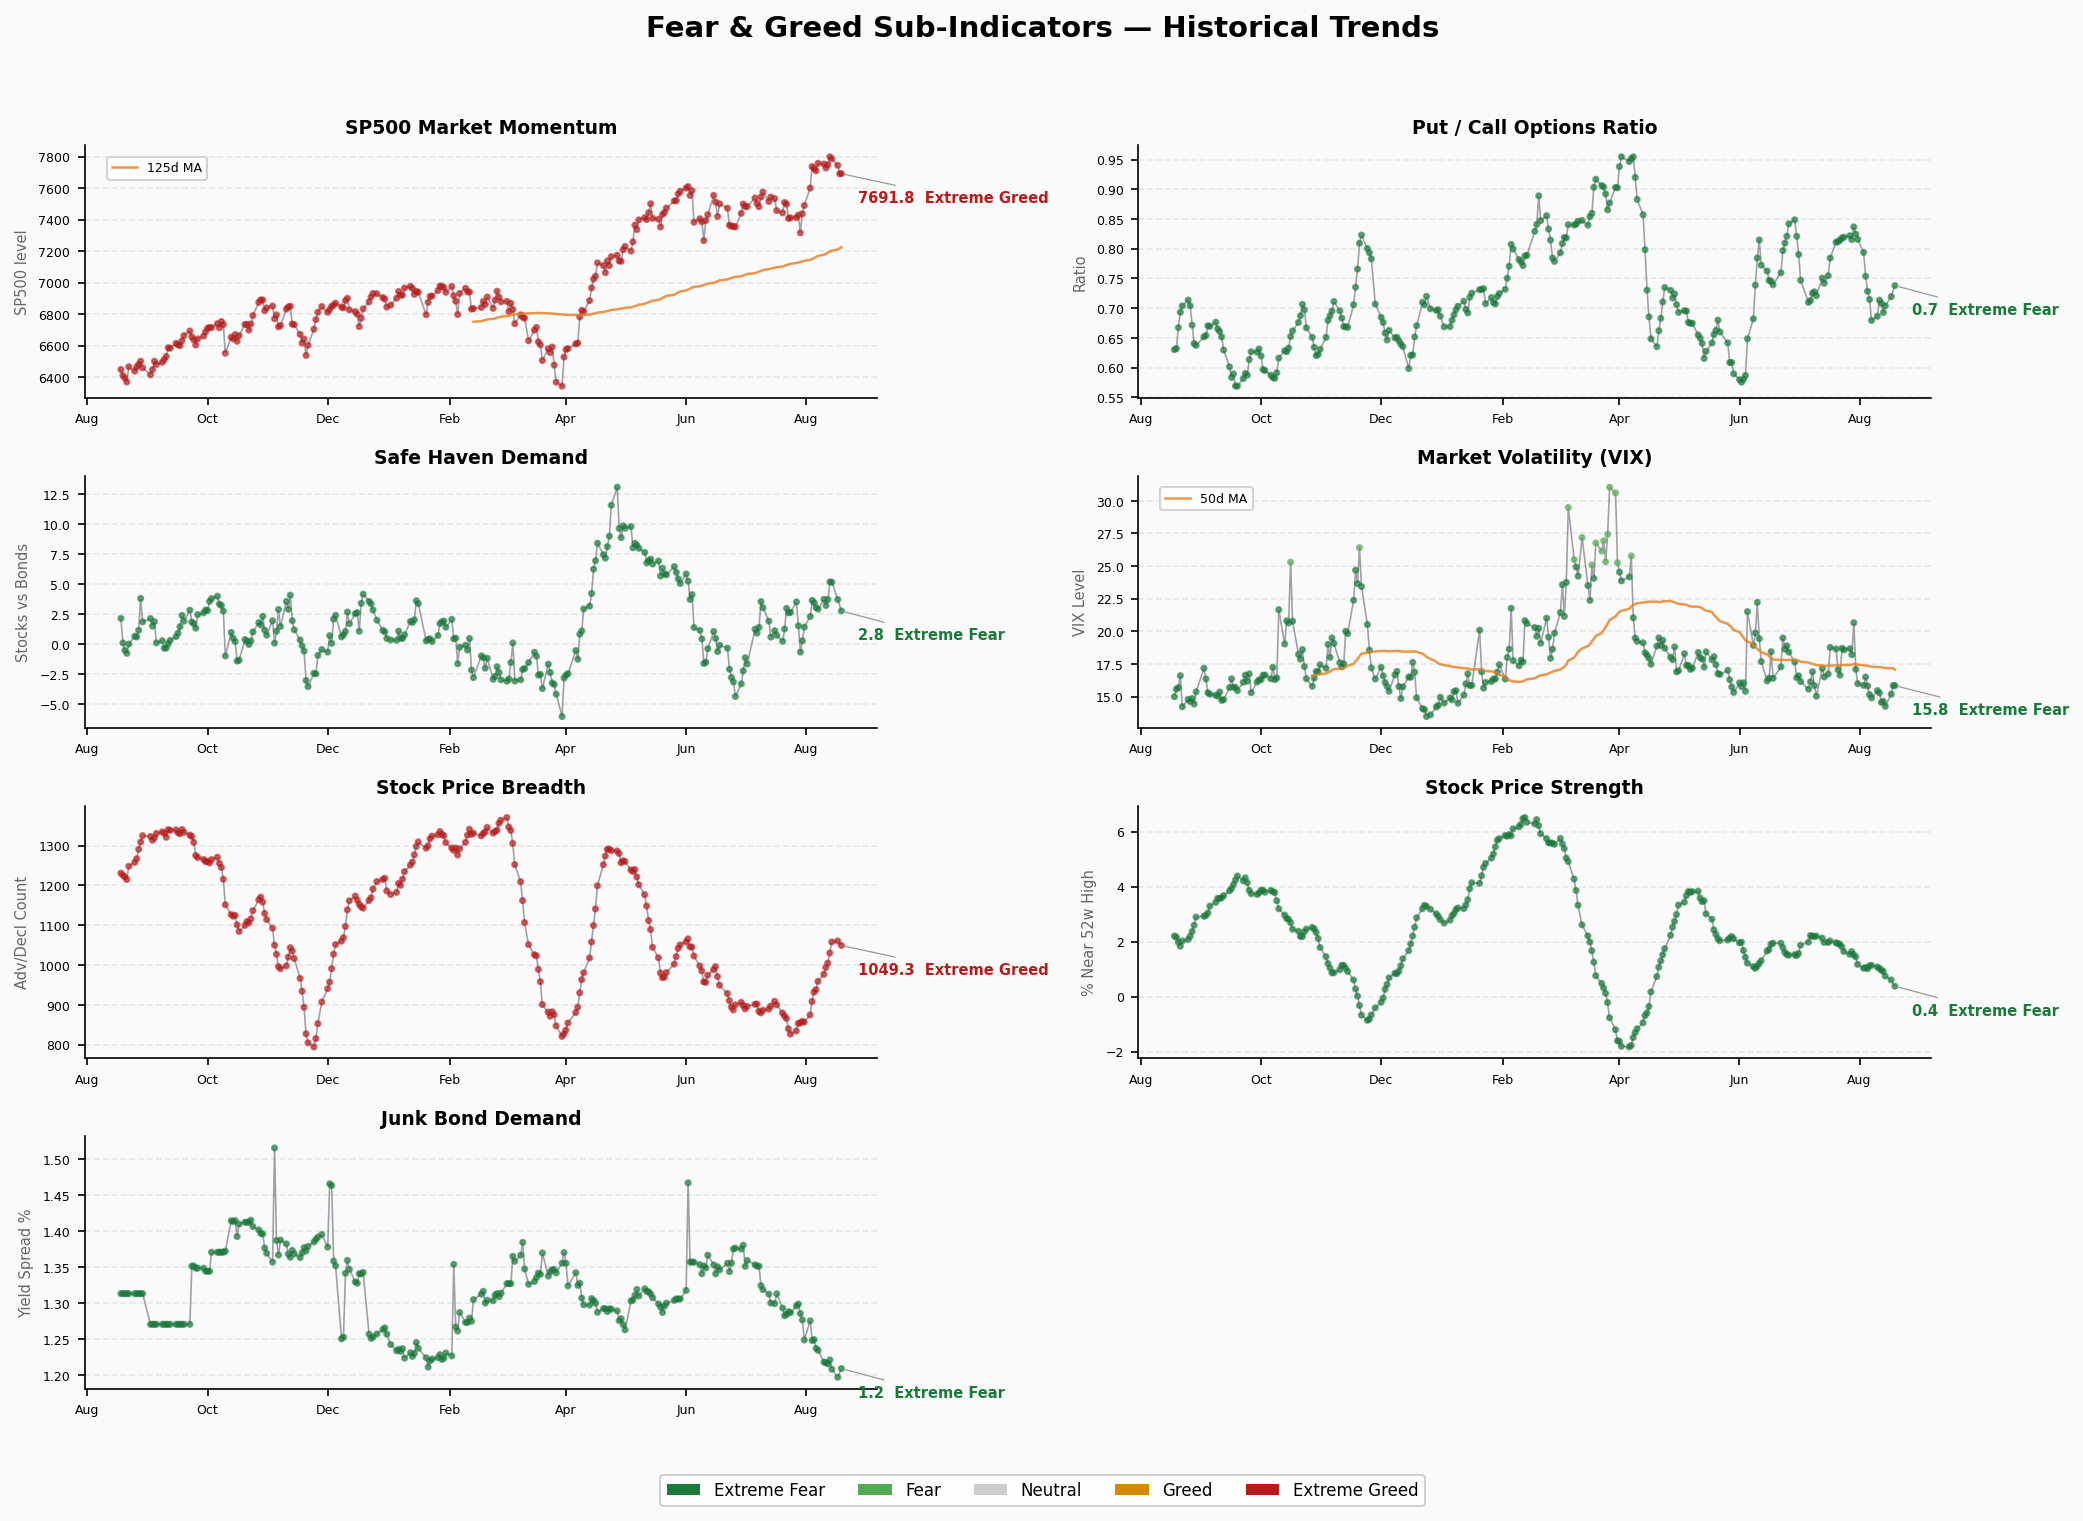
- Raw value: S&P 500 @ 7,691.76 (Aug 18), below the 125-day MA
- Direction: falling (7,745 → 7,692)
- Note: Index broke below its medium-term average; momentum turned from Neutral to weak
Stock Price Strength: 25.8 — Fear
- Raw value: 0.383 (38.3% of stocks above 50-day MA)
- Direction: deteriorating fast (0.75 → 0.61 → 0.38)
- Note: New-high momentum nearly halved within a week; individual stocks are weakening ahead of the index
Stock Price Breadth: 57.2 — Greed
- Raw value: 1,049.26 (advance/decline volume line)
- Direction: flat near highs (1,060 → 1,049)
- Note: Advancers still lead, but breadth is softening at the margin
Put/Call Options: 48 — Neutral
- Raw value: 0.738 (P/C ratio)
- Direction: rising for 3 days (0.70 → 0.72 → 0.74), hedging demand up
- Note: Options market shifted from optimistic to Neutral; put buying increasing
Market Volatility (VIX): 50 — Neutral
- Raw value: 15.84
- Direction: rising (15.19 → 15.84)
- Note: VIX ticking up but still Neutral; no panic yet, though no longer at lows
Junk Bond Demand: 97.4 — Extreme Greed
- Raw value: 1.21 (HY/IG spread ratio)
- Direction: roughly flat (1.20 → 1.21)
- Note: Credit spreads remain extremely compressed; risk appetite stays elevated — a classic late-cycle signal
Safe Haven Demand: 58.4 — Greed
- Raw value: 2.79% (20-day excess return, stocks vs bonds)
- Direction: narrowing fast (5.17 → 3.73 → 2.79)
- Note: Equities’ relative advantage over bonds is shrinking; defensive rotation is intensifying
Structural Divergence Analysis
Core divergence: Junk Bond Extreme Greed (97.4) vs Stock Price Strength Fear (25.8)
The ~72-point gap persists for a second day and is widening:
- Fixed income: Spreads compressed to extremes; investors chase yield at any credit risk
- Equities: Only 38% of stocks above the 50-day MA; breadth extremely narrow
- Historical read: Credit markets ignoring risk while equities internally break down — a dislocation historically seen near market tops. Credit complacency is itself the most dangerous lagging signal
Secondary divergences:
- The composite fell 12.2 points over 3 days while junk bond demand stayed pinned → credit is more optimistic than equities; the gap is not closing
- Safe haven demand fell from 5.17 to 2.79 → bonds are now outperforming stocks; if sustained, rotation will further drain equity liquidity
- Momentum (44) and price strength (25.8) both in Fear while breadth (57.2) still shows Greed → surface breadth masks an index propped up by a few mega-caps
Trend Assessment
- Zone: Just broke below the Greed lower bound (55) into the top of Neutral (45-55)
- Direction: Three straight declines since the Aug 13 peak of 66.63 with an accelerating slope; the rebound structure is broken
- Key levels to watch:
- A break below 50 (Neutral midpoint) would confirm an upgrade in correction severity, targeting sub-45 Fear territory
- If Junk Bond Demand (97.4) starts to roll over, credit turning hawkish would amplify equity drawdowns
- Further deterioration in Stock Price Strength (25.8) would deepen the divergence and raise correction risk
- Historical context: One month ago the index was in Fear (37.23). This +17.2-point rebound was driven by credit easing and passive inflows rather than earnings or breadth — today’s slide confirms the low quality of that rally
🚨 Market Crash Precursor Dashboard
1. Credit Spreads
- High-Yield OAS: 2.70% | 🟢 Normal (<3% Normal | 3-5% Watch | 5-8% Panic | >8% Crisis)
- Investment-Grade OAS: 0.81% | 🟢 Normal
- Trend: +3bp vs prior (2.67% → 2.70%); modest widening but still low
- Note: The FNG Junk Bond Demand sub-indicator (97.4, Extreme Greed) reflects the same ultra-tight absolute spread
2. Yield Curve
- 10Y-2Y Spread: +53bp | 🟢 Normal/Steep
- 10Y: 4.72% | 2Y: 4.19% | 30Y: 5.31%
- 10Y-30Y: -59bp (30Y above 10Y; long end normally upward-sloping)
- Trend: Short-end spread flat; long-end yields ticked up (30Y +6bp); curve shape healthy
3. FINRA Margin Debt
- Latest: $1.502T (June 2026, FINRA)
- MoM: +$86B (+6.1% from May’s $1.416T)
- YoY: +49% (vs $1.008T in June 2025)
- Status: 🔴 Record all-time high
- Read: Margin debt hit another record and accelerated in June; the leverage amplifier is running at full load. July data expected around Aug 28 — watch whether the elevated level persists
4. IPO Market
- 2026 YTD: ~73 deals (Renaissance Capital)
- Status: 🟡 Active but not frothy
5. ETF Fund Flows
- 2026 YTD ETF net inflows: ~$856B (record)
- Status: 🔴 Inflows at record highs
- Read: Passive inflows plus high leverage concentrate systemic risk; a reversal would invite a stampede
Summary
- 🟢 Normal: 3 (HY OAS, IG OAS, Yield Curve)
- 🟡 Watch: 1 (IPO market)
- 🔴 Risk: 2 (Margin debt, ETF inflows)
Bottom line: Credit spreads and the yield curve remain healthy — no imminent crisis signal. But margin debt at a record $1.5T and record ETF inflows leave leverage and passive money both elevated, a key fragility. The biggest near-term concern is FNG’s Junk Bond Demand (97.4, Extreme Greed): if credit optimism turns, combined with margin deleveraging, the drawdown intensity could exceed expectations. With the composite down three straight days and back below the Greed zone, sentiment is at a sensitive turning window.