CNN Fear & Greed Sentiment Analysis 2026-08-18
Composite index at 59.97 (Greed), down -5.0 points from previous close. Sub-indicator divergence widening: Junk Bond Demand at 99 (Extreme Greed) vs Stock Price Strength at 27.4 (Fear). HY OAS 2.67%, 10Y-2Y +53bp, FINRA Margin Debt $1.417T.
Composite Index Overview
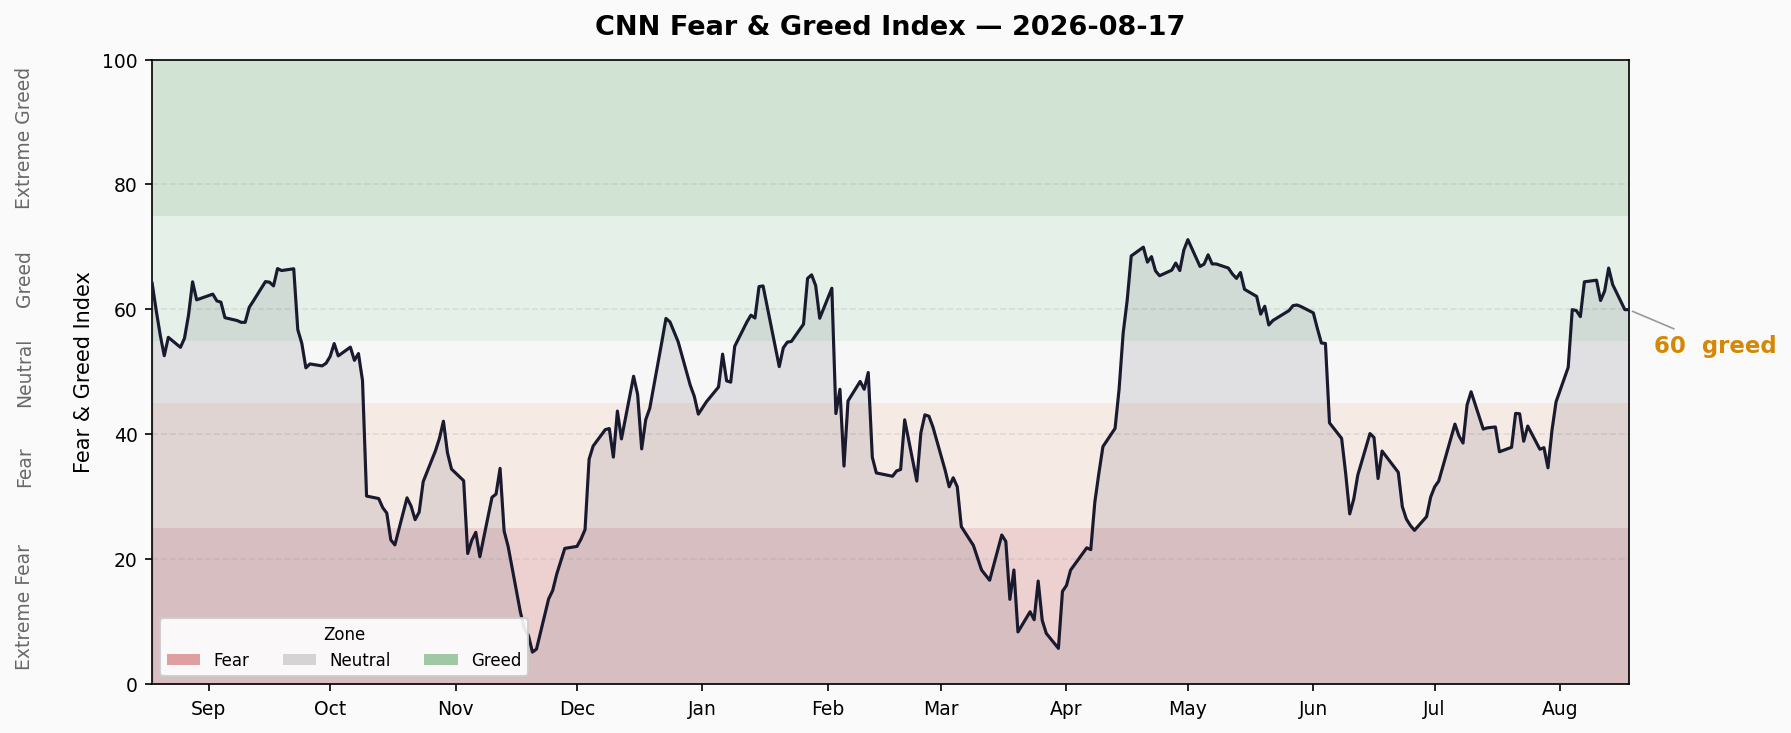
- Current Score: 59.97 — Greed
- Previous Close: 64.97 — Greed
- Daily Change: -5.0 points (-7.7%)
- Weekly Change: -4.7 points (vs 64.69)
- Monthly Change: +22.7 points (vs 37.23, rebound from Fear zone)
- Yearly Change: -3.6 points (vs 63.54)
The composite index rebounded sharply from mid-July Fear territory (neutral 50.74 on Aug 3) into the Greed zone, peaking at 66.63 on Aug 13 before pulling back for 3 consecutive sessions, now back to Aug 4 levels.
Last 10 Trading Days Trend
| Date | Score | Rating |
|---|---|---|
| 8/3 | 50.74 | Neutral |
| 8/4 | 59.97 | Greed |
| 8/5 | 59.83 | Greed |
| 8/6 | 58.86 | Greed |
| 8/7 | 64.43 | Greed |
| 8/10 | 64.69 | Greed |
| 8/11 | 61.43 | Greed |
| 8/12 | 62.94 | Greed |
| 8/13 | 66.63 | Greed |
| 8/14 | 63.97 | Greed |
| 8/17 | 59.97 | Greed |
Trend assessment: The index has been in the Greed zone for ~2 weeks, pulling back from the Aug 13 peak of 66.63. The current decline rate (-3.7 pts/day) exceeds the prior rally rate (+2.8 pts/day), suggesting waning rebound momentum.
Seven Sub-Indicators Scan
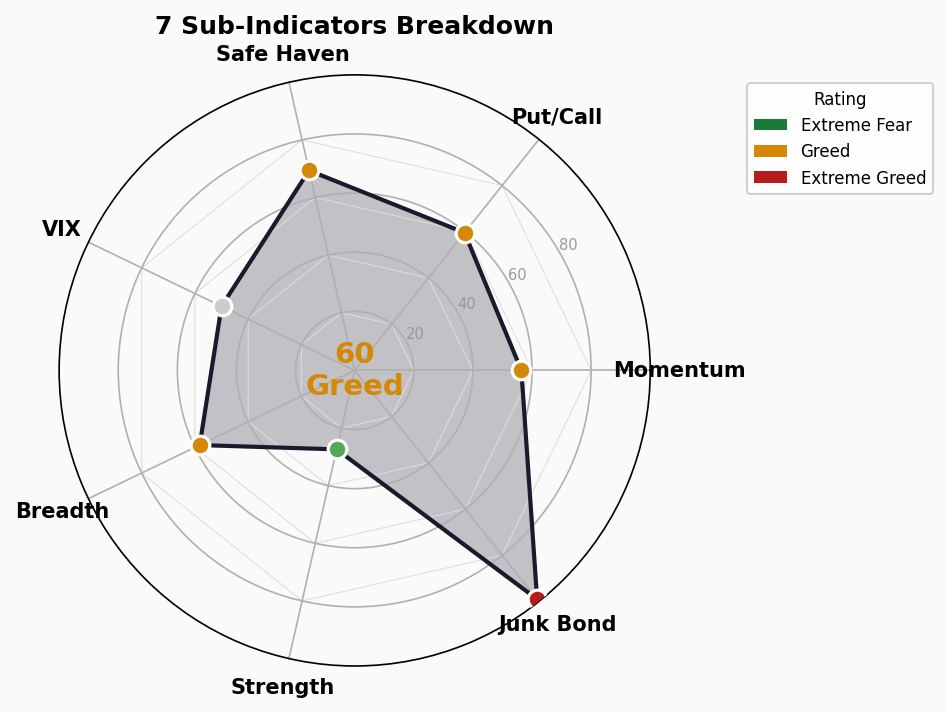
Market Momentum (S&P 500): 56.4 — Greed
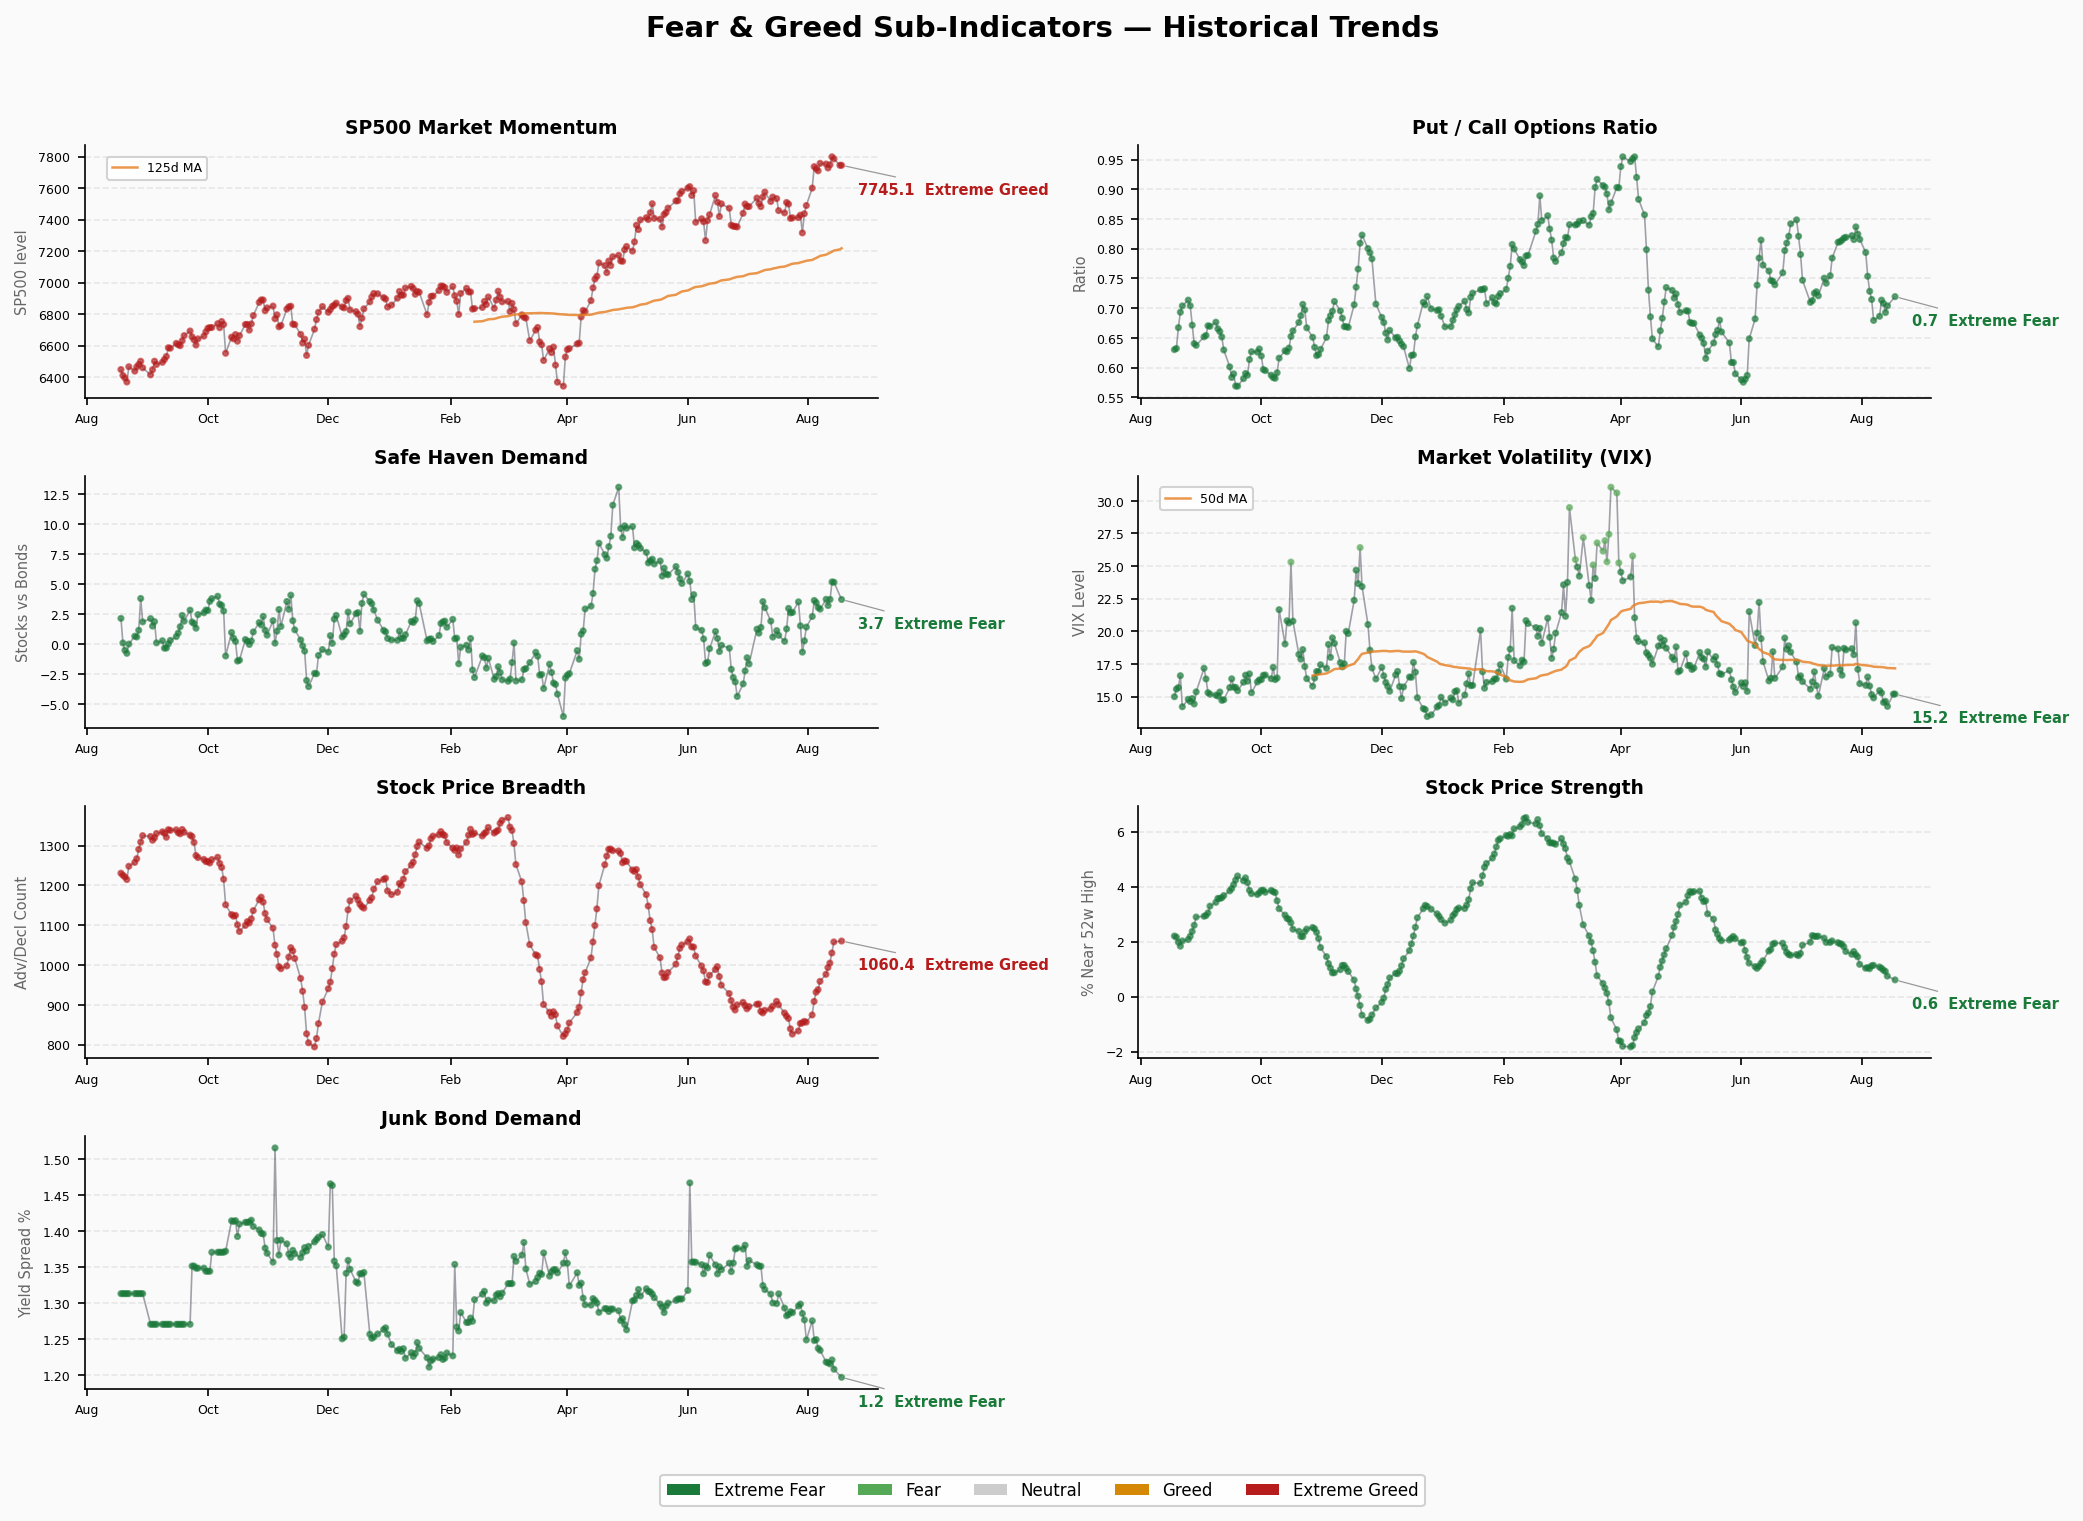
- Raw value: S&P 500 @ 7,745 (above 125-day MA)
- Direction: Flat, slight pullback over last 3 sessions
- Read: Index above medium-term average, but momentum fading at the margin
Stock Price Strength: 27.4 — Fear
- Raw value: 0.61 (new highs/new lows ratio)
- Direction: Declining (0.92 → 0.75 → 0.61)
- Read: Very few stocks making new highs — bearish divergence from index levels
Stock Price Breadth: 58.2 — Greed
- Raw value: 1,060.44 (advance/decline line)
- Direction: Slightly improving
- Read: Advancing issues dominate; market breadth acceptable
Put/Call Options: 59.6 — Greed
- Raw value: 0.72 (P/C ratio)
- Direction: Slightly rising (0.69 → 0.70 → 0.72), modest put buying increase
- Read: Options market lean bullish, but put activity edging up
Market Volatility (VIX): 50 — Neutral
- Raw value: 15.19
- Direction: Stable
- Read: VIX in neutral territory; no significant fear signal
Junk Bond Demand: 99 — Extreme Greed
- Raw value: 1.20% (HY spread)
- Direction: Further tightening (1.22 → 1.21 → 1.20)
- Read: Investors aggressively chasing yield; credit spreads extremely compressed — classic late-cycle signal
Safe Haven Demand: 69.4 — Greed
- Raw value: 3.74% (stocks vs bonds, 20-day excess return)
- Direction: Declining (5.20 → 5.17 → 3.74), safe-haven assets recovering
- Read: Stocks still outperforming bonds, but the gap is narrowing
Structural Contradiction Analysis
Core Contradiction: Junk Bond Extreme Greed (99) vs Stock Price Strength Fear (27.4)
This is the most significant structural divergence currently. The 72-point extreme gap implies:
- Fixed income market: Credit spreads compressed to the extreme; investors chasing yield at any cost — extremely high risk appetite
- Equity market: Very few stocks making new highs; market breadth narrowing; concentration risk elevated
- Historical parallel: This combination has historically appeared near market tops — credit markets not pricing risk while equity internals already deteriorating
Secondary contradictions:
- Composite index declining 5 days (66.63 → 59.97) while junk bond spreads continue to tighten → credit market more optimistic than equity market
- Safe haven demand dropping from 5.20 to 3.74 → bonds beginning to outperform stocks, suggesting defensive rotation may be underway
Trend Assessment
- Zone: Greed territory (55-67), persisting for ~2 weeks
- Direction: Pulling back from Aug 13 peak of 66.63, down 3 consecutive sessions
- Key watchpoints:
- A break below 55 (neutral threshold) would confirm the rebound is over
- If Junk Bond Demand (99) starts declining, it may signal credit market turning hawkish
- If Stock Price Strength (27.4) deteriorates further, deepening divergence increases correction risk
- Historical context: One month ago (37.23) was in Fear territory; the +22.7-point rebound is rapid but low-quality (driven by credit markets rather than breadth improvement)
🚨 Crisis Precursor Indicators Dashboard
1. Credit Spreads
- HY OAS: 2.67% | 🟢 Normal (<3% normal | 3-5% caution | 5-8% panic | >8% crisis)
- IG OAS: N/A (FRED data fetch failed)
- Trend: Stable, maintaining low levels
- Note: FNG junk bond demand sub-indicator shows spread at just 1.20% — extremely compressed
2. Yield Curve
- 10Y-2Y Spread: +53bp | 🟢 Normal/Steep
- 10Y: 4.68% | 2Y: 4.17% | 30Y: 5.25%
- 10Y-30Y: -57bp (30Y above 10Y, normal upward slope at long end)
- Trend: Short-end spread normal; curve shape healthy
3. Margin Debt (FINRA)
- Latest: $1.417T (July 2026, FINRA)
- MoM: -$85B (-5.7% from June peak of $1.502T)
- YoY: +40.6% (vs July 2025 $1.008T)
- Status: 🔴 Historically elevated
- Read: Margin debt declined from June record but remains far above historical norms. Leverage levels are the key amplifier of systemic fragility
4. IPO Market
- Renaissance IPO ETF (IPO): YTD +25% (as of Aug 14)
- Q2 2026: IPO market strong recovery, AI/infrastructure themes in demand
- Status: 🟡 Active but not frothy
5. ETF Fund Flows
- 2026 YTD ETF net inflows: ~$856B (record)
- Status: 🔴 Record-high fund inflows
- Read: Passive capital continuing to pour in, combined with high leverage, elevates systemic risk
Summary
- 🟢 Normal: 2 (credit spreads, yield curve)
- 🟡 Caution: 1 (IPO market)
- 🔴 Risk: 2 (margin debt, ETF inflows)
Bottom line: Credit spreads and the yield curve show no imminent crisis signal, but the extreme levels of margin debt and fund inflows mean that once credit spreads begin to widen, the deleveraging intensity could exceed expectations. The FNG junk bond demand sub-indicator (99, Extreme Greed) resonates with the elevated margin debt (🔴) in the crisis dashboard — this is the most concerning combination to watch currently.