CNN Fear & Greed Sentiment Analysis 2026-08-17
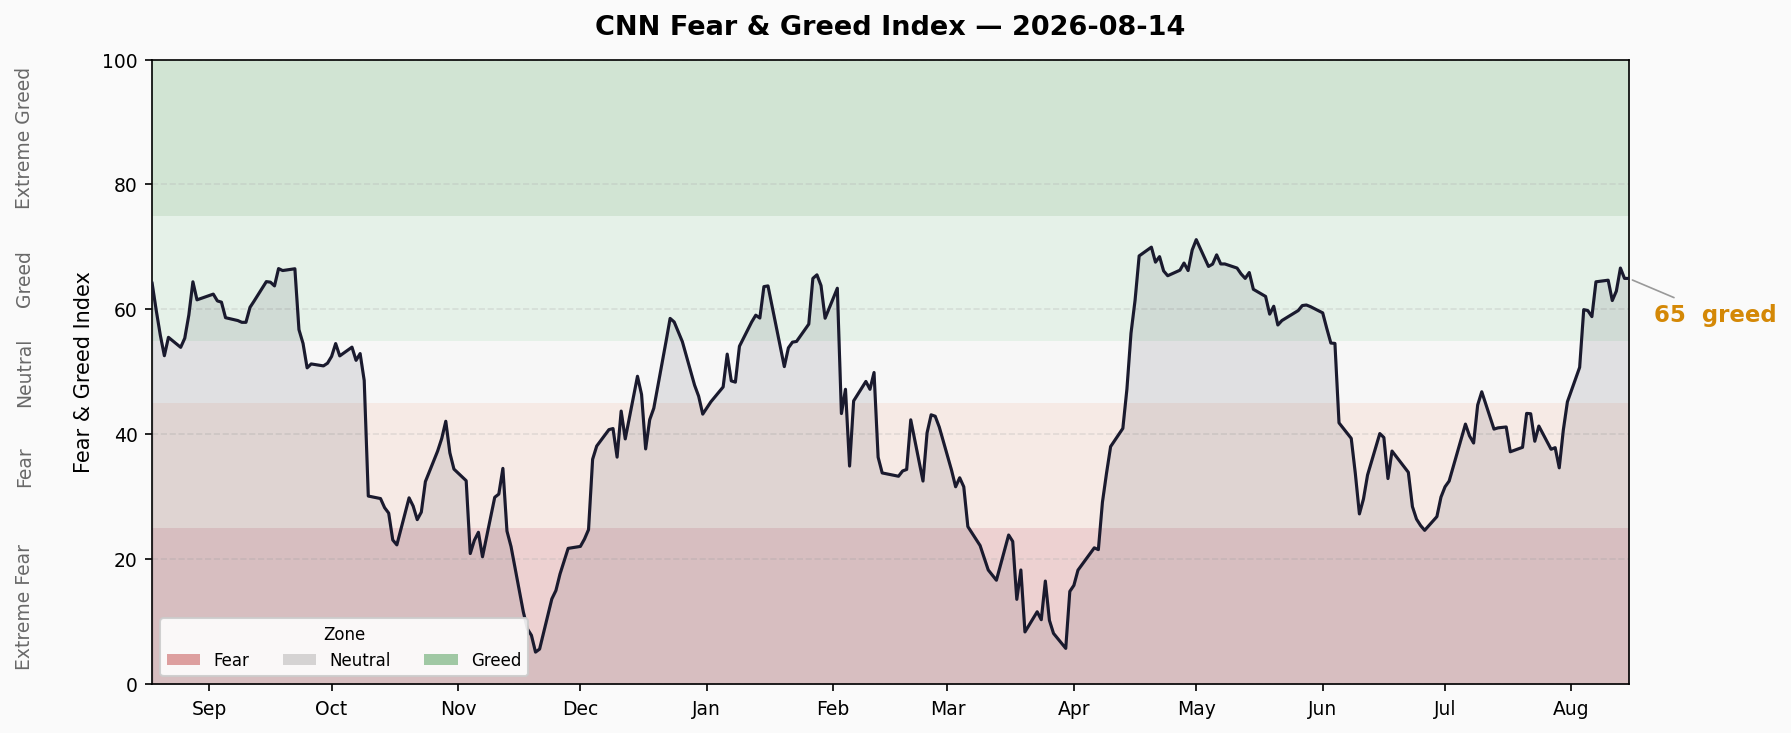
Composite index at 65.0 (Greed), down -1.2 pts from prior day's 66.1. Monthly change +23.9 pts, a massive rally from the Fear zone. Among 7 sub-indicators, Junk Bond Demand at 98.6 (Extreme Greed) vs Stock Price Strength at 28.6 (Fear) creates a 70-point structural divergence — narrow market breadth against extreme risk appetite. Credit spreads remain low, yield curve normally steepened, but FINRA margin debt hits $1.50T all-time high with ETF YTD inflows near $1.3T.
Composite Index Overview
Latest CNN Fear & Greed composite index: 65.0 (Greed), data as of 2026-08-14 close.
- Current reading: 65.0 (Greed)
- Previous close: 66.1 (Greed) → Daily change -1.2 pts
- 1 week ago: 64.4 → Weekly change +0.5 pts
- 1 month ago: 41.1 (Fear) → Monthly change +23.9 pts 📈
- 1 year ago: 63.3 → Yearly change +1.7 pts
The monthly change is the most striking — surging from Fear at 41.1 to Greed at 65.0, a 58% jump reflecting a sharp sentiment recovery.
10-Day Trend
| Date | FNG | Rating | Change |
|---|---|---|---|
| 8/4 | 60.0 | Greed | — |
| 8/5 | 59.8 | Greed | -0.2 |
| 8/6 | 58.9 | Greed | -0.9 |
| 8/7 | 64.4 | Greed | +5.5 |
| 8/10 | 64.7 | Greed | +0.3 |
| 8/11 | 61.4 | Greed | -3.3 |
| 8/12 | 62.9 | Greed | +1.5 |
| 8/13 | 66.6 | Greed | +3.7 |
| 8/14 | 65.0 | Greed | -1.6 |
Trend characteristics: 9 consecutive trading days in the Greed zone (55-74). Hit a local low of 58.9 on 8/6, rallied to a peak of 66.6 on 8/13, then pulled back to 65.0. Net +5.0 points over 10 days, with the upward slope flattening.
7 Sub-Indicator Scan
| Indicator | Score | Rating | Raw Value | Prior Day | Change |
|---|---|---|---|---|---|
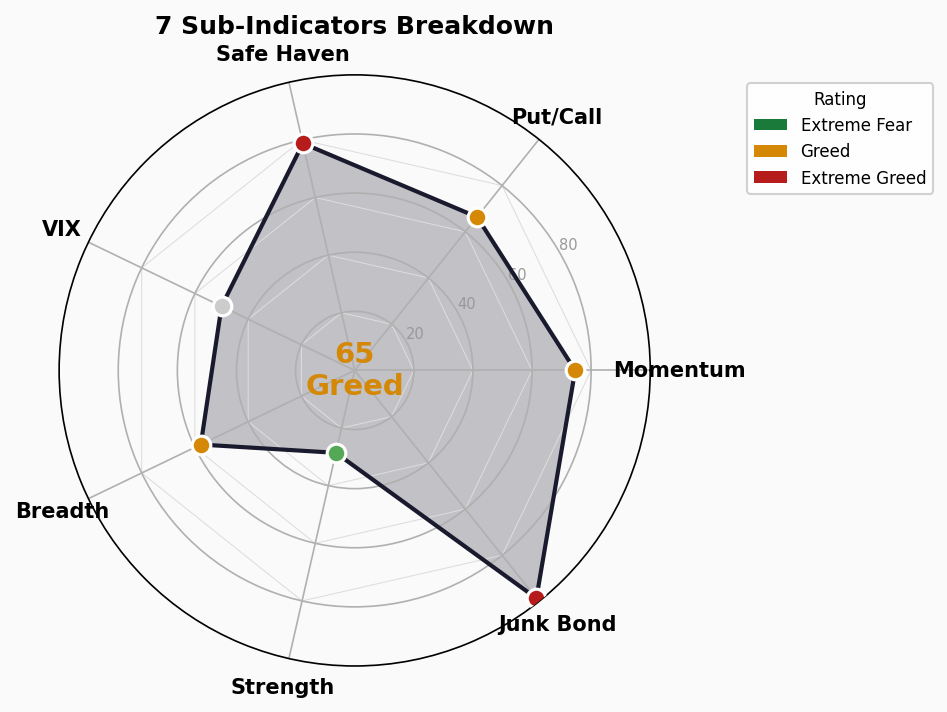
| Market Momentum (S&P 500) | 74.6 | Greed | 7,786 | 7,799 | ↓ -13 |
| Stock Price Strength | 28.6 | Fear | 0.75% | 0.92% | ↓ -0.17pp |
| Stock Price Breadth | 57.8 | Greed | 1,058 | 1,030 | ↑ +28 |
| Put/Call Options | 66.4 | Greed | 0.70 | 0.69 | ↑ +0.01 |
| Market Volatility (VIX) | 50.0 | Neutral | 14.25 | 14.63 | ↓ -0.38 |
| Junk Bond Demand | 98.6 | Extreme Greed | 1.21% | 1.22% | ↓ -0.01pp |
| Safe Haven Demand | 78.8 | Extreme Greed | 5.17 | 5.20 | ↓ -0.03 |
Indicator-by-Indicator Breakdown
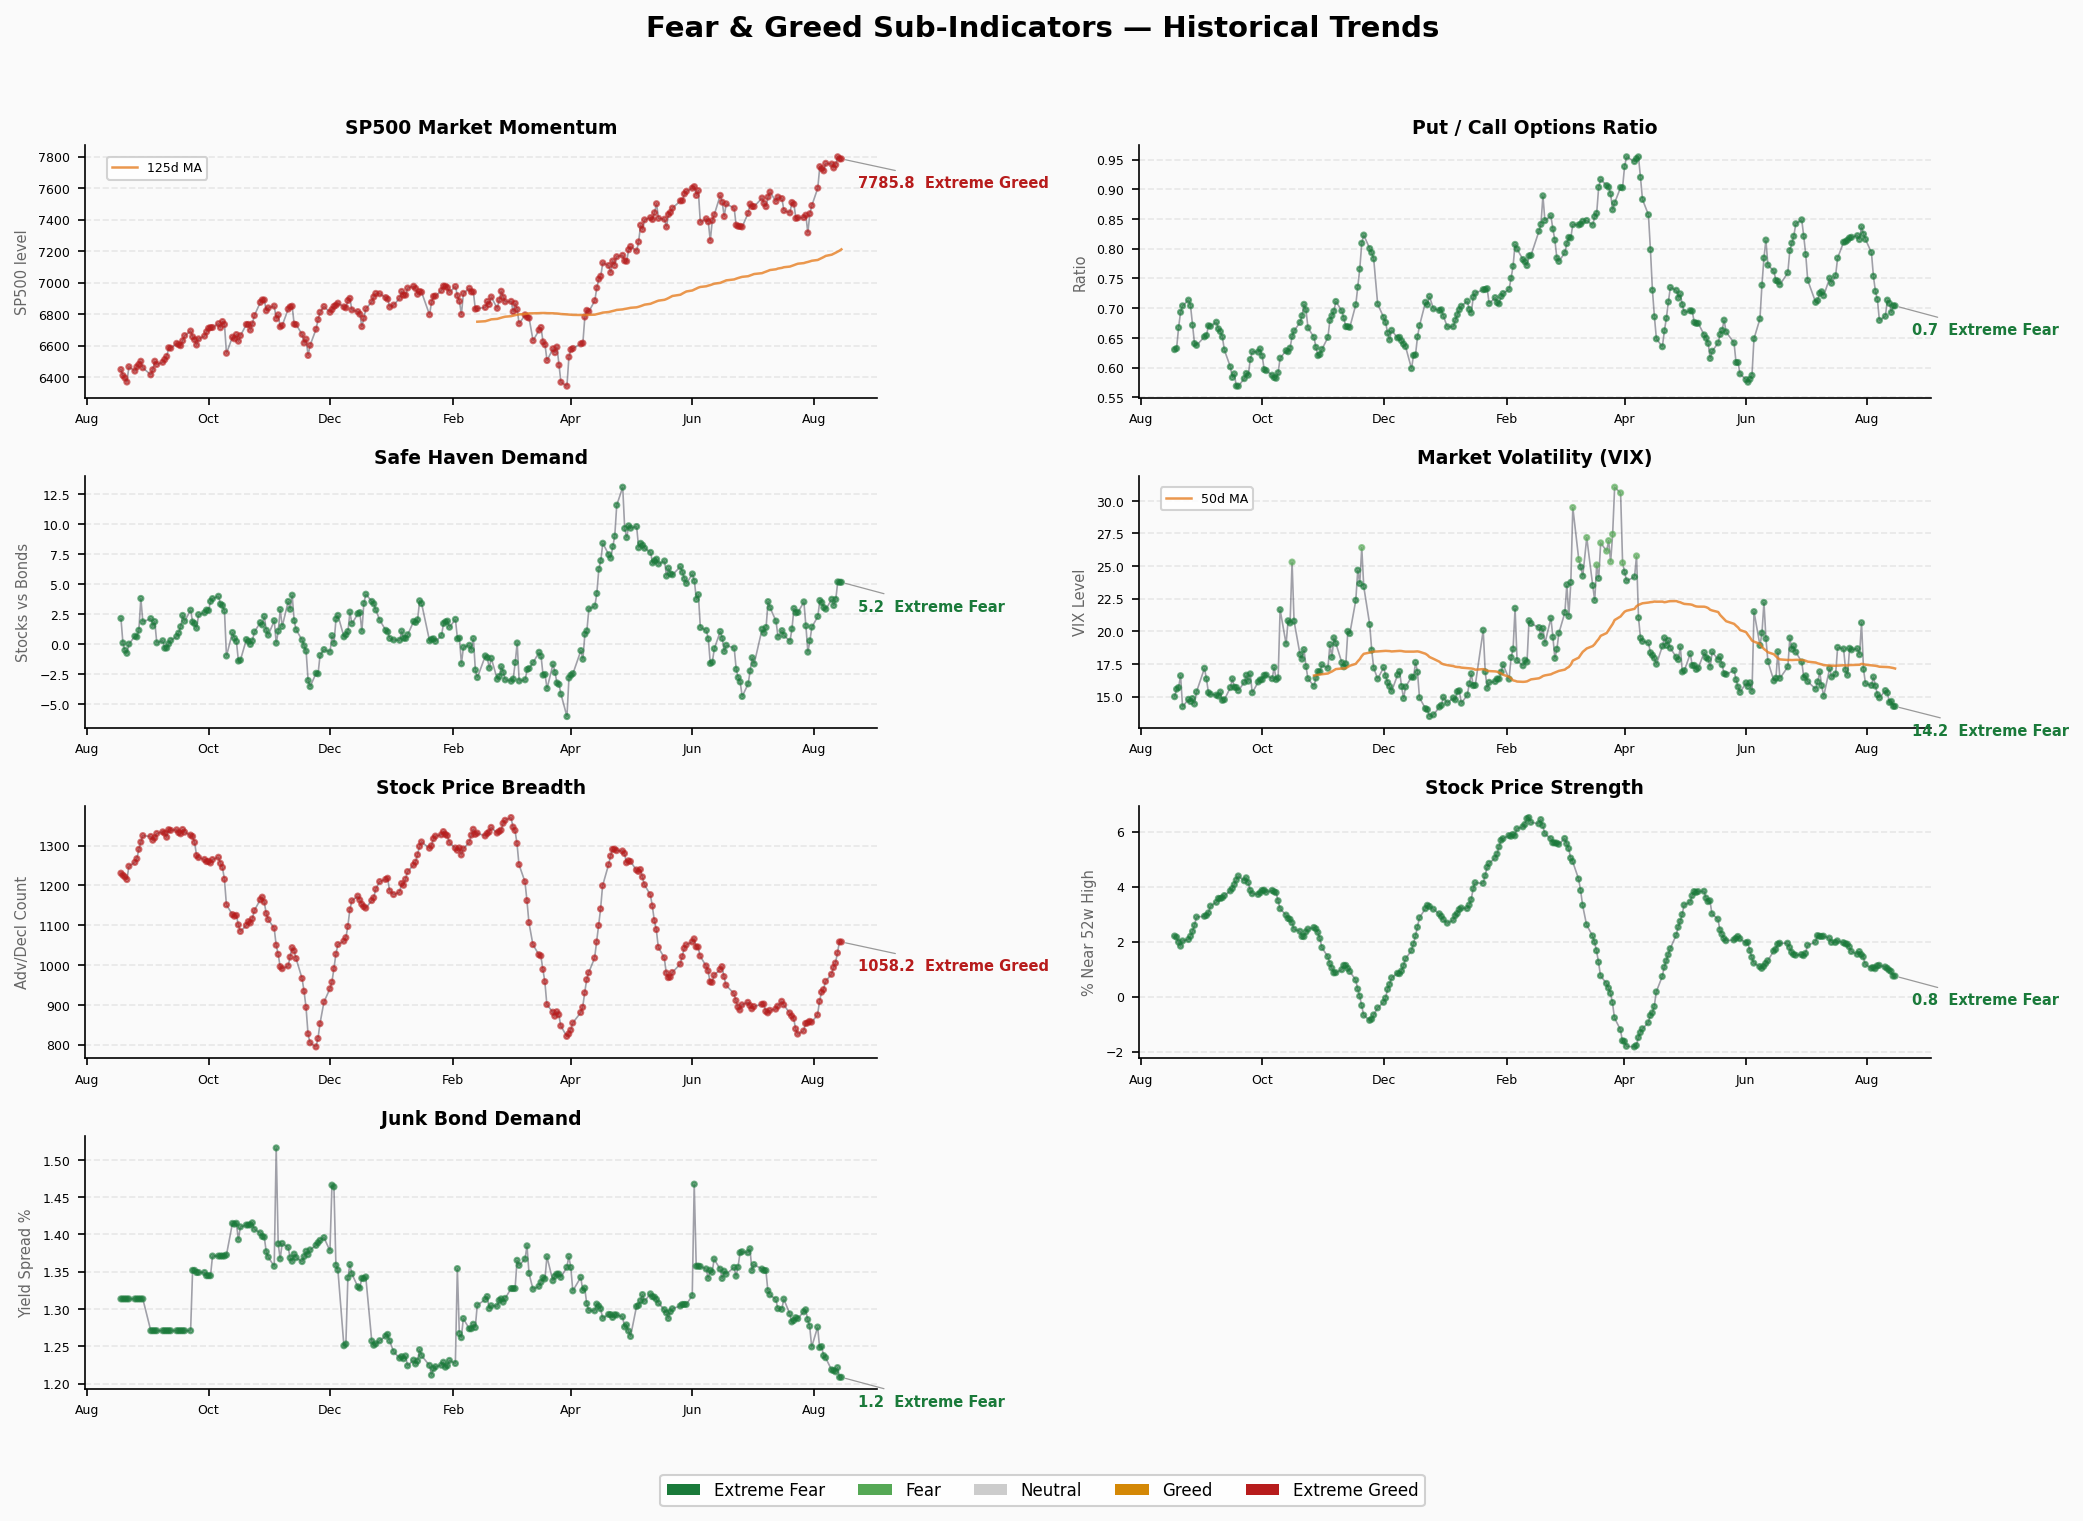
1. Market Momentum — 74.6 (Greed) S&P 500 at 7,786, above its 125-day moving average. Momentum remains positive but down 13 points from the prior day. This indicator has been in Greed/Extreme Greed territory since early June.
2. Stock Price Strength — 28.6 (Fear) Only 0.75% of stocks are hitting 52-week highs, down from 0.92% the prior day. This is the weakest link among the seven sub-indicators — the index is rising, but very few individual stocks are making new highs. A clear signal of narrowing market breadth.
3. Stock Price Breadth — 57.8 (Greed) McClellan Oscillator at 1,058, improved from 1,030, indicating broader participation in advances. However, the contradiction with Stock Price Strength is noteworthy — breadth is improving but new highs are extremely rare, suggesting the rally is driven more by oversold bounces than trend breakouts.
4. Put/Call Options — 66.4 (Greed) P/C ratio at 0.70, up slightly from 0.69. Call activity still dominates over puts, with bullish sentiment prevailing. Change is negligible; the indicator is stable.
5. Market Volatility (VIX) — 50.0 (Neutral) VIX at 14.25, down from 14.63. Volatility is low and the market is pricing in very calm conditions. The score sits exactly at the Neutral 50.0, though an absolute VIX level around 14 is historically on the complacent side.
6. Junk Bond Demand — 98.6 (Extreme Greed) HY credit spread at just 1.21%, tightened from 1.22%. Investors are chasing junk bonds to near-maximum levels — the spread is so thin that the market is pricing essentially zero credit risk. This is the most extreme indicator in the entire gauge.
7. Safe Haven Demand — 78.8 (Extreme Greed) Stocks’ excess return over Treasuries at 5.17. Investors are abandoning safe havens entirely, with capital flooding into risk assets.
Structural Contradiction Analysis
Extreme Values (>80 or <20)
- 🔴 >80: Junk Bond Demand 98.6 — near maximum, extreme greed
- >75 but <80: Safe Haven Demand 78.8 — approaching the extreme greed boundary
- <20: None
Key Divergence Signals
1. Junk Bond Greed vs Stock Price Strength Fear — 70-Point Gap Junk Bond Demand 98.6 vs Stock Price Strength 28.6 — a 70-point structural tear. Investors are buying junk bonds at near-zero spreads (extreme risk appetite), yet only 0.75% of stocks are hitting new highs (extremely narrow breadth). This combination is the classic “too much money, too few targets” — liquidity is flooding risk assets, but leadership is highly concentrated. Historically, similar divergences have appeared multiple times in late-cycle environments.
2. Momentum Greed vs Breadth Fear — Index Illusion Market Momentum 74.6 vs Stock Price Strength 28.6. The S&P 500 is well above its moving average, but fewer than 1% of stocks are making new highs. The index is being carried by a handful of mega-caps — surface prosperity masking deteriorating individual stock participation.
3. Low Safe Haven Demand vs Neutral VIX — Pricing Contradiction Safe Haven Demand 78.8 (near-zero demand for safe havens) vs VIX 50.0 (Neutral). If safe haven demand is truly this low, VIX should be lower (more greedy). VIX sitting at neutral suggests the options market is still pricing in some tail risk — a subtle cognitive gap with the spot market’s extreme optimism.
Trend Assessment
Duration in Zone
- Greed zone (55-74): ~9 trading days (since 8/4)
- Prior phase: Mid-to-late July in Neutral zone (45-54) for ~2 weeks
- Earlier: June through mid-July in Fear/Extreme Fear, with FNG dropping to 5-8 at its lows
Turning Indicators
- Short-term: Peaked at 66.6 on 8/13, pulled back to 65.0 (-1.6 pts), within normal oscillation
- Medium-term: Monthly +23.9 pts is an extremely steep rally; sustainability is questionable
- Key watch: Stock Price Strength persisting in Fear zone (28.6) — if it deteriorates further, it could drag the composite down
- Supporting factors: Credit spreads extremely low (2.71%), VIX low (14.25) — no systemic risk signals yet
Assessment: Short-term trend remains bullish, but the composite is encountering resistance in the 65-67 range with limited upside. The key risk is not a crash but a “slow grind at the top” — extreme junk bond greed and narrowing market breadth suggest the rally may gradually exhaust momentum through high-level consolidation.
🚨 Crisis Precursor Dashboard
1. Credit Spreads
- HY OAS: 2.71% | 🟢 Normal
- IG OAS: 0.79% | 🟢 Normal
- Trend: HY -1bp day-over-day (2.72% → 2.71%), spreads continuing to tighten, no credit market stress
- Thresholds: HY <3% Normal | 3-5% Caution | 5-8% Panic | >8% Crisis
Credit spreads are the market’s most reliable “canary in the coal mine.” HY OAS at 2.71% is in the historically low range, well below the 3% caution threshold. Investors are pricing essentially zero credit risk — this reflects abundant market confidence but also underlying fragility, as spread widening often marks the inflection point for risk appetite.
2. Yield Curve
- 10Y-2Y Spread: +51bp | 🟢 Normal (steepening)
- 10Y: 4.63% | 2Y: 4.15% | 30Y: 5.21%
- 10Y-30Y: -58bp (30Y above 10Y, normal term premium)
- Trend: Yield curve has fully un-inverted, 10Y-2Y back to positive +51bp
The un-inversion of the yield curve is a significant signal that recession fears have faded. The prolonged inversion during 2024-2025 triggered widespread recession warnings. The curve’s return to normal steepening — with short-end rates falling and long-end holding — reflects market consensus around a soft landing.
3. Margin Debt
- FINRA Margin Debt: $1.502T (June 2026 data, updated 2026-07-28)
- Month-over-month: +6.1% ($1.416T → $1.502T)
- Year-over-year: +49.0% (from $1.008T one year ago)
- As % of GDP: 4.63%, all-time high (long-term average 3.05%)
- Status: 🔴 All-time high territory
A +49% YoY growth rate in margin debt is historically rare. In FINRA data (starting 1997), only three prior clusters saw comparable growth rates: late 1999-early 2000 (dot-com bubble), mid-2007 (pre-GFC), and spring 2021 (post-COVID liquidity). The current $1.502T absolute level and 4.63% GDP ratio are both all-time highs. Leverage can climb for extended periods, but it is a critical accumulator of systemic fragility.
4. IPO & Fund Flows
- 2026 YTD ETF Net Inflows: ~$1.3 trillion (through July)
- H1 2026: $1 trillion (record half-year, +86% YoY)
- July alone: +$191B
- Equity ETFs: H1 $680B (doubled YoY)
- Total ETF assets: $15.8 trillion
- IPO count: 2026 YTD ~73 (Renaissance Capital)
- Status: 🔴 Record inflows
The scale of fund inflows is unprecedented. $1.3T in YTD net inflows is approaching the full-year total for 2025, with no sign of deceleration. Combined with the margin debt buildup, market liquidity is extremely abundant — this is the core force supporting current valuations, but also the amplification mechanism for downside risk when the flow reverses.
Summary Assessment
| Indicator | Status |
|---|---|
| Credit Spreads (HY/IG) | 🟢 2/2 Normal |
| Yield Curve | 🟢 Normal (steepening) |
| Margin Debt | 🔴 All-time High |
| Fund Flows | 🔴 Record Inflows |
Total: 2 🟢 / 0 🟡 / 2 🔴
Credit spreads and the yield curve — the two most reliable systemic risk indicators — are both in healthy territory, with no crash signal in the near term. However, margin debt and fund flows are at all-time record highs, meaning market leverage and capital concentration have reached historically extreme levels. This does not mean a crash is imminent — leverage can climb for extended periods — but it means that once risk appetite turns, the downside acceleration will be greater than normal, as forced deleveraging and capital outflows create a negative feedback loop.
Bottom line: Credit markets are calm, the yield curve is normal, and systemic risk is not flashing red. But the extreme readings on leverage and fund flows mean the “gunpowder under the floorboards” continues to accumulate — no need to time the top right now, but have a risk control plan ready for when the tide turns.