CNN Fear & Greed Sentiment Analysis 2026-08-16
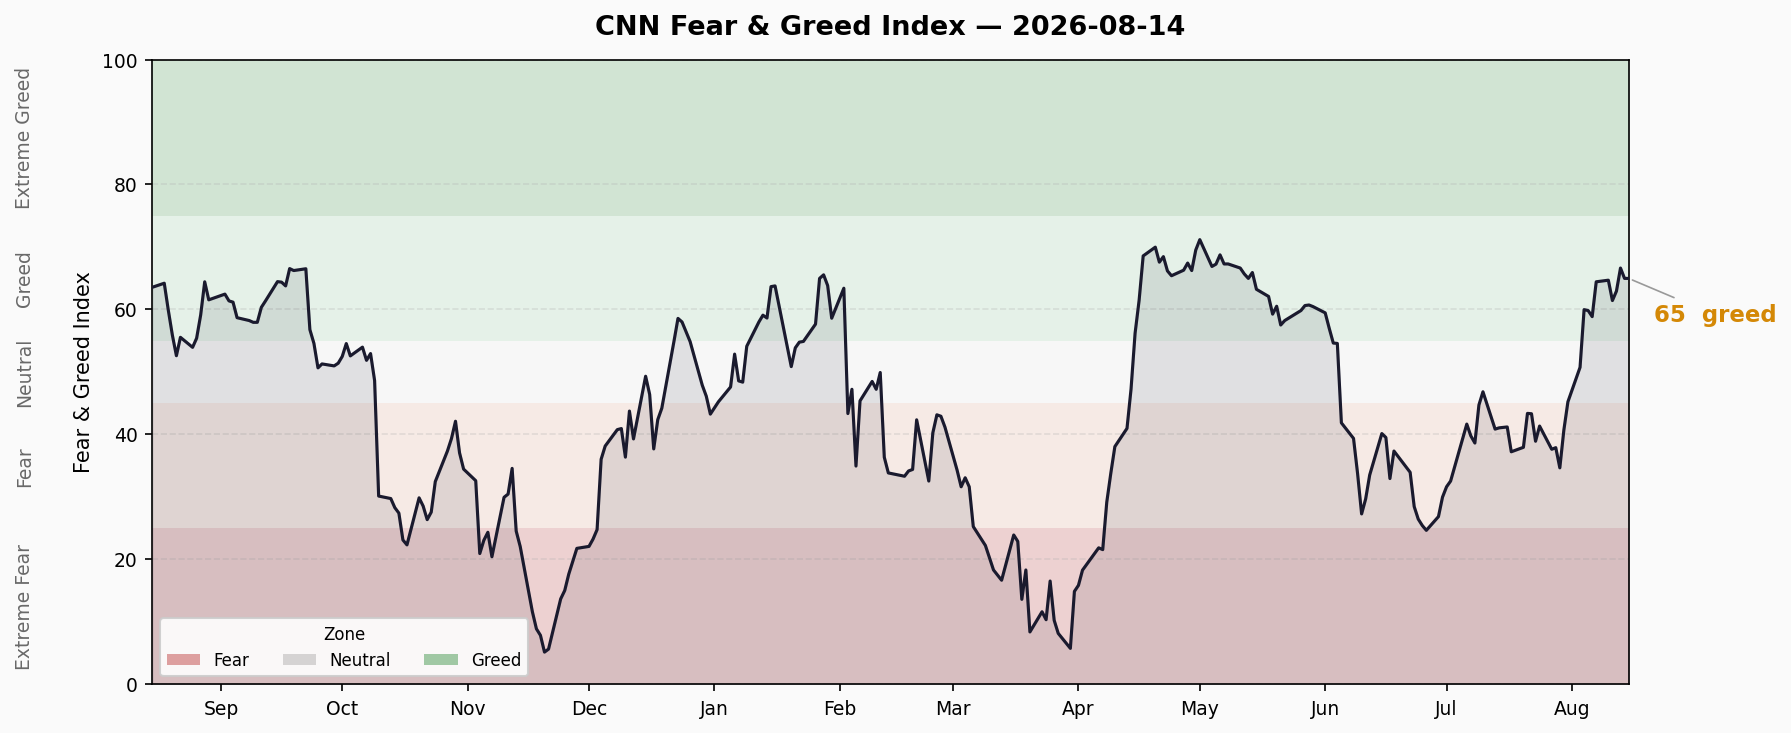
Composite at 64.97 (Greed), down 1.17 points from 66.14 prior day. Monthly rebound of 23.9 points from fear zone at 41.06. Structural divergence: Junk Bond Demand at 98.6 (Extreme Greed) vs Stock Price Strength at 28.6 (Fear). Credit markets pricing zero risk while equity breadth deteriorates. Crisis signals: 3 green, 2 red.
Composite Index
| Metric | Value | Rating |
|---|---|---|
| Current Score | 64.97 | 😈 Greed |
| Previous Close | 66.14 | Greed |
| 1 Week Ago | 64.43 | Greed |
| 1 Month Ago | 41.06 | Fear |
| 1 Year Ago | 63.26 | Greed |
Daily Change: -1.17 points (66.14 → 64.97), slight pullback within Greed territory.
Monthly Change: +23.91 points (41.06 → 64.97), strong rebound from Fear zone, significant sentiment repair.
Last 10 Trading Days Trend:
| Date | Score | Rating |
|---|---|---|
| 07/28 | 37.9 | 😨 Fear |
| 07/29 | 34.7 | 😨 Fear |
| 07/30 | 40.7 | 😨 Fear |
| 07/31 | 45.2 | 😐 Neutral |
| 08/03 | 50.7 | 😐 Neutral |
| 08/04 | 60.0 | 😈 Greed |
| 08/05 | 59.8 | 😈 Greed |
| 08/06 | 58.9 | 😈 Greed |
| 08/07 | 64.4 | 😈 Greed |
| 08/10 | 64.7 | 😈 Greed |
| 08/11 | 61.4 | 😈 Greed |
| 08/12 | 62.9 | 😈 Greed |
| 08/13 | 66.6 | 😈 Greed |
| 08/14 | 65.0 | 😈 Greed |
Trend: Bottomed in fear zone late July, broke into Greed on Aug 4, and has consolidated in the 58-67 range for 9 consecutive days. Recent momentum shows narrow range-bound action between 61-67 with no acceleration or fading.
Seven Sub-Indicators Scan
| Sub-Indicator | Score | Rating | Raw Value | Daily Change |
|---|---|---|---|---|
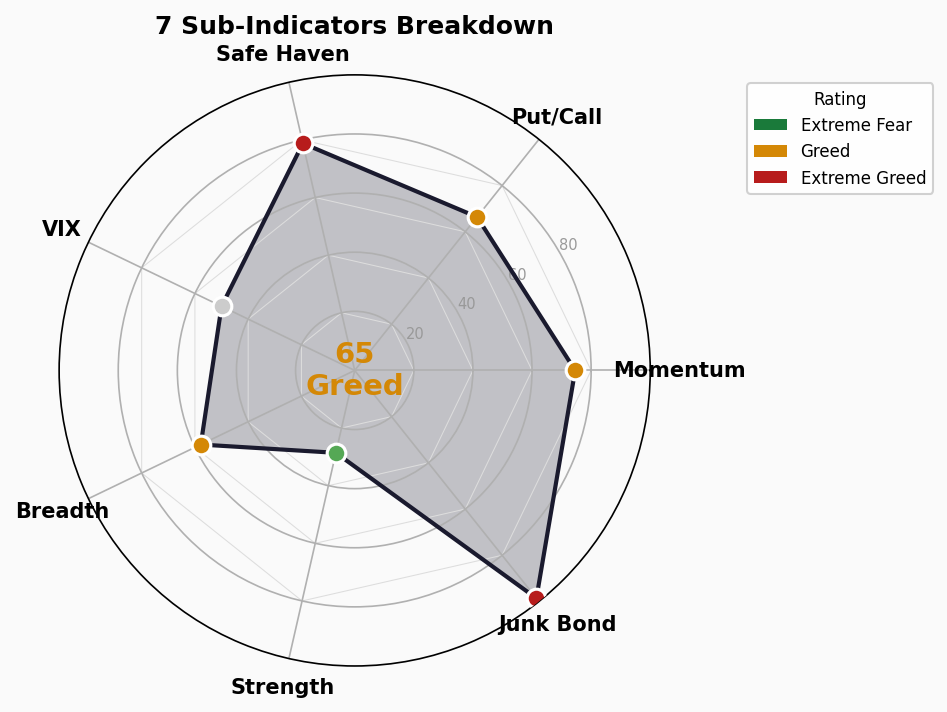
| Market Momentum (S&P 500) | 74.6 | 😈 Greed | 7,786 | ↓ 13pt |
| Stock Price Strength | 28.6 | 😨 Fear | 0.8 (new highs/lows ratio) | ↓ Slight decline |
| Stock Price Breadth | 57.8 | 😈 Greed | 1,058 (adv/decl volume) | ↑ Rising |
| Put/Call Options | 66.4 | 😈 Greed | 0.70 | — Unchanged |
| Market Volatility (VIX) | 50.0 | 😐 Neutral | 14.2 | ↓ Slight decline |
| Junk Bond Demand | 98.6 | 🤑 Extreme Greed | 1.2% (spread) | — Unchanged |
| Safe Haven Demand | 78.8 | 🤑 Extreme Greed | 5.2 (stock/bond return gap) | — Unchanged |
Indicator-by-Indicator:
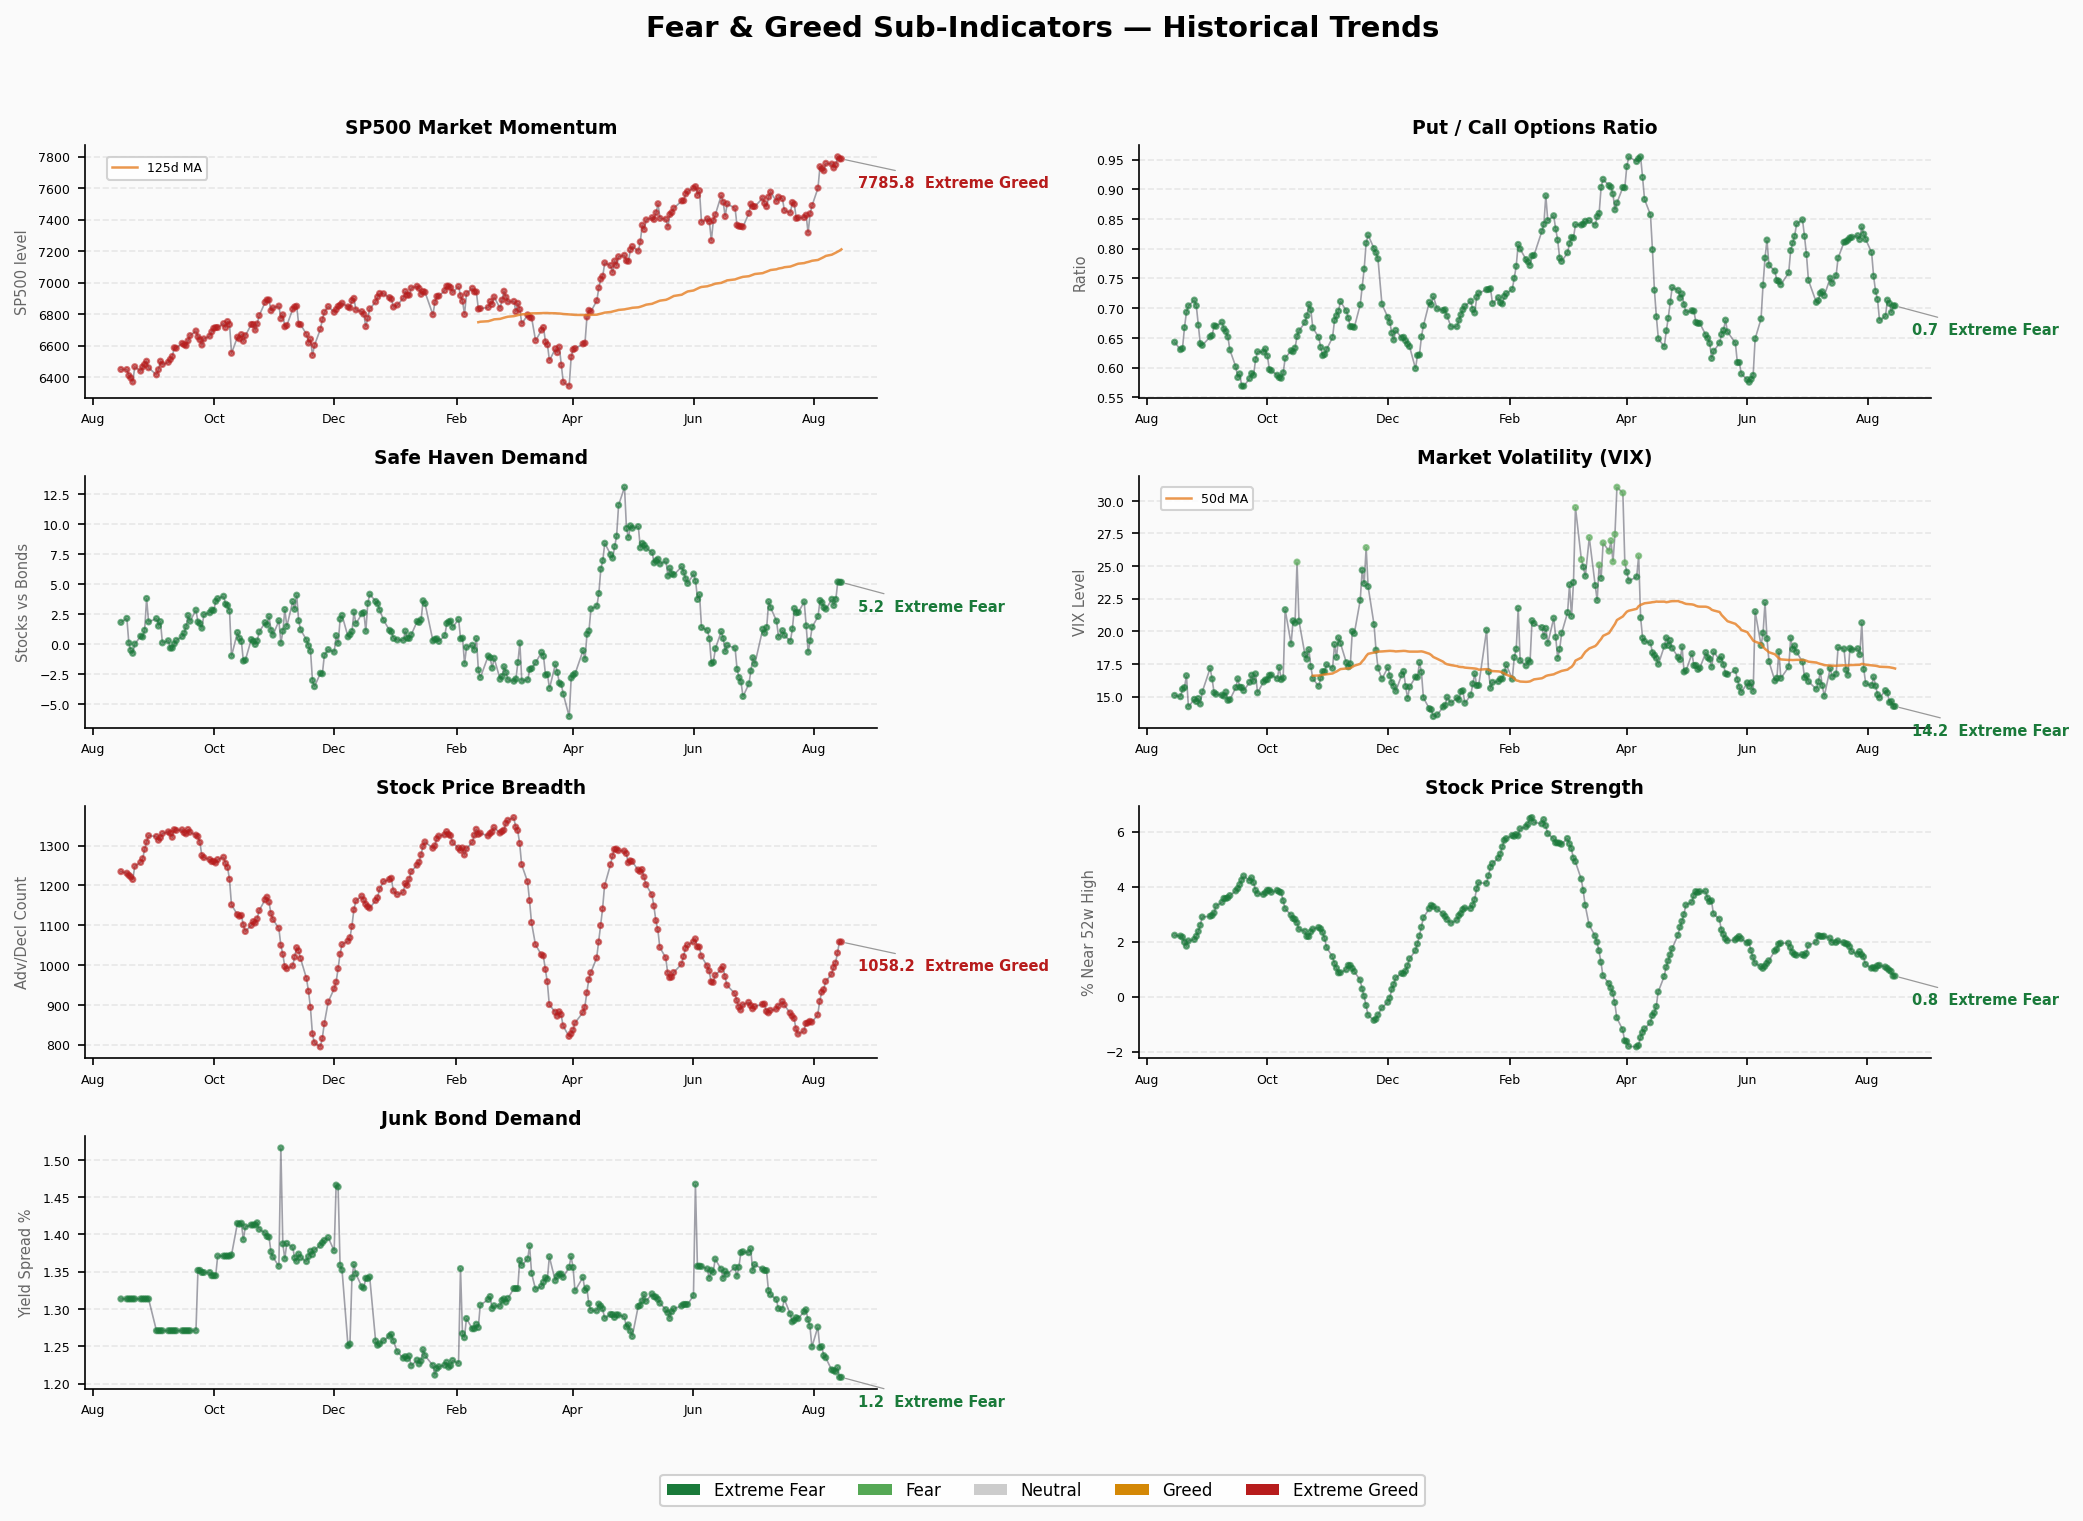
Market Momentum: S&P 500 at ~7,786, above its 125-day moving average. Momentum remains in Greed. However, the index declined from 7,799 to 7,786 in the latest session, showing slight upward momentum loss.
Stock Price Strength: Score of 28.6 in Fear territory. The new-high/new-low ratio is only 0.8, meaning more stocks are making new lows than new highs. This is a breadth problem masked by the index level — the rally is narrow.
Stock Price Breadth: Advance/decline volume ratio at 1,058, in Greed territory, up from 1,030 the prior day. Short-term breadth is improving with more volume flowing into advancing stocks.
Put/Call Options: Ratio at 0.70, in Greed territory. Call buying exceeds put buying, indicating bullish options market sentiment but not extreme.
Market Volatility (VIX): VIX at 14.2, scored 50 (Neutral). Volatility is low but not extremely so. Market is neither panicked nor in extreme complacency.
Junk Bond Demand: Spread at just 1.2%, score of 98.6 — Extreme Greed. Investors demand almost no premium for credit risk, pricing near-zero default probability.
Safe Haven Demand: Score of 78.8 — Extreme Greed. Stocks significantly outperforming bonds, capital flowing heavily into risk assets and away from safe havens.
Structural Divergence Analysis
⚠️ Core Divergence: Credit Euphoria vs Equity Breadth Deterioration
The most prominent structural contradiction is the 70-point gap between Junk Bond Demand (98.6) and Stock Price Strength (28.6):
- Credit market: HY OAS at 2.71%, IG OAS at 0.79%, junk bond spreads at historic lows. Investors chase yield with near-zero risk premium, reminiscent of 2007 credit complacency.
- Equity market: New-high/new-low ratio at 0.8 means more stocks making new lows than highs. The index level masks deteriorating internal breadth.
This “credit extreme heat + individual stock cold” combination is a classic late-cycle signal — the index is propped up by a handful of mega-caps while market internals weaken.
Safe Haven Extreme + VIX Neutral
Safe Haven Demand at 78.8 (Extreme Greed) means capital is flowing out of bonds into stocks, but VIX at 50 (Neutral) suggests this risk-on sentiment hasn’t reached the VIX <12 euphoria extreme. There’s still room before true bubble-peak complacency.
No Extreme Values >80 or <20
Of the 7 sub-indicators, only Junk Bond Demand (98.6) and Safe Haven Demand (78.8) are in extreme territory (>80). No indicators are below 20. The composite at 64.97 is in moderate Greed, not extreme.
Trend Assessment
- Range Duration: The composite has been in Greed territory (55-75) for ~9 trading days, following roughly 2 weeks in Fear/Neutral.
- Turning Indicators: Rapid rebound from 34.7 (Jul 29) to 64.4 (Aug 7), followed by consolidation in the 61-67 range. Upward slope has flattened significantly, but no reversal signal yet.
- Key Levels: Above 70 = accelerating greed; below 55 = end of risk-on bounce.
- Monthly Comparison: +23.9 points (41→65), one of the largest single-month sentiment improvements in 2026, driven by bottoming in extreme fear in late July.
🚨 Crisis Signals Dashboard
1. Credit Spreads
- HY OAS: 2.71% | 🟢 Normal/Greed
- IG OAS: 0.79% | 🟢 Normal
- Trend: Stable (FRED data as of Aug 13). HY OAS remains below 3% threshold. Credit markets pricing zero default risk.
2. Yield Curve
- 10Y-2Y Spread: +51bp | 🟢 Normal/Steep
- 10Y: 4.63% | 2Y: 4.15% | 30Y: 5.21%
- Trend: Yield curve normally steep, no inversion. However, 10Y-30Y inverted at -58bp, long-end pricing recession discount.
3. Margin Debt
- FINRA Margin Debt: $1.417T (July 2026) | 🔴 Historical High
- Previous Month: $1.502T (June 2026, all-time record)
- Trend: Declined $85B (-5.7%) in July from June record. Still +38.5% YoY (vs Jul 2025 $1.023T). Leverage remains at historically elevated levels.
- Interpretation: Monthly deleveraging is a positive signal, but absolute level still near historic peak. Historically, margin debt peaks lead market corrections by 3-6 months.
4. IPO Market
- 2026 YTD IPOs: ~73+ deals (Renaissance Capital)
- Trend: Q1 IPO market delayed deals due to volatility; Q2 recovery. August calendar includes Lyntris ($492M) and others.
- Interpretation: IPO count moderate, not at bubble-era levels (2019-2021 averaged 200+). However, mega IPOs (SpaceX, OpenAI) loom.
5. Fund Flows
- 2026 H1 ETF Inflows: $1 trillion (record) | 🔴 Record inflows
- 2026 Full-year Projection: $2.3 trillion (State Street)
- Latest Week: ETF net issuance $43.7B (week ended Aug 5)
- Trend: Equity ETFs $680B H1, Bond ETFs $300B, EM ETFs $38B — broad-based inflows
- Interpretation: Inflow scale far exceeds any historical period, indicating fully risk-on positioning. Historically, inflows of this magnitude appear near market tops.
Summary Assessment
| Indicator | Status |
|---|---|
| Credit Spreads | 🟢 2 Green |
| Yield Curve | 🟢 1 Green |
| Margin Debt | 🔴 1 Red |
| Fund Flows | 🔴 1 Red |
| Total | 3 🟢 / 0 🟡 / 2 🔴 |
Conclusion: Credit spreads and yield curve are normal — the two most reliable leading indicators are not flashing recession. However, margin debt and ETF inflows are at historic records, indicating extreme leverage and capital deployment. Credit markets (HY OAS 2.71% + FNG Junk Bond Demand 98.6) are pricing near-zero risk, diverging from Stock Price Strength at 28.6 (Fear) — credit says “all clear,” individual stock breadth says “watch out.”
Current state resembles late-cycle: traditional recession signals (curve inversion, widening spreads) haven’t flashed red, but structural risks (extreme leverage, record inflows, deteriorating breadth) are accumulating. Maintain “participate cautiously, tight stops” posture.