CNN Fear & Greed Sentiment Analysis 2026-08-15
Composite index 65.0 (Greed), down slightly from 66.1 prior day. Structural divergence in sub-indicators: Junk Bond Demand 98.6 extreme greed vs Stock Price Strength 28.6 fear. Crisis signals: credit spreads normal, yield curve steepening, but margin debt $1.502T all-time high, IPO/ETF inflows at record levels.
Composite Index
| Metric | Value |
|---|---|
| Current Score | 65.0 — Greed |
| Previous Close | 66.1 |
| 1 Week Ago | 64.4 |
| 1 Month Ago | 41.1 |
| 1 Year Ago | 63.3 |
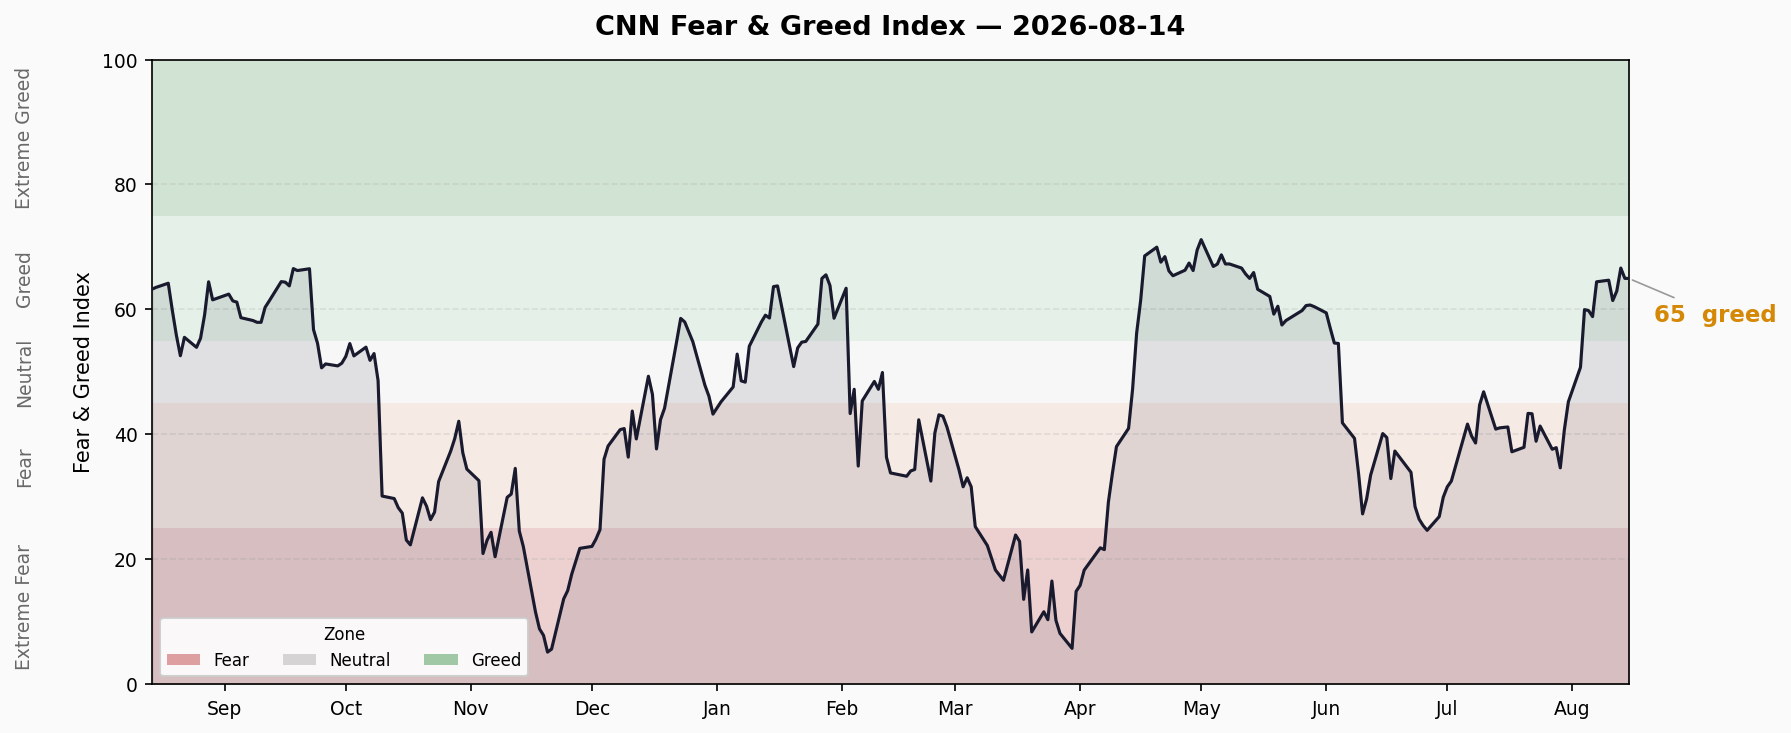
The composite index surged from 41.1 (Fear) one month ago to 65.0 (Greed), a +24-point jump in four weeks, signaling a significant sentiment shift. However, the index pulled back -1.6 points from the 66.6 peak on 8/13, showing early signs of momentum fatigue.
Last 10 Days Trend
| Date | Score | Rating |
|---|---|---|
| 08/04 | 60.0 | Greed |
| 08/05 | 59.8 | Greed |
| 08/06 | 58.9 | Greed |
| 08/07 | 64.4 | Greed |
| 08/10 | 64.7 | Greed |
| 08/11 | 61.4 | Greed |
| 08/12 | 62.9 | Greed |
| 08/13 | 66.6 | Greed |
| 08/14 | 65.0 | Greed |
Trend Assessment: The index has held in the Greed zone (55-70) for 10 consecutive trading days, with a center of gravity around 62-66. The pullback from 66.6 on 8/13 suggests the 75+ Extreme Greed threshold remains out of reach for now, but downside also appears limited. With VIX neutral (50), the market is pricing in low volatility expectations — the index is more likely to range-bound in 60-70 than to make a directional breakout in the near term.
Seven Sub-Indicators Scan
| # | Sub-Indicator | Score | Rating | Raw Value | Direction |
|---|---|---|---|---|---|
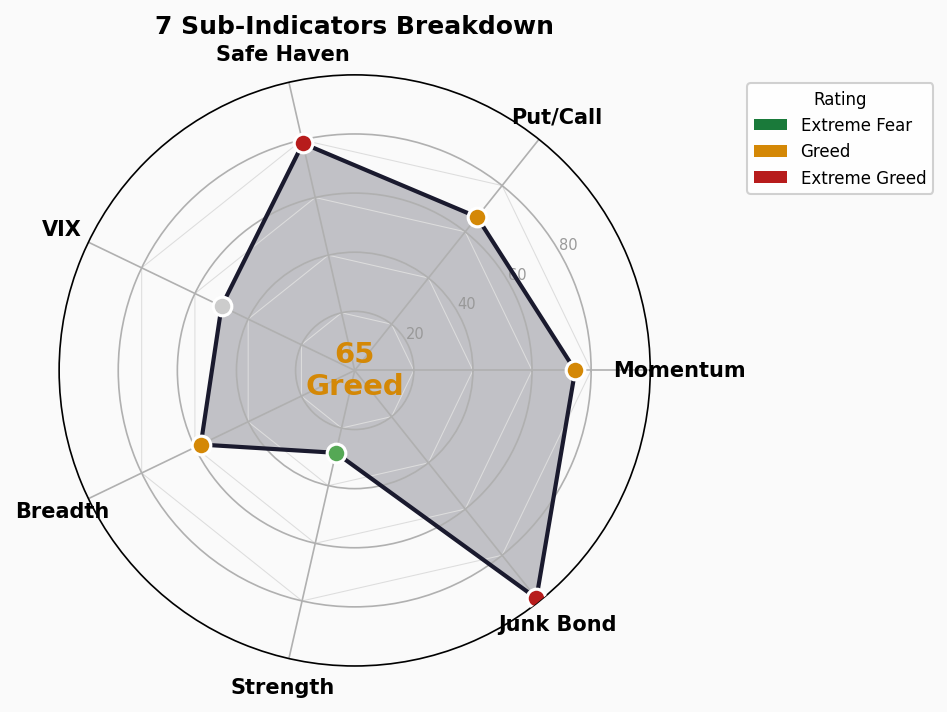
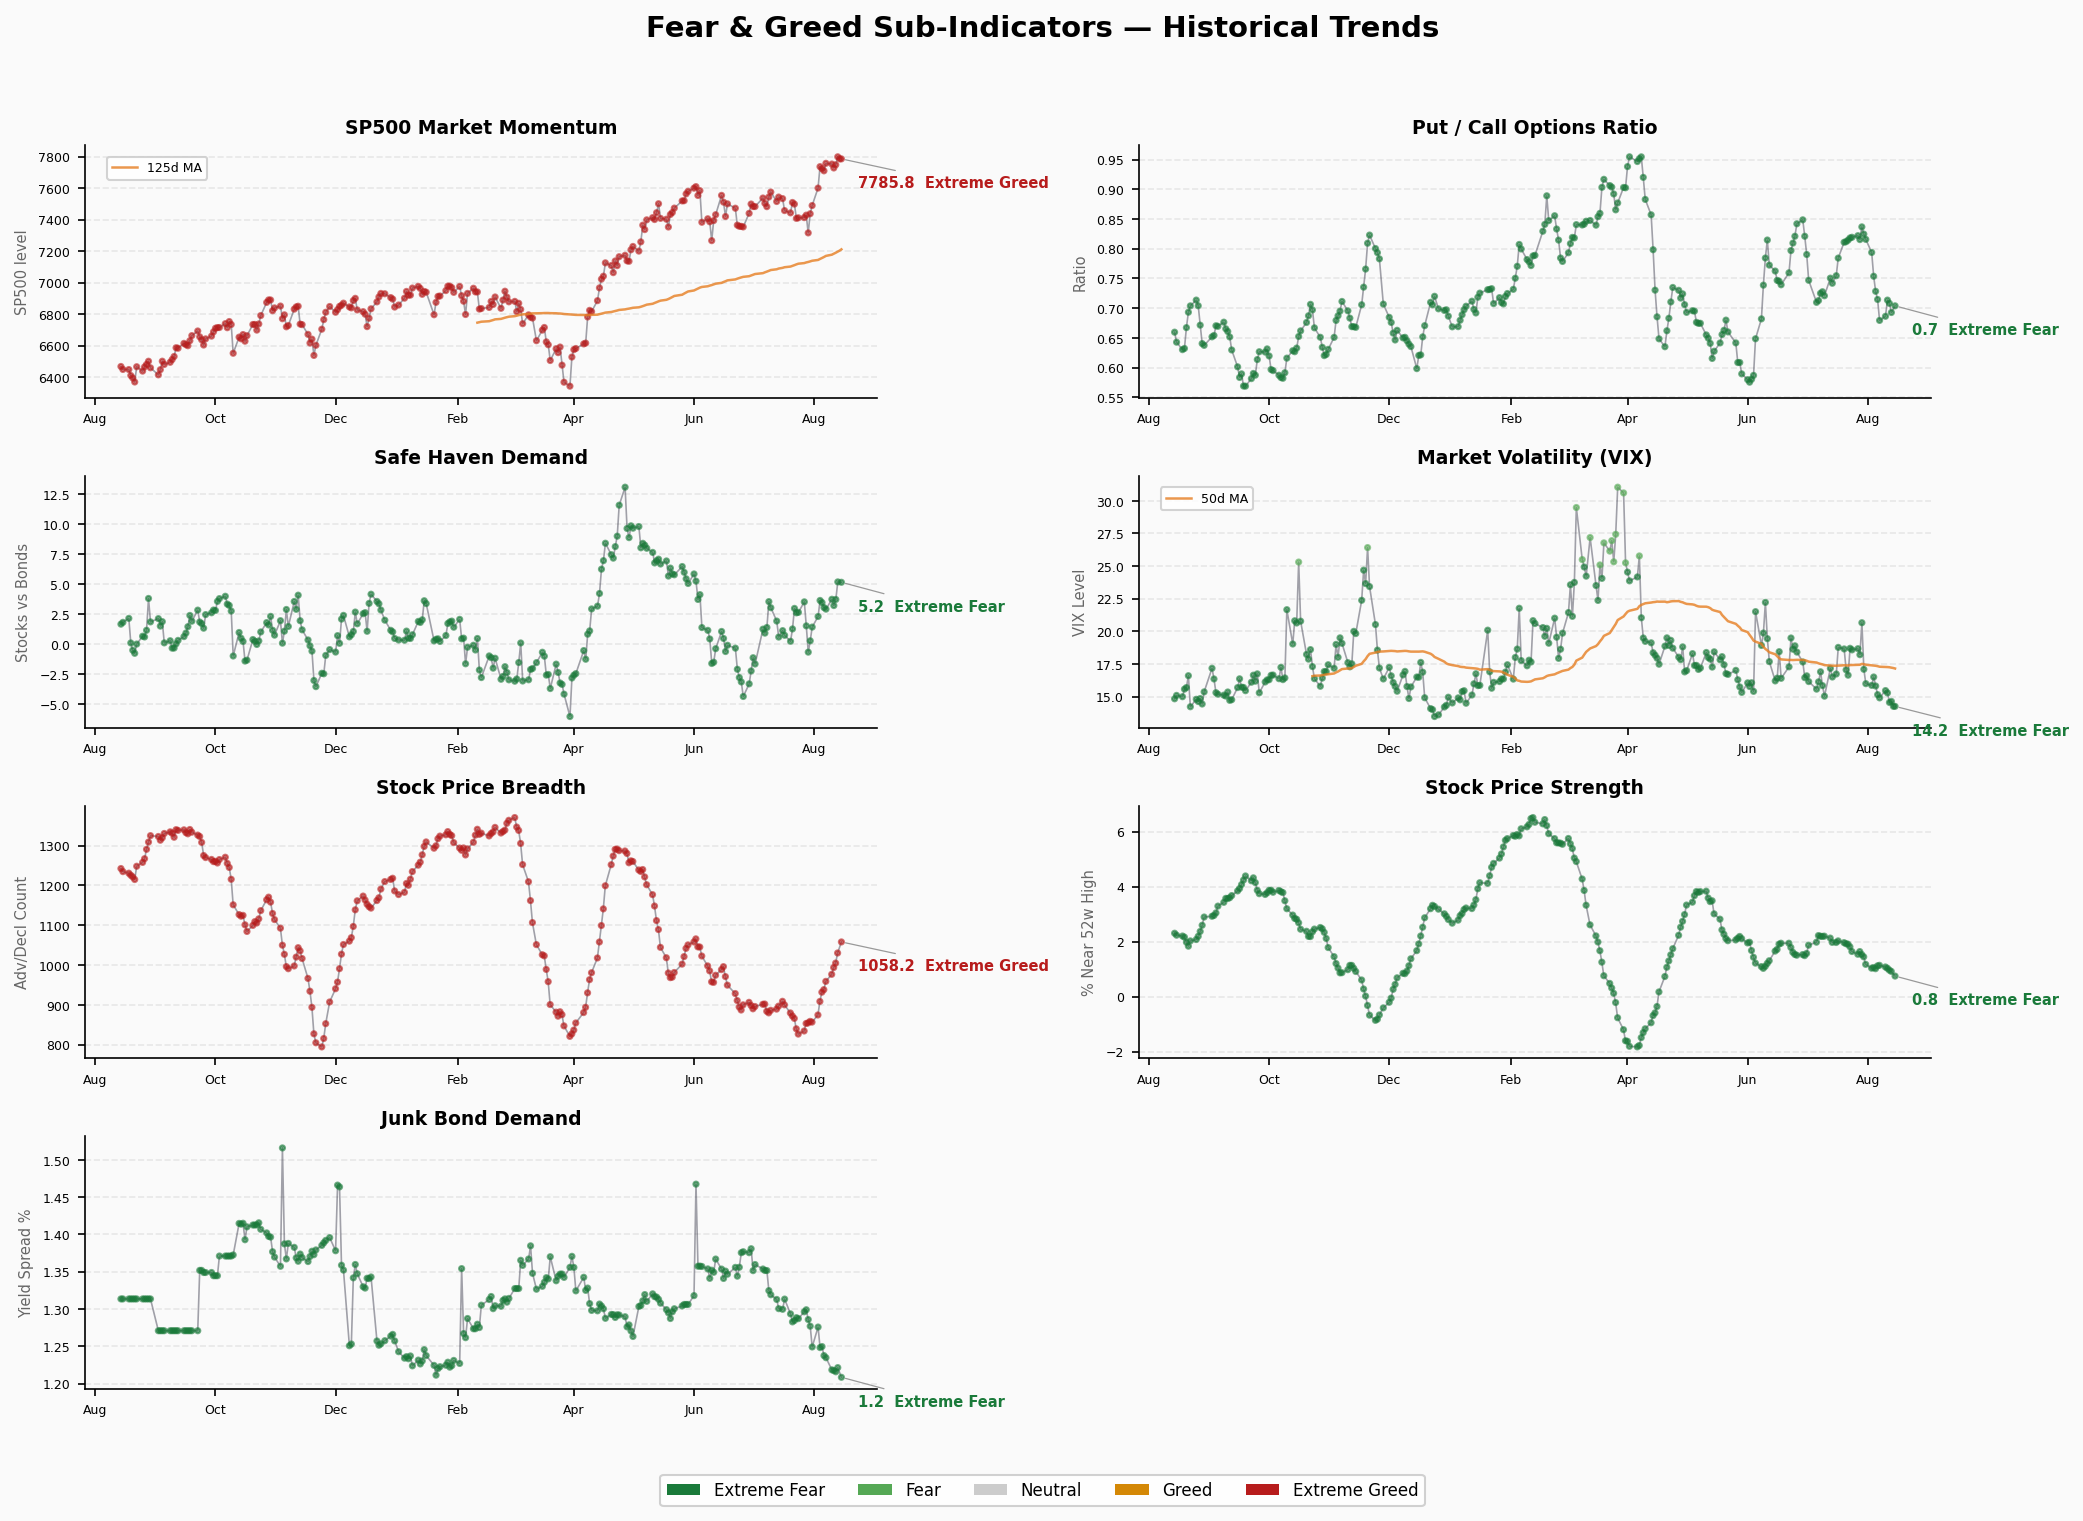
| 1 | Market Momentum (S&P 500 vs 125-day MA) | 74.6 | Greed | 7785.76 | → Flat |
| 2 | Stock Price Strength (New Highs/Lows) | 28.6 | Fear | 0.75 | ↓ Declining |
| 3 | Stock Price Breadth (Adv/Dec ratio) | 57.8 | Greed | 1058.15 | ↑ Rising |
| 4 | Put/Call Options | 66.4 | Greed | 0.704 | ↑ Slight up |
| 5 | Market Volatility (VIX) | 50.0 | Neutral | 14.25 | → Flat |
| 6 | Junk Bond Demand | 98.6 | Extreme Greed | 1.209 | ↓ Slight down |
| 7 | Safe Haven Demand | 78.8 | Extreme Greed | 5.172 | ↓ Slight down |
Sub-Indicator Interpretation
Market Momentum 74.6: S&P 500 remains well above its 125-day moving average, indicating strong upside momentum. However, the indicator is near the upper bound of the Greed zone — further advances would require fresh catalysts.
Stock Price Strength 28.6: ⚠️ The lone Fear signal. New highs/new lows ratio at 0.75, down from 0.92 the prior day. The index is rising but fewer stocks are making new highs — a classic internal deterioration signal. Breadth weakening while the index advances suggests concentration risk (a few mega-caps carrying the market).
Stock Price Breadth 57.8: Advance/decline ratio at 1058, still in Greed territory. Market participation is acceptable, but the divergence with the Strength indicator is a cautionary flag.
Put/Call 66.4: Put/call ratio at 0.704, options market is positioned bullishly. Traders are buying more calls than puts, indicating low hedging appetite.
VIX 50.0: VIX at 14.25, perfectly neutral. Volatility is low and the market is underpricing tail risk. Low VIX typically corresponds to market complacency.
Junk Bond Demand 98.6: Extreme Greed, near maximum. Spread at just 1.209% — investors are aggressively chasing yield. This extreme level means credit markets are offering virtually zero compensation for risk.
Safe Haven Demand 78.8: Extreme Greed. Capital continues flowing out of safe havens (gold/Treasuries) into risk assets, consistent with the junk bond signal — risk appetite is maxed out.
Structural Divergence Analysis
⚠️ Core Contradiction: Extreme Greed vs Fear Coexist
Divergence 1: Junk Bond Demand 98.6 (Extreme Greed) vs Stock Price Strength 28.6 (Fear) — a 70-point gap. Credit investors are aggressively pursuing risk while equity breadth deteriorates. Credit markets are often “smarter” than equity markets — when junk bond demand is extreme and stock breadth weakens, it typically signals a late-cycle environment.
Divergence 2: Safe Haven Demand 78.8 (Extreme Greed) combined with VIX 50 (Neutral). Safe havens are being sold but volatility hasn’t been compressed to extreme lows, suggesting the market’s pricing of “risk-free” is divided.
Divergence 3: Market Momentum 74.6 (Greed) vs Stock Price Strength 28.6 (Fear). Index momentum is strong but individual stock strength is weak — the classic “narrowing leadership” phenomenon where a few mega-caps drive the index higher.
Trend Assessment
- Range Duration: FNG has been in the Greed zone for ~3 weeks, following ~2 weeks in Fear/Neutral territory (41-53). The speed of transition from Fear to Greed (~1 month, +24 points) suggests rapid position building.
- Reversal Indicators: Stock Price Strength is the leading warning signal. If Breadth follows Strength lower, FNG could pull back to Neutral. However, as long as Junk Bond Demand remains at extreme levels, the composite index is unlikely to decline sharply.
- Risk Alert: The current pattern resembles a late-cycle “easy money + narrow advance” setup. Extreme credit tightness + stock divergence + low volatility = textbook complacency.
🚨 Crisis Precursor Dashboard
1. Credit Spreads
| Metric | Value | Status | Thresholds |
|---|---|---|---|
| HY OAS (High Yield) | 2.71% | 🟢 Normal | <3% Normal | 3-5% Caution | 5-8% Panic | >8% Crisis |
| IG OAS (Investment Grade) | 0.79% | 🟢 Normal | <1% Normal | 1-2% Caution | >2% Panic |
| Data Date | 2026-08-13 (FRED) | ||
| Trend | Stable vs prior day; HY OAS hovering at 2.7-2.8% |
Credit spreads remain compressed near historic lows. HY OAS at 2.71% has ~30bp of cushion before hitting the 3% caution threshold. This is currently the “healthiest” indicator — but if Junk Bond Demand (FNG 98.6 extreme greed) begins to reverse, spread widening would be the first leading signal.
2. Yield Curve
| Metric | Value | Status |
|---|---|---|
| 10Y-2Y Spread | +51bp | 🟢 Normal steepening |
| 10Y-30Y Spread | -58bp | 🟡 Mildly inverted |
| 10Y | 4.63% | |
| 2Y | 4.15% | |
| 30Y | 5.21% | |
| Data Date | 2026-08-13 (FRED) |
The 10Y-2Y segment has normalized to a steep +51bp, ending the prior inversion. However, the 10Y-30Y remains inverted at -58bp — the long end is pricing in elevated long-term inflation/fiscal risk with 30Y at 5.21%. Curve normalization is positive, but the long-end inversion warrants attention.
3. Margin Debt
| Metric | Value | Status |
|---|---|---|
| FINRA Margin Debt | $1.502T (Jun 2026) | 🔴 All-time high |
| MoM Change | +$86B (+6.1%) | |
| YoY Change | +49.0% | |
| % of GDP | 4.63% (long-term avg 3.05%) | 🔴 Far above average |
Margin debt at $1.502 trillion, up $86B in June alone, +49% YoY. This is the highest nominal level since FINRA data began in 1997. Historically, only three periods saw comparable growth rates: 1999-2000 (dot-com), 2007 (GFC eve), and 2021 (pre-2022 bear market). None perfectly timed market tops, but all were late-cycle or post-surge environments. High leverage concentration means any sustained pullback could trigger forced deleveraging cascades.
4. IPO Market
| Metric | Value | Status |
|---|---|---|
| 2026 H1 IPO Proceeds | $114.1B | 🔴 Record |
| vs Prior Year | 7.7x (vs $14.8B) | |
| Largest IPO | SpaceX (largest IPO in history) | |
| $1B+ IPOs | 12 (vs 4 prior year) | |
| $50M+ IPOs | 62 (vs 34 prior year) |
The IPO market is scorching hot. H1 proceeds of $114.1B are nearly 8x the prior year. SpaceX contributed significantly, but even ex-SpaceX, proceeds are 3x higher. Cerebras and other AI infrastructure names priced well above initial ranges, reflecting investor frenzy for AI exposure. Hot IPO markets typically characterize late-stage liquidity-rich environments.
5. Fund Flows
| Metric | Value | Status |
|---|---|---|
| 2026 H1 ETF Inflows | $1 Trillion | 🔴 Record |
| Equity ETF Inflows | $680B (2x YoY) | |
| Non-US ETF Inflows | $228B (34% share) | |
| Full-Year Forecast | $2.3T (State Street) |
ETF inflows are at record pace — $1 trillion in H1 alone, nearly double the previous record. Equity ETFs captured $680B, reflecting continued rotation from cash/bonds to equities. State Street projects $2.3T for the full year. Abundant liquidity supports markets but also fuels valuation bubbles.
Overall Assessment
| Category | Signal Count |
|---|---|
| 🟢 Normal | 2 (credit spreads, short-end yield curve) |
| 🟡 Caution | 1 (10Y-30Y long-end inversion) |
| 🔴 Danger | 3 (margin debt, IPO frenzy, record fund inflows) |
Bottom Line: Credit spreads and the short-end curve are normal — no immediate liquidity crisis is visible. However, leverage levels, IPO activity, and fund inflows are at historical extremes — all three are classic late-cycle bubble indicators. Combined with the FNG sub-indicator structural divergence (Junk Bond Demand 98.6 extreme greed vs Stock Price Strength 28.6 fear), the market exhibits a “credit stable + extreme leverage + internal weakening” pattern.
This doesn’t mean a crash is imminent — credit spreads can stay tight for extended periods. But with all red lights (leverage, IPO, fund flows) flashing, any catalyst (inflation surprise, geopolitical event, large IPO failure) could trigger rapid deleveraging. Stay alert, manage position sizes.