CNN Fear & Greed Sentiment Analysis 2026-08-14
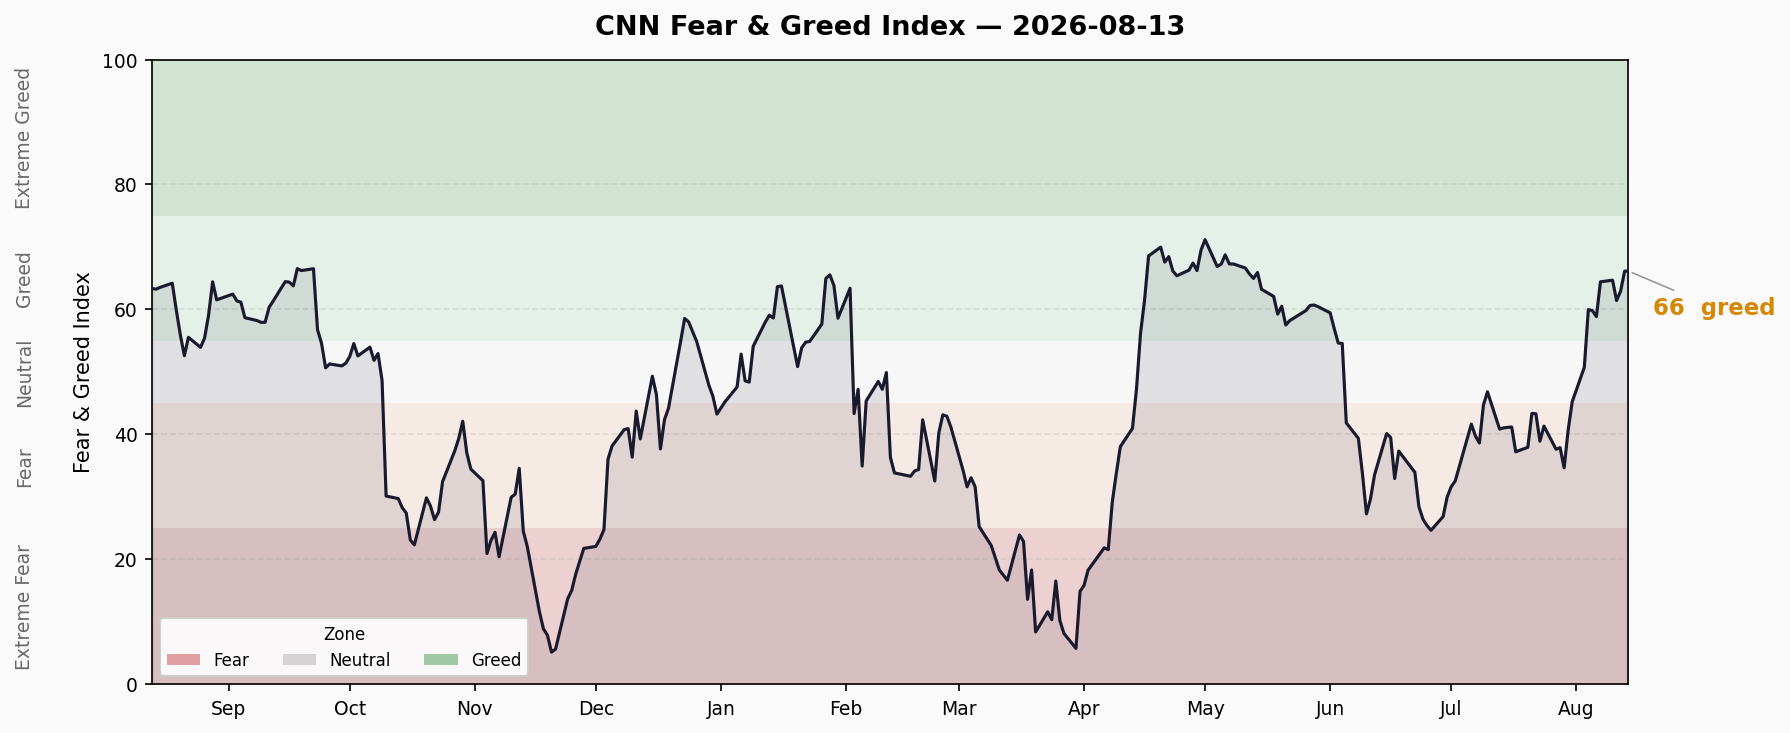
Composite index at 66.1 (Greed), up 3.2 points from 62.9 previous day. Market Momentum and Junk Bond Demand at extreme greed, but Stock Price Strength drops into fear territory — significant structural divergence. Credit spreads stable, FINRA margin debt at record $1.502T.
Composite Index
| Metric | Value |
|---|---|
| Current Score | 66.1 |
| Rating | 🟢 Greed |
| Previous Day | 62.9 (Greed) |
| Weekly Change | +5.2 (last week 50.7 Neutral → 66.1 Greed) |
| Monthly Change | — |
The composite index has held in greed territory for 7 consecutive trading days with accelerating momentum. Starting from 50.7 (Neutral) on 8/3, it climbed 15.4 points in two weeks. Trend direction is clearly up with no reversal signal yet.
Last 10 Days Trend:
| Date | Score | Rating |
|---|---|---|
| 08/03 | 50.7 | Neutral |
| 08/04 | 60.0 | Greed |
| 08/05 | 59.8 | Greed |
| 08/06 | 58.9 | Greed |
| 08/07 | 64.4 | Greed |
| 08/10 | 64.7 | Greed |
| 08/11 | 61.4 | Greed |
| 08/12 | 62.9 | Greed |
| 08/13 | 66.1 | Greed |
Trend characteristics: oscillating upward with a minor pullback on 8/5-8/6 that didn’t break below the greed threshold, followed by accelerated ascent from 8/7.
Seven Sub-Indicators Scan
| # | Indicator | Score | Rating | Raw Value | Daily Change | Direction |
|---|---|---|---|---|---|---|
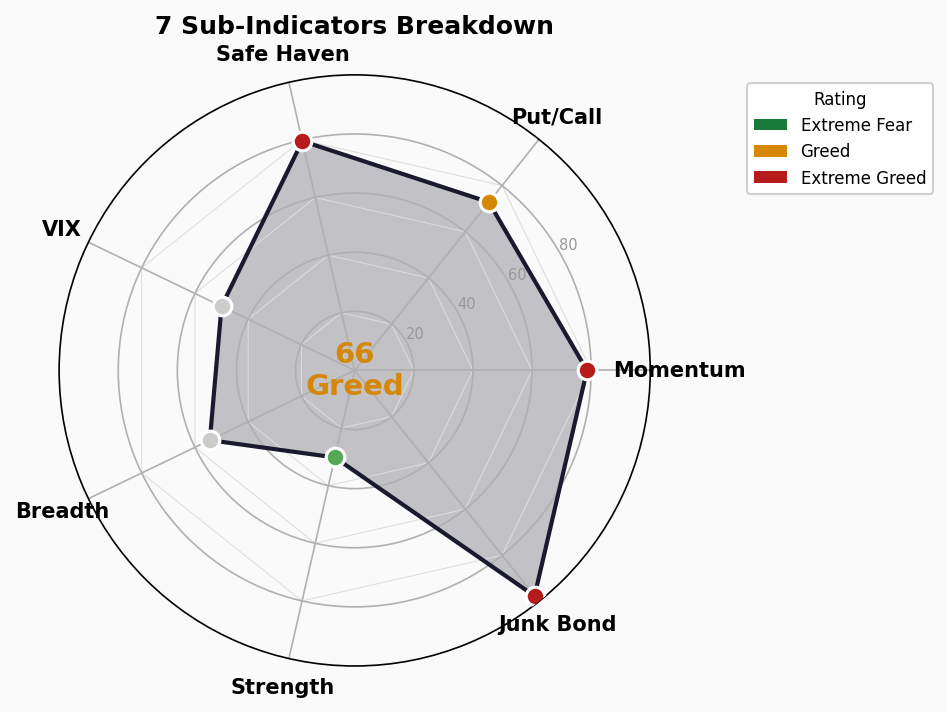
| 1 | Market Momentum S&P 500 | 78.6 | 🔥 Extreme Greed | 7,798.99 | +50.5 | ↑ |
| 2 | Stock Price Strength | 30.2 | 😨 Fear | 0.92 | -0.046 | ↓ |
| 3 | Stock Price Breadth | 54.4 | 😐 Neutral | 1,030.40 | +25.4 | ↑ |
| 4 | Put/Call Options | 72.8 | 🟢 Greed | 0.693 | -0.015 | ↓ |
| 5 | Market Volatility (VIX) | 50.0 | 😐 Neutral | 14.63 | +0.08 | → |
| 6 | Junk Bond Demand | 97.6 | 🔥 Extreme Greed | 1.2216 | +0.006 | ↑ |
| 7 | Safe Haven Demand | 79.6 | 🔥 Extreme Greed | 5.21 | +1.47 | ↑ |
Indicator-by-Indicator Breakdown
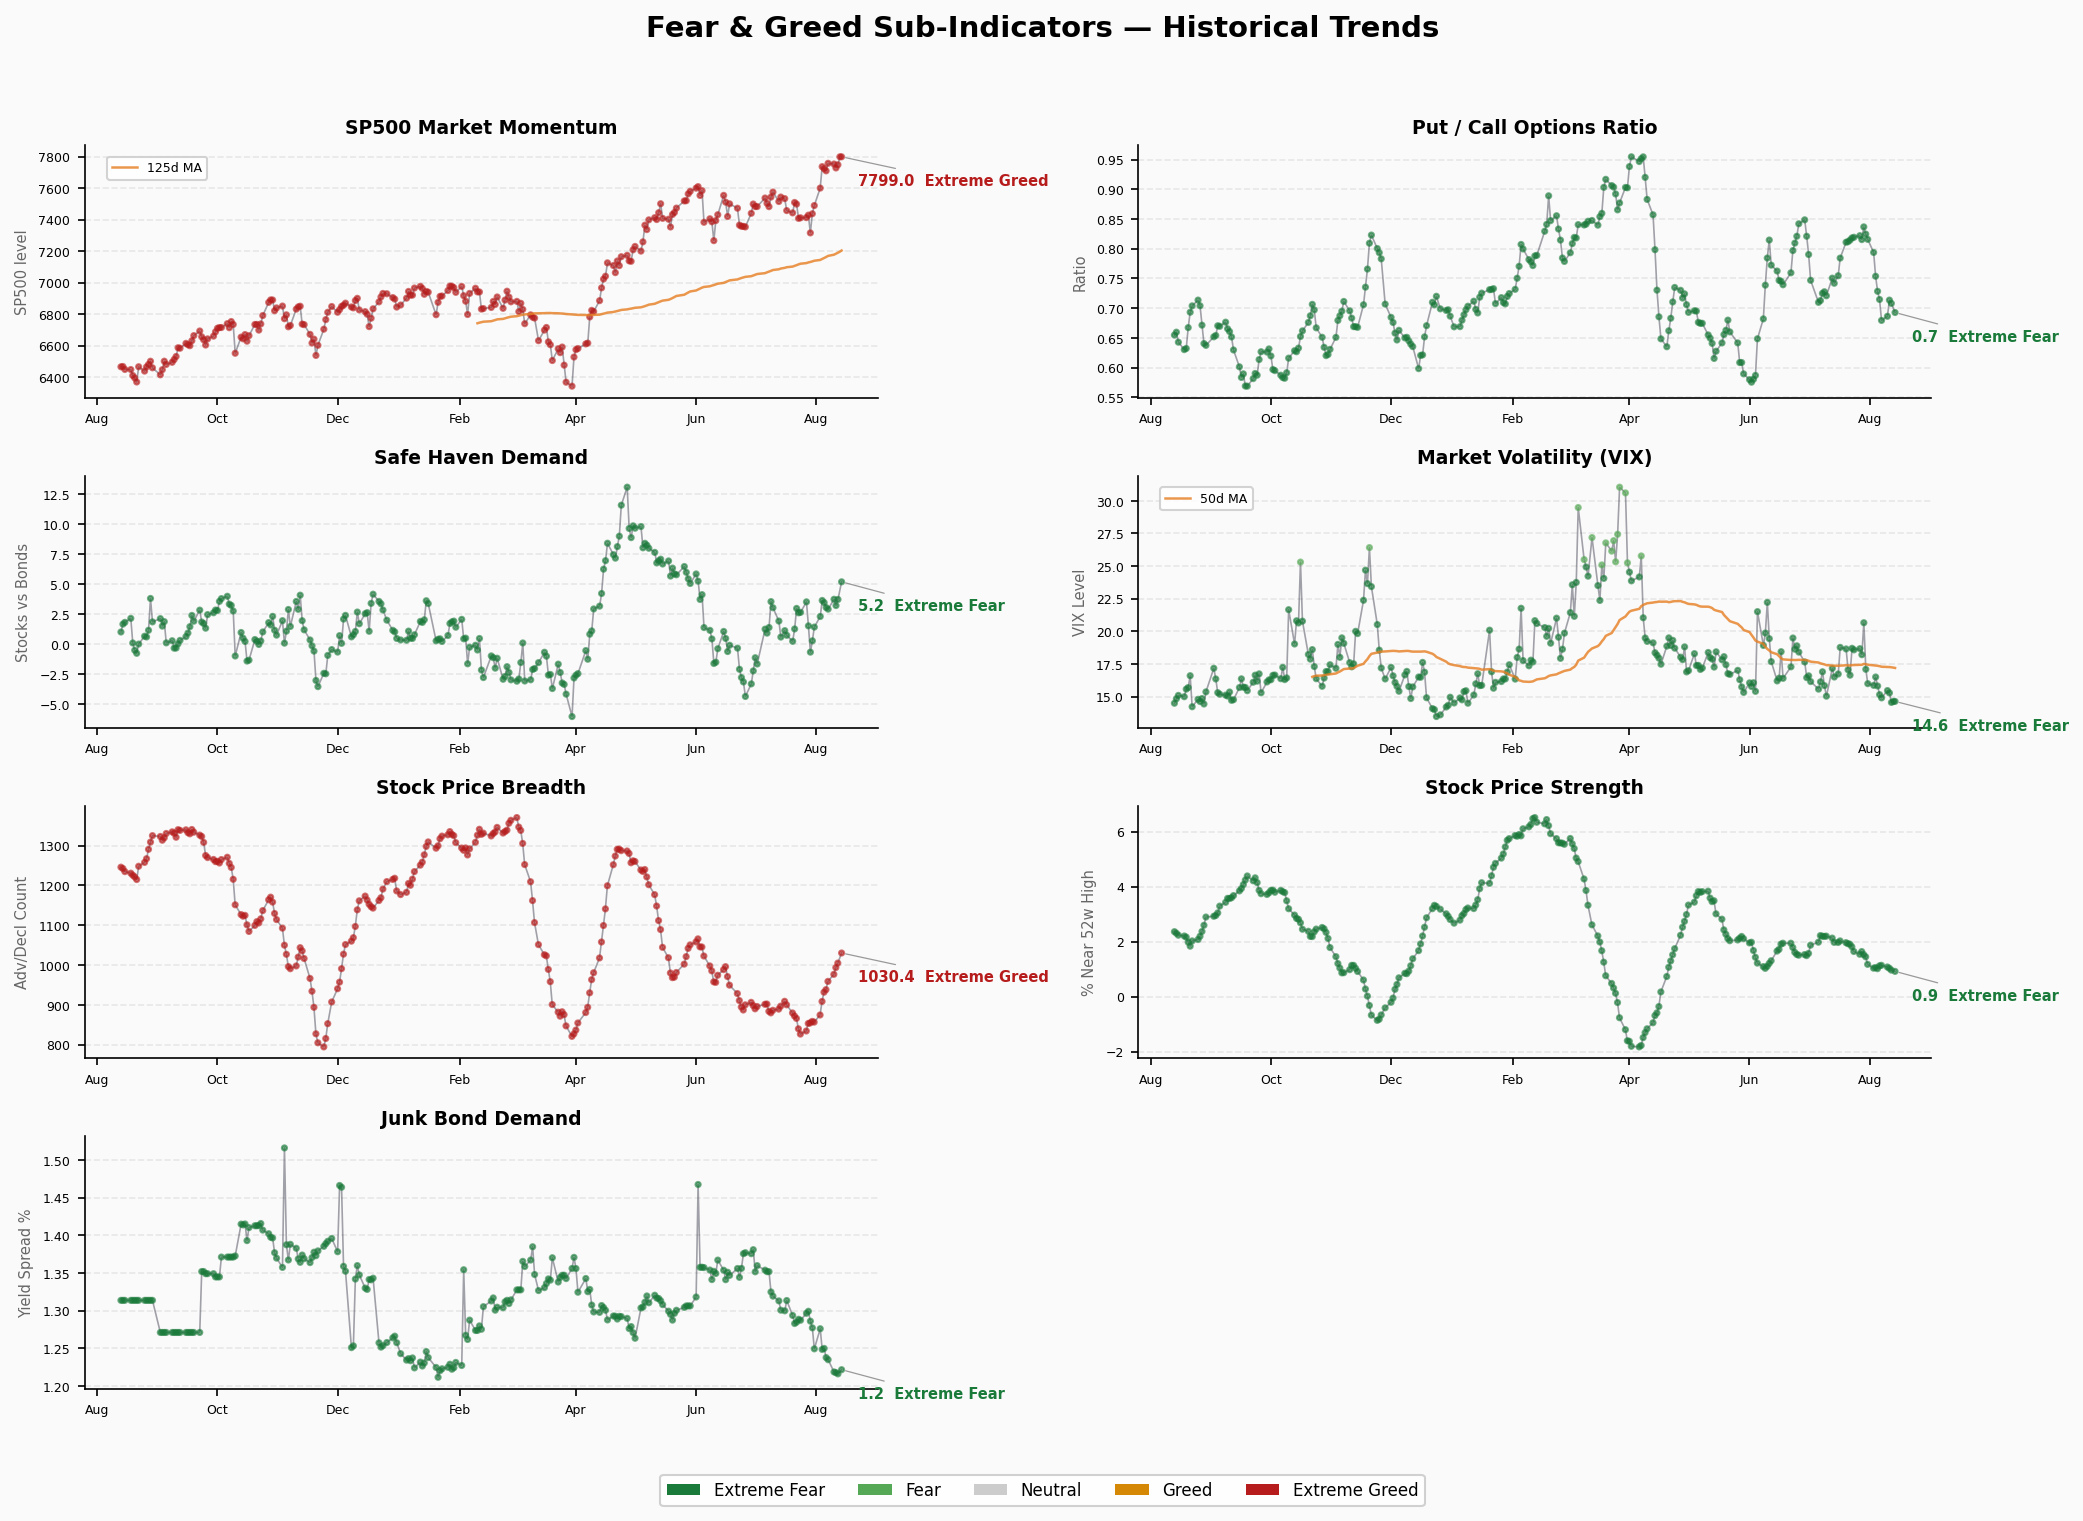
1. Market Momentum S&P 500 — 78.6 🔥 Extreme Greed S&P 500 at 7,798.99, significantly above its 125-day moving average. Has held in extreme greed for 10 consecutive trading days with strong price momentum. Rose steadily from 7,600.5 to 7,798.99 over the past 10 days with no meaningful pullback.
2. Stock Price Strength — 30.2 😨 Fear NYSE new highs/new lows ratio at just 0.92, in fear territory and deteriorating (previous day 0.968 → 0.922). This is the biggest structural contradiction — the index is rising, but fewer individual stocks are making new highs, suggesting the rally is concentrated in large-cap names.
3. Stock Price Breadth — 54.4 😐 Neutral Advance/decline ratio at 1,030.40,表面上 more advancers than decliners. Has improved from 856.63 to 1,030.40 over the past 10 days, indicating breadth is gradually improving.
4. Put/Call Options — 72.8 🟢 Greed Put/Call ratio at 0.693, call options dominant. The ratio has declined from 0.816 to 0.693 over 10 days, showing diminishing put buying interest and growing bullish positioning.
5. Market Volatility (VIX) — 50.0 😐 Neutral VIX at 14.63, extremely low volatility environment. Declined from 15.86 to 14.55 over 10 days before ticking up slightly to 14.63. Low VIX means the market prices in no major risk, but it can also signal complacency.
6. Junk Bond Demand — 97.6 🔥 Extreme Greed High-yield vs investment-grade spread at just 1.2216%, extremely compressed. Capital is aggressively chasing yield, with credit risk premiums severely diminished. Fluctuated from 1.249 down to 1.216 before edging back to 1.222 — greed remains at extreme levels.
7. Safe Haven Demand — 79.6 🔥 Extreme Greed Stocks outperforming bonds by 5.21%, a significant jump from 3.74% the previous day (+1.47). Capital flowing out of safe-haven assets into risk assets. Surged from 1.44 to 5.21 over 10 days, trend accelerating.
Structural Divergence Analysis
⚠️ Core Contradiction: Peak Momentum vs Weak Stock Strength
| Divergence Pair | Indicator A | Indicator B | Gap |
|---|---|---|---|
| Momentum vs Strength | 78.6 (Extreme Greed) | 30.2 (Fear) | 48.4 pts |
| Junk Bond vs Strength | 97.6 (Extreme Greed) | 30.2 (Fear) | 67.4 pts |
| Safe Haven vs Strength | 79.6 (Extreme Greed) | 30.2 (Fear) | 49.4 pts |
Interpretation: Stock Price Strength is the most prominent outlier. While the composite index sits comfortably in greed territory, individual stock new-high capability has fallen into fear. This confirms a classic structural risk — concentrated rally with insufficient breadth. Large-cap stocks are driving the index higher, but the majority of individual stocks are failing to keep pace.
The VIX-Greed Paradox
VIX at 14.63 is low, with the market pricing in zero risk. Historically, the combination of low VIX + high greed + weak stock strength is a characteristic pre-top pattern. When volatility compresses to extremes, any sudden shock can trigger a sharp correction.
No Extreme Fear Indicators
None of the seven sub-indicators are in extreme fear (<25), indicating no panic selling in the market. However, Stock Price Strength at 30.2 is already in fear territory — watch closely for further deterioration.
Trend Assessment
- Duration in range: The composite has held in greed territory (55-75) for 7 consecutive trading days with an accelerating trend
- Reversal signals: None yet. If Stock Price Strength continues to deteriorate below 25 into extreme fear, it could signal further breadth deterioration
- Key watchpoint: If the composite breaks above 75 into extreme greed next week, heightened vigilance is warranted. Currently at 66.1, approximately 9 points from the extreme greed threshold
🚨 Crash Precursor Dashboard
1. Credit Spreads
| Indicator | Value | Status | Data Date |
|---|---|---|---|
| HY OAS | 2.71% | 🟢 Normal | 2026-08-12 |
| IG OAS | 0.79% | 🟢 Normal | 2026-08-12 |
- Thresholds: HY <3% normal | 3-5% caution | 5-8% panic | >8% crisis
- IG Thresholds: <1% normal | 1-2% caution | >2% panic
- Trend: Credit spreads remain low. HY OAS at 2.71% is essentially flat from the prior period, and IG OAS at 0.79% is at the lower end of normal. The credit market is not pricing recession risk.
2. Yield Curve
| Indicator | Value | Status |
|---|---|---|
| 10Y-2Y Spread | +50bp | 🟢 Normal |
| 10Y Yield | 4.65% | — |
| 2Y Yield | 4.15% | — |
| 30Y Yield | 5.24% | — |
- Thresholds: 10Y-2Y >50bp normal | 0-50bp flat | <0bp inverted
- Trend: Yield curve normalizing with a healthy steepening. 10Y-2Y spread at 50bp, no inversion signal. 2Y at 4.15% reflects market expectation of Fed holding rates steady. 10Y at 4.65% prices in mild growth + inflation. 30Y at 5.24% shows normal term premium.
3. Margin Debt
| Indicator | Value | Status | Data Date |
|---|---|---|---|
| FINRA Margin Debt | $1.502T | 🔴 Record High | 2026-06-26 |
- Monthly change: June $1.502T, up $86B (+6.1%) from May $1.416T
- YoY change: Up $494B (+49.0%) from $1.008T a year ago
- Trend: 🔴 Margin debt has been setting consecutive record highs for months, with accelerating growth. The $86B monthly jump in June is one of the largest in recent years. Leverage is approximately 1.55x the 2021 peak (~$972B). High leverage is the core amplifier of market fragility — any pullback could trigger forced deleveraging and accelerate declines.
4. IPO & Fund Flows
| Indicator | Value | Status |
|---|---|---|
| 2026 YTD IPO Count | ~73 | 🟡 Elevated |
| 2026 YTD ETF Net Inflows | $856B | 🔴 Record |
- Trend: ETF inflows at historic highs with passive money continuing to pour in. Combined with record margin debt, the capital flow picture shows a classic late-bull-market pattern — large sums chasing performance. IPO count hasn’t reached bubble levels, but fund flow intensity is a risk signal.
Summary Assessment
| Sector | Green 🟢 | Yellow 🟡 | Red 🔴 |
|---|---|---|---|
| Credit Spreads | 2 | 0 | 0 |
| Yield Curve | 1 | 0 | 0 |
| Margin Debt | 0 | 0 | 1 |
| IPO / Fund Flows | 0 | 1 | 1 |
| Total | 3 | 1 | 2 |
Assessment: 3🟢 / 1🟡 / 2🔴
Credit spreads and the yield curve are both in normal territory — the market is not pricing systemic risk. However, FINRA margin debt at a record $1.502T (up 49% YoY) and record ETF inflows are two red flags that cannot be ignored. Combined with the FNG composite in greed territory and Stock Price Strength in fear, the market is exhibiting a textbook pattern of “index prosperity, breadth deterioration, and excessive leverage.” This is not an active crash signal, but it is a cautionary酝酿 phase that warrants heightened vigilance.