CNN Fear & Greed Sentiment Analysis 2026-08-13
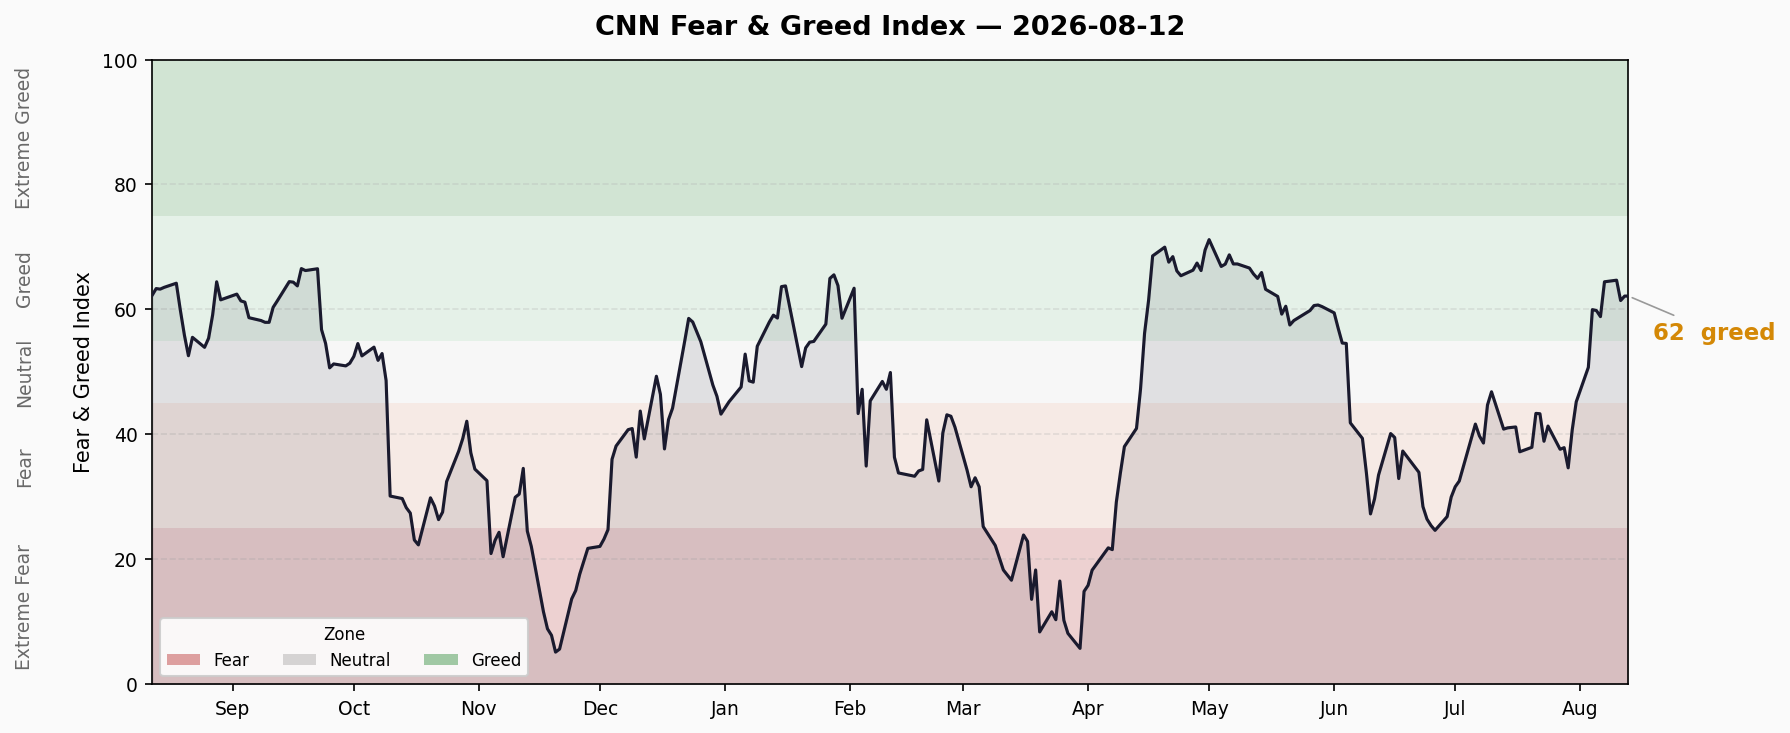
Composite score 62.1 (Greed), +1.3 vs prior day, +2.3 vs week, +15.3 vs month. Major structural divergence: Junk Bond Demand at 98.2 (Extreme Greed) vs Stock Price Strength at 30.4 (Fear). FINRA margin debt hits $1.502T all-time high in June. ETF H1 inflows hit $1T record.
Composite Index
| Metric | Value |
|---|---|
| Current Score | 62.1 — Greed |
| Previous Close | 60.8 → +1.3 |
| 1 Week Ago | 59.8 → +2.3 |
| 1 Month Ago | 46.8 → +15.3 |
| 1 Year Ago | 62.3 → -0.1 |
The monthly gain of +15.3 is the most striking number — a month ago the market was in fear territory (46.8), and has since steadily climbed into greed. The year-over-year comparison is essentially flat (-0.1), indicating sentiment has returned to the same level as a year ago.
Last 10 Days Trend
| Date | Score | Rating |
|---|---|---|
| 07-31 | 45.2 | Neutral |
| 08-03 | 50.7 | Neutral |
| 08-04 | 60.0 | Greed |
| 08-05 | 59.8 | Greed |
| 08-06 | 58.9 | Greed |
| 08-07 | 64.4 | Greed |
| 08-10 | 64.7 | Greed |
| 08-11 | 61.4 | Greed |
| 08-12 | 62.1 | Greed |
Key inflection at 08-03 → 08-04: a +9.3 single-day jump from neutral directly into greed. Since then, the market has held greed territory. The last three days show a mild pullback (64.7 → 61.4 → 62.1), but still firmly mid-greed. Trend direction: weakening within the greed zone.
7 Sub-Indicators Scan
| # | Indicator | Score | Rating | Raw Value | Change |
|---|---|---|---|---|---|
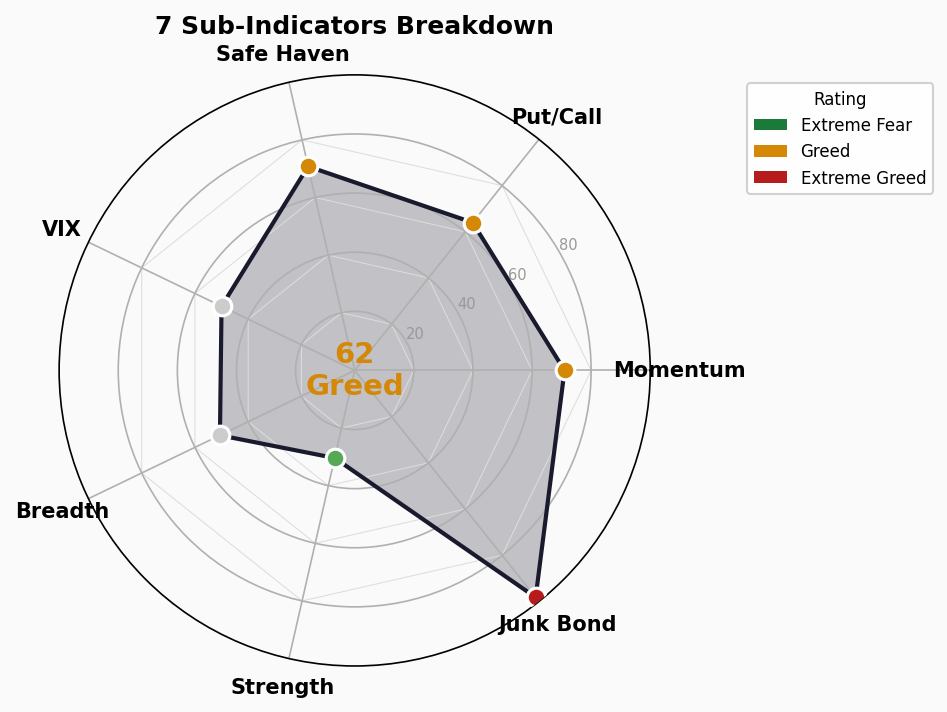
| 1 | Market Momentum (S&P 500 vs 125-day MA) | 71 | Greed | S&P 7748.50 | Flat |
| 2 | Stock Price Strength (new highs/lows) | 30.4 | Fear | Ratio 0.968 | ↓ -0.07 |
| 3 | Stock Price Breadth (McClellan Osc.) | 50.6 | Neutral | 1005.0 | ↑ +11.3 |
| 4 | Put/Call Options | 64 | Greed | P/C 0.708 | ↓ -0.01 |
| 5 | Market Volatility (VIX) | 50 | Neutral | VIX 14.55 | Flat |
| 6 | Junk Bond Demand | 98.2 | Extreme Greed | Spread 1.216% | ↓ -0.002 |
| 7 | Safe Haven Demand | 70.8 | Greed | Ratio 3.74 | ↑ +0.51 |
Sub-Indicator Breakdown
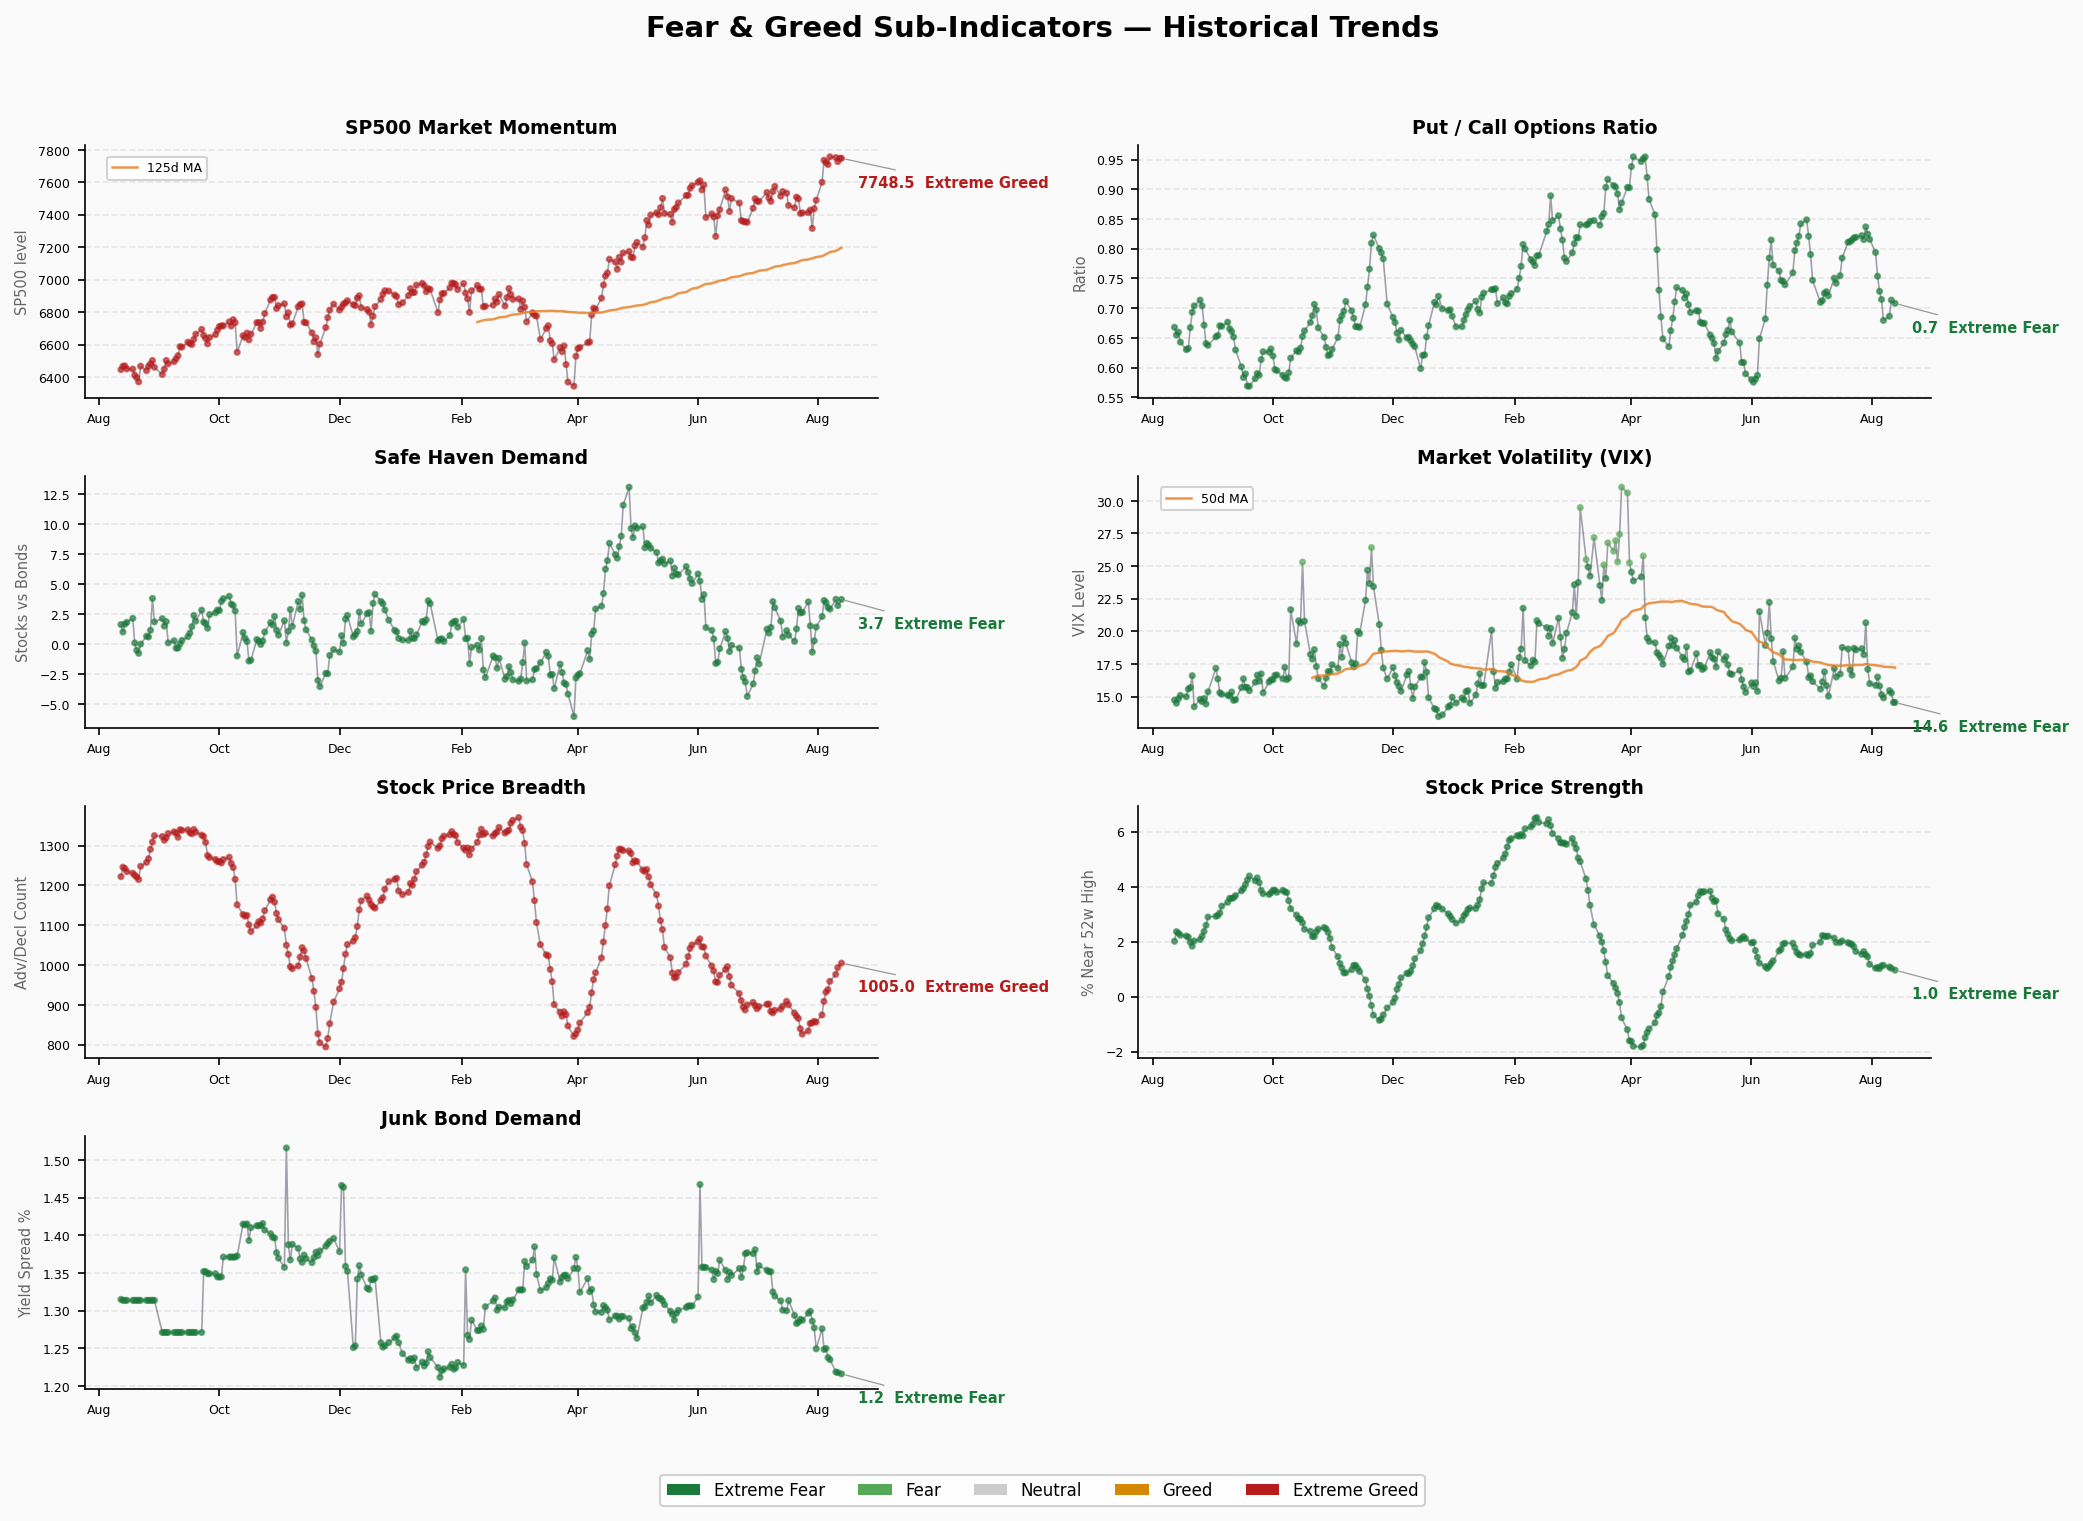
- Market Momentum (71): S&P 500 well above its 125-day MA, trend intact. But momentum has stalled recently with the index flatlining around 7748.
- Stock Price Strength (30.4): The weakest link. New highs/new lows ratio dropped to 0.968, meaning more stocks are hitting new lows than new highs. The index rises but individual stock leadership is narrowing — an early breadth deterioration signal.
- Stock Price Breadth (50.6): McClellan Oscillator slightly up at 1005, breadth barely neutral. Advancers marginally exceed decliners, but not convincingly.
- Put/Call Options (64): P/C ratio at 0.708, options market slightly bullish. But marginal decline from prior day suggests waning bullish conviction.
- Market Volatility (50): VIX at 14.55, extremely low. Low volatility itself reflects complacency, meaning the market is pricing insufficient risk premium.
- Junk Bond Demand (98.2): Extreme value alert. HY bond spread at just 1.216%, near historically tightest levels. Credit markets are pricing virtually zero risk — a stark contrast with Stock Price Strength at 30.4.
- Safe Haven Demand (70.8): Ratio rose from 3.24 to 3.74, indicating reduced demand for safe havens (higher ratio = stocks outperforming Treasuries). Market is rotating away from safety.
Structural Divergence Analysis
🔴 Core Divergence: Credit Euphoria vs Equity Breadth Deterioration
The 68-point gap between Junk Bond Demand (98.2, Extreme Greed) and Stock Price Strength (30.4, Fear) is the most prominent structural contradiction:
- Credit side: HY bond spreads at 1.216%, investors demanding almost no risk premium. Capital is flooding into credit, pushing prices up and spreads to historic tights.
- Equity side: Fewer stocks making new highs than new lows. The index is supported by mega-cap names while the broad universe shows fatigue.
This divergence is historically a late-cycle bull market hallmark — when credit markets are maximally optimistic, risk premiums are compressed to the extreme, while equity breadth deterioration signals weakening internal market structure. These two don’t diverge forever; convergence typically comes via spread widening (credit catches down) rather than stock strength recovery.
🟡 Secondary: Low VIX + Weak New Highs
VIX at 14.55 is low, yet Stock Price Strength is only 30.4. Low volatility masks individual stock-level divergence — a calm index doesn’t mean all stocks are healthy. If breadth continues to deteriorate, volatility will eventually catch up.
Trend Assessment
- Greed zone duration: 7 consecutive trading days in greed (08-04 through 08-12), following approximately 2 weeks in neutral.
- Direction: Last 3 days pulled back from 64.7 peak to 62.1; greed momentum is weakening but no reversal signal yet.
- Key watch: If Stock Price Strength breaks below 25 AND Junk Bond Demand rolls over from extreme greed, it could signal a broader shift. Not confirmed yet.
🚨 Crash Signal Dashboard
1. Credit Spreads
| Metric | Value | Status |
|---|---|---|
| HY OAS | 2.72% | 🟢 Normal/Greedy |
| IG OAS | 0.79% | 🟢 Normal |
| Data Date | 2026-08-11 (FRED) |
- Trend: HY OAS at 2.72% remains in normal range (<3%), having tightened slightly from last month. IG OAS at 0.79% also normal (<1%). Credit spreads are uniformly compressed, consistent with the FNG sub-indicator Junk Bond Demand at 98.2 (Extreme Greed).
- Risk implication: Tighter spreads mean less room for future risk pricing. Not a crisis signal, but an over-optimism signal.
2. Yield Curve
| Metric | Value | Status |
|---|---|---|
| 10Y-2Y Spread | +48bp | 🟢 Normal/Flattening |
| 10Y-30Y Spread | -54bp | 🟡 Inverted |
| 10Y | 4.70% | |
| 2Y | 4.22% | |
| 30Y | 5.24% |
- 10Y-2Y is normally positive (+48bp), the curve having recovered from prior inversion. But 10Y-30Y remains inverted at -54bp, the long end is abnormal.
- 30Y at 5.24% significantly above 10Y at 4.70%, indicating the market demands premium for long-term inflation/fiscal risk. Not a recession signal, but suggests rising term premium.
3. Margin Debt
| Metric | Value | Status |
|---|---|---|
| FINRA Margin Debt | $1.502T (Jun 2026) | 🔴 All-Time High |
| MoM | +6.1% (+$86B) | |
| YoY | +49.0% (+$494B) |
- June margin debt surged $86B, from $1.416T to $1.502T, setting a new all-time record.
- YoY growth of +49% is staggering — margin debt has grown nearly 50% in 12 months. This is not normal growth; it’s leverage accelerating into the market.
- The last comparable leverage surges occurred in the late 2020-2021 bull market peak and pre-2008 housing bubble.
- Next release: August 28 (July data).
4. IPO Activity
| Metric | Value | Status |
|---|---|---|
| 2026 YTD IPOs | ~73 | 🟡 Below Average |
| Source | Renaissance Capital |
- IPO count is below historical average, indicating the primary market isn’t overheated. Not a crash signal, but watch for sudden acceleration.
5. Fund Flows
| Metric | Value | Status |
|---|---|---|
| H1 2026 ETF Inflows | ~$1T | 🔴 Record |
| Rolling 12-Month | ~$2T | 🔴 Record |
| Latest Week (end 7/29) | ETF +$46.5B | |
| 2026 Full-Year Forecast | $2.3T (SSGA) |
- H1 ETF inflows of $1T nearly double the same period last year. Rolling 12-month at $2T is unprecedented.
- US equity ETFs attracted $441B, but non-US ETFs are also accelerating (34% share), suggesting capital is diversifying geographically.
- The flood of capital is pushing valuation expansion, but also means once sentiment turns, stampede risk is real.
Overall Assessment
| Signal | Count | Details |
|---|---|---|
| 🟢 Normal | 2 | HY OAS, IG OAS |
| 🟡 Caution | 1 | 10Y-30Y inversion, low IPO |
| 🔴 Danger | 2 | Margin debt ATH, ETF flows record |
Core Contradiction: Credit spreads and yield curves are within normal ranges, flashing no crisis signals. However, the explosion in margin debt and the torrential ETF inflows point to a market driven by liquidity rather than fundamentals. When leverage and fund flows both set records simultaneously, the market’s sensitivity to any liquidity tightening multiplies exponentially.
Overall Rating: 2🟢 / 1🟡 / 2🔴 — Structural risk accumulating, no imminent crisis signal.