CNN Fear & Greed Sentiment Analysis 2026-08-12
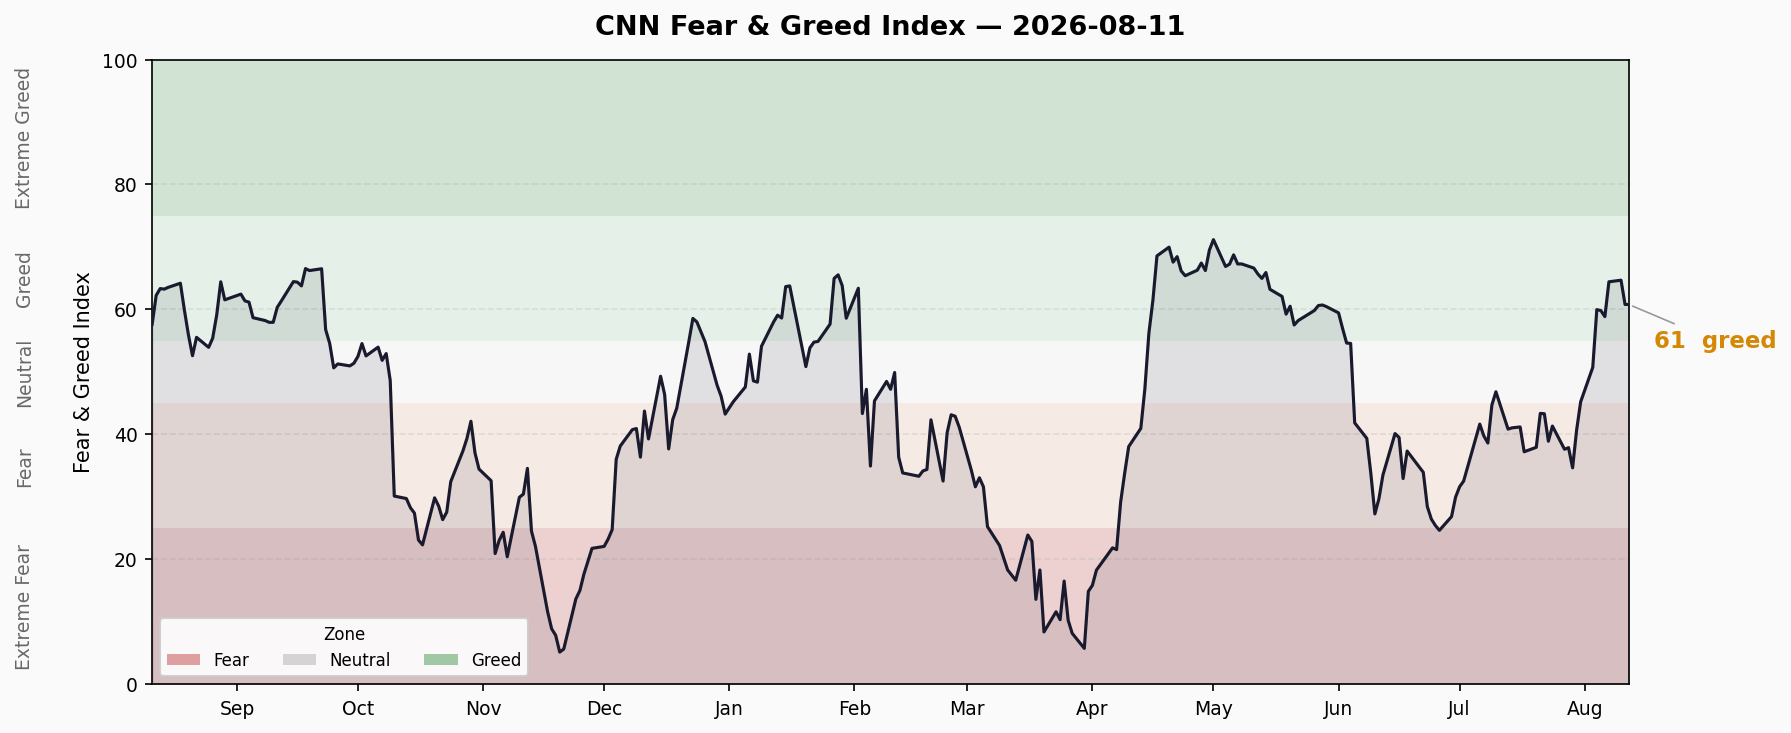
Composite index at 60.8 (Greed), down 3.6 points from prior day's 64.4. V-shaped recovery from fear zone (40.7) to greed over 10 days, but today's pullback signals waning momentum. Structural divergence: Junk Bond Demand at 98.6 (Extreme Greed) vs Price Strength at 31.4 (Fear), market breadth at 49 (Neutral). Crisis dashboard: 2 green, 2 red — FINRA margin debt at $1.502T all-time high, ETF inflows at record $1.215T YTD.
Composite Sentiment Index
| Metric | Value |
|---|---|
| Current Score | 60.8 — Greed |
| Previous Close | 64.4 (Greed) |
| 1 Week Ago | 60.0 (Greed) |
| 1 Month Ago | 46.8 (Neutral) |
| 1 Year Ago | 57.6 (Greed) |
Daily change: -3.6 points, retreating from 64.4 to 60.8, ending a 4-day consecutive advance.
10-Day Trend
| Date | Score | Rating |
|---|---|---|
| 07/30 | 40.7 | Fear |
| 07/31 | 45.2 | Neutral |
| 08/03 | 50.7 | Neutral |
| 08/04 | 60.0 | Greed |
| 08/05 | 59.8 | Greed |
| 08/06 | 58.9 | Greed |
| 08/07 | 64.4 | Greed |
| 08/10 | 64.7 | Greed |
| 08/11 | 60.8 | Greed |
Trend direction: V-shaped recovery from fear (40.7) to greed (60.8) over 10 days, a 20-point swing. However, today’s -3.6 point pullback suggests waning rebound momentum. The index has spent 5 trading days in the 60-65 range, indicating intensified bull-bear tug-of-war.
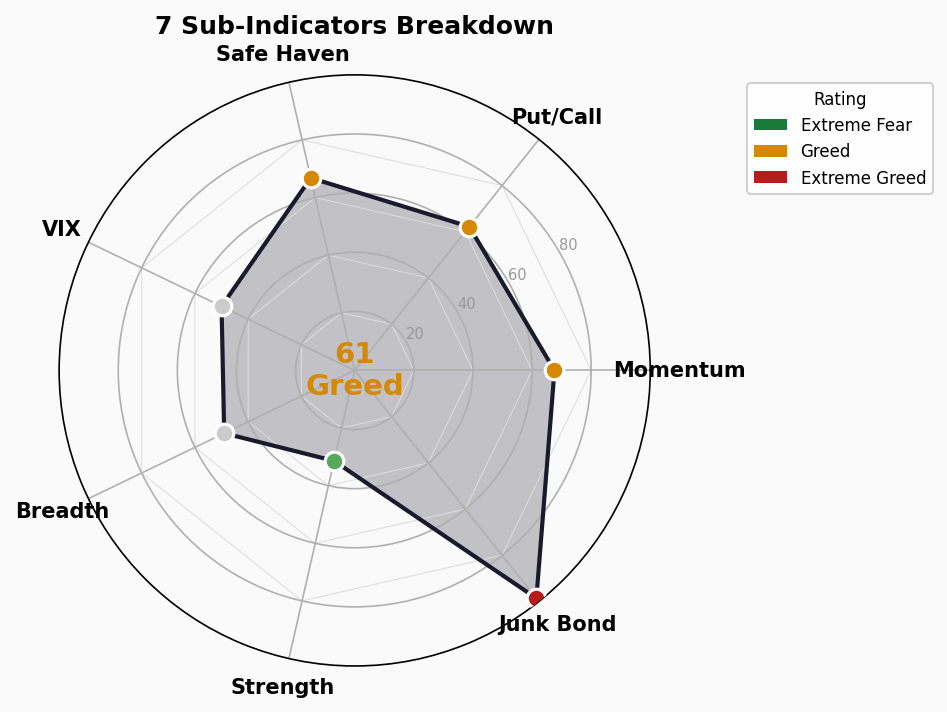
Seven Sub-Indicators Scan
| Sub-Indicator | Score | Rating | Raw Value | Signal |
|---|---|---|---|---|
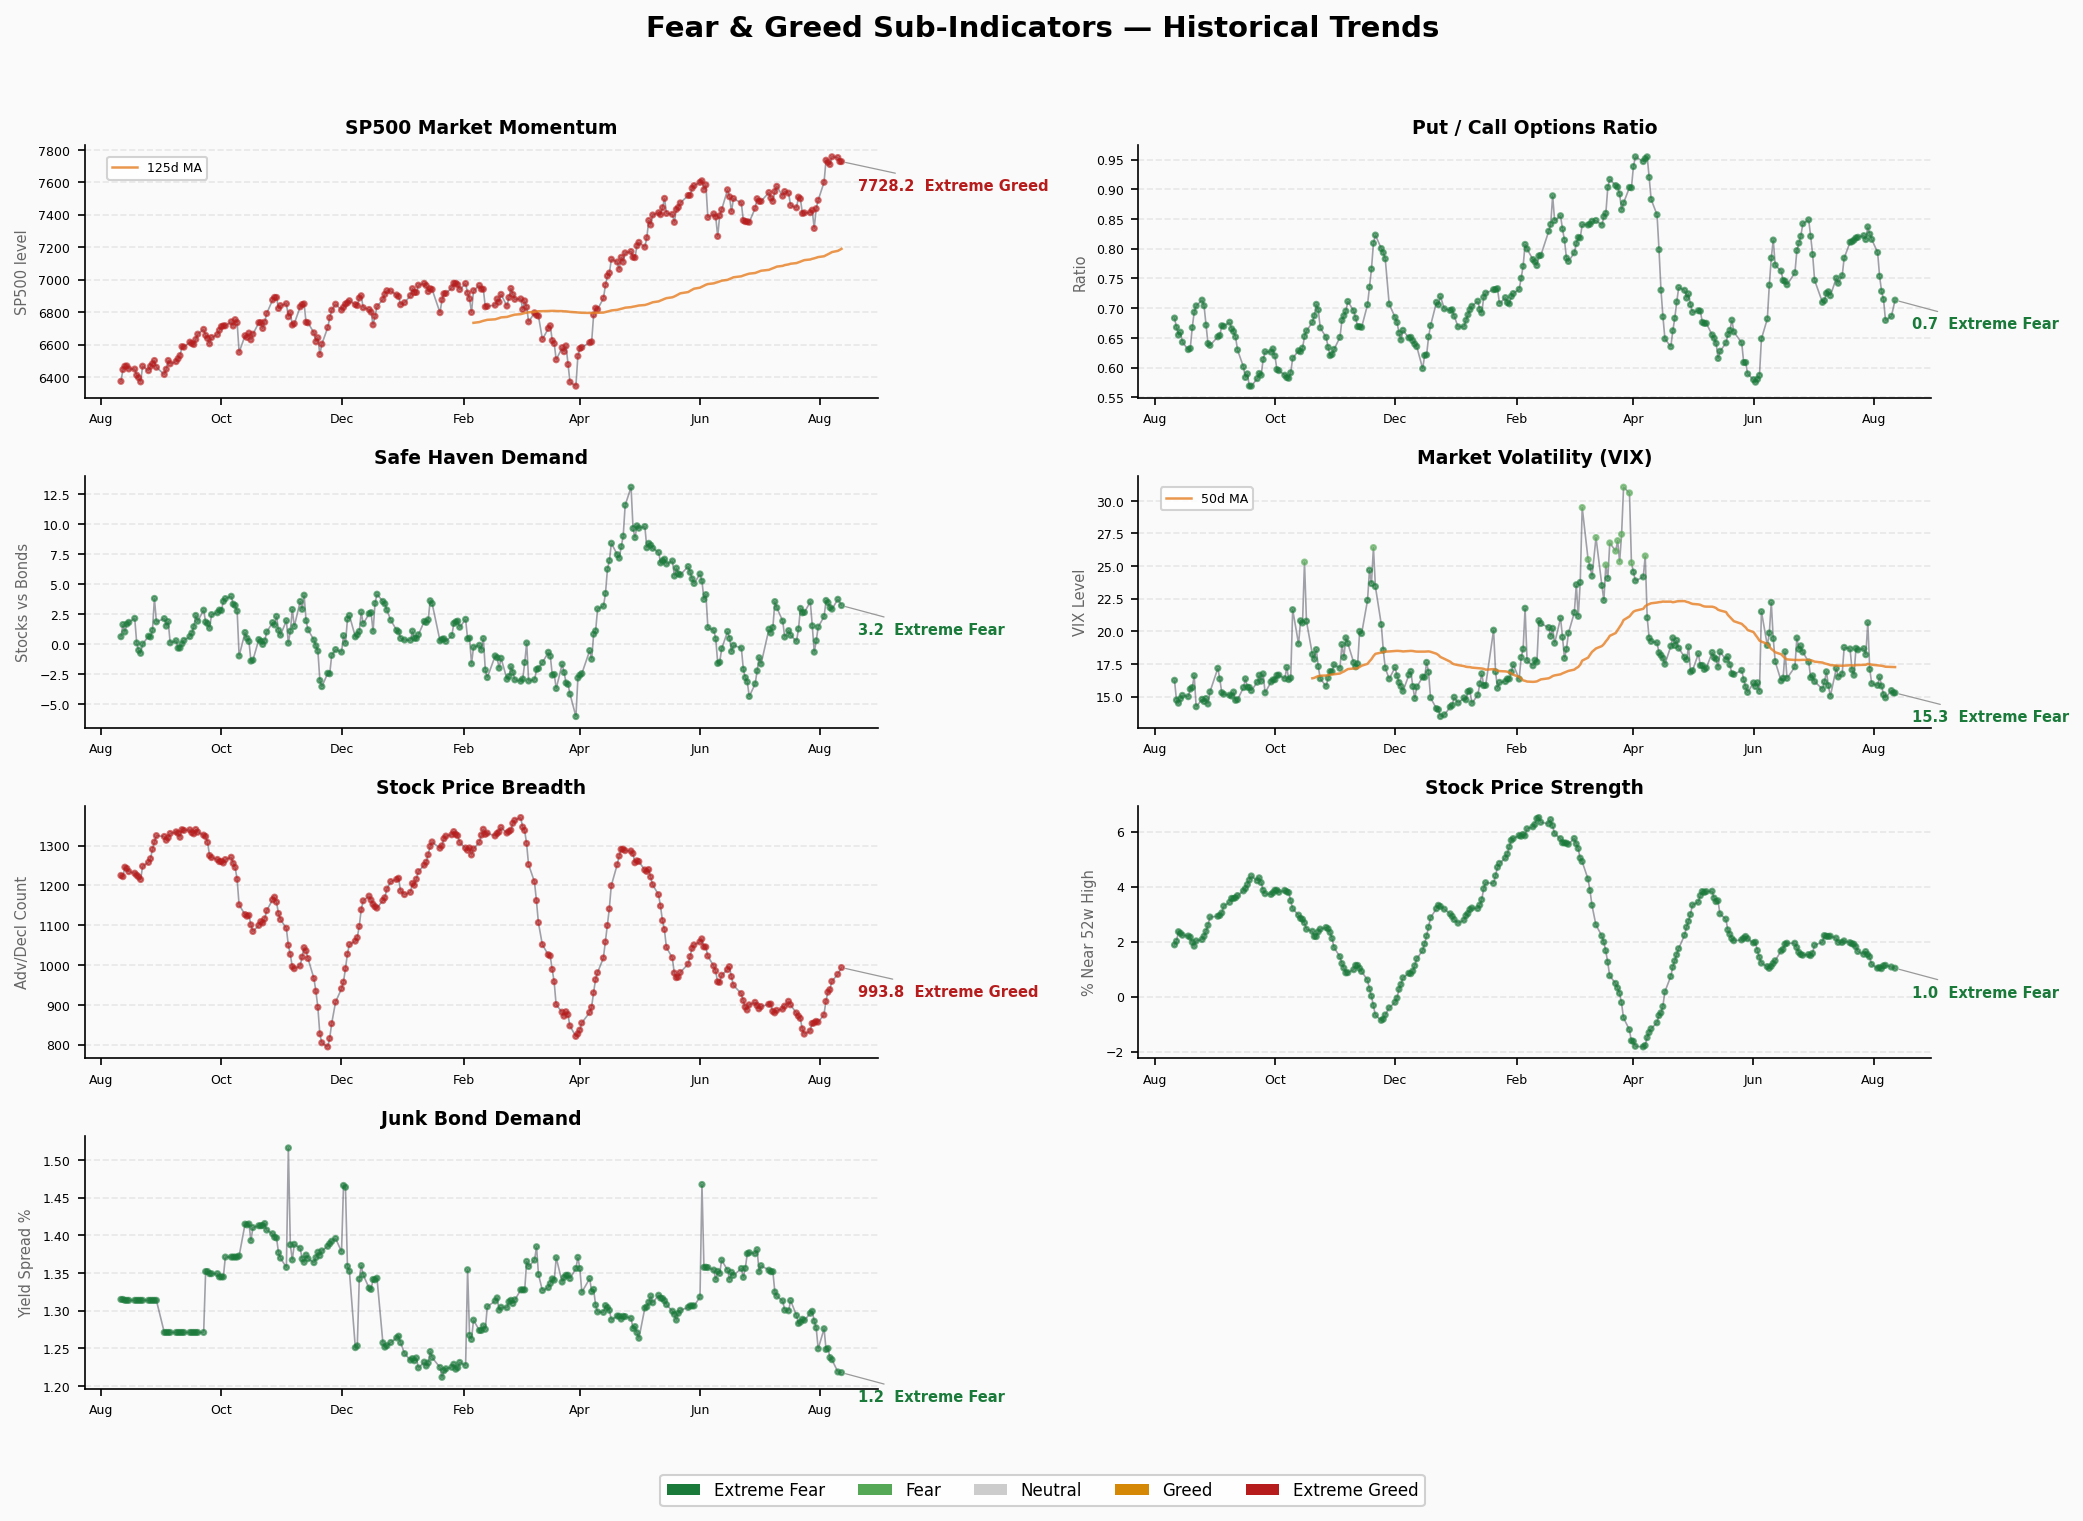
| S&P 500 Momentum | 67.6 | Greed | 7,728 | S&P 500 running at highs, momentum strong |
| Market Breadth | 49.0 | Neutral | 993.76 | Advance/decline roughly balanced, participation lacking |
| Price Strength | 31.4 | Fear | 1.04 | New highs/new lows near 1:1, few stocks hitting highs |
| Put/Call Ratio | 62.2 | Greed | 0.71 | Low Put/Call, options market leaning bullish |
| Junk Bond Demand | 98.6 | Extreme Greed | 1.22 | Spreads extremely tight, yield chasing intense |
| VIX Volatility | 50.0 | Neutral | 15.28 | VIX in normal range, no panic signal |
| Safe Haven Demand | 66.8 | Greed | 3.24 | Stocks outperforming bonds, risk-on preference |
Structural Divergence Analysis
Core Contradiction: Junk Bond Extreme Greed vs Price Strength Fear
- Junk Bond Demand 98.6 (Extreme Greed): Investors are aggressively chasing high-yield assets, compressing credit spreads to extremes. Risk pricing is severely inadequate. This typically appears near market tops.
- Price Strength 31.4 (Fear): Very few stocks are hitting new highs. The rally is concentrated in a handful of large-cap names with negligible breadth.
The 67.2-point gap between these two indicators is the most significant structural divergence in the current market. Elevated junk bond demand signals abundant liquidity, but low price strength suggests capital is funneled into a narrow set of mega-caps rather than broadly distributed.
Secondary Contradiction: Momentum Greed vs Breadth Neutral
- S&P 500 Momentum at 67.6 (Greed) diverges from Market Breadth at 49 (Neutral). Index-level strength is not translating into individual stock breadth. The S&P 500 at 7,728 masks widespread individual stock weakness, with index returns dominated by top-weighted names.
No Other Extreme Greed (>80) Indicators: Apart from Junk Bond Demand, no other sub-indicator has entered extreme greed territory. The composite at 60.8 reflects moderate greed, not yet at extreme levels.
No Extreme Fear (<20) Indicators: Price Strength at 31.4 is in fear territory but not extreme, suggesting the market is not collapsing broadly but rather experiencing structural divergence.
🚨 Crisis Precursor Indicator Dashboard
1. Credit Spreads
- HY OAS: 2.70% | 🟢 Normal
- IG OAS: 0.78% | 🟢 Normal
- Trend: HY OAS remains below the 3% threshold, no stress in credit markets. However, the Junk Bond Demand FNG sub-indicator is at 98.6 (Extreme Greed), indicating spreads are already compressed to extremes with limited room for further tightening.
- Data Date: 2026-08-10 (FRED)
2. Yield Curve
- 10Y-2Y Spread: +48bp | 🟢 Normal, slightly flat
- 10Y: 4.72% | 2Y: 4.25% | 30Y: 5.25%
- 10Y-30Y Spread: -53bp (inverted)
- Trend: Short-end curve is normal (10Y > 2Y), but the long-end 10Y-30Y is inverted by 53bp, suggesting structural concerns about long-term inflation or fiscal deficits. Overall curve shape is flattish with no crisis-precursor inversion signal.
3. Margin Debt
- FINRA Margin Debt: $1.502T (June 2026) | 🔴 All-time high
- Monthly Change: +$86.5B (up 6.1% from May’s $1.416T)
- Year-over-Year: +49.0% (from $1.008T in June 2025)
- Trend: Margin debt is surging at an accelerating pace. At approximately 4.1% of GDP, it exceeds peaks seen before the dot-com crash (March 2000) and the GFC (July 2007). Leverage is extremely crowded. Any sustained market downturn risks a cascading effect from forced liquidations.
4. IPO Activity & Fund Flows
- 2026 YTD IPO: ~73 (Renaissance Capital)
- 2026 YTD ETF Net Inflows: $1.215T (through July) | 🔴 Record pace
- H1 2026 net inflows: $1T (strongest first half ever)
- July alone: $192.7B
- Daily average: $5.7B (+40% vs 2025’s record pace)
- Full-year projection: $2.3T
- Trend: Capital inflow velocity far exceeds any historical period. Passive fund flows continue to push indices higher. With both ETF inflows and margin debt at all-time records, this is a liquidity-driven rally with classic late-cycle characteristics.
Summary Assessment
| Indicator | Status |
|---|---|
| Credit Spreads | 🟢 Normal |
| Yield Curve | 🟢 Normal, slightly flat |
| Margin Debt | 🔴 All-time high |
| Fund Flows | 🔴 Record pace |
2 🟢 / 0 🟡 / 2 🔴
Credit and yield curve “hard indicators” remain normal with no immediate systemic risk signal. However, margin debt and fund flows — the two “behavioral indicators” — are both flashing red, with market leverage and capital inflow velocity exceeding any prior historical peak. Combined with the severe divergence between Junk Bond Demand (98.6, Extreme Greed) and Price Strength (31.4, Fear) in the FNG sub-indicators, the market is in a liquidity-driven narrow rally state: healthy at the index level but structurally fragile underneath. Any marginal tightening of liquidity or widening of credit spreads could amplify into a sharp correction under extreme leverage conditions.