CNN Fear & Greed Sentiment Analysis 2026-08-11
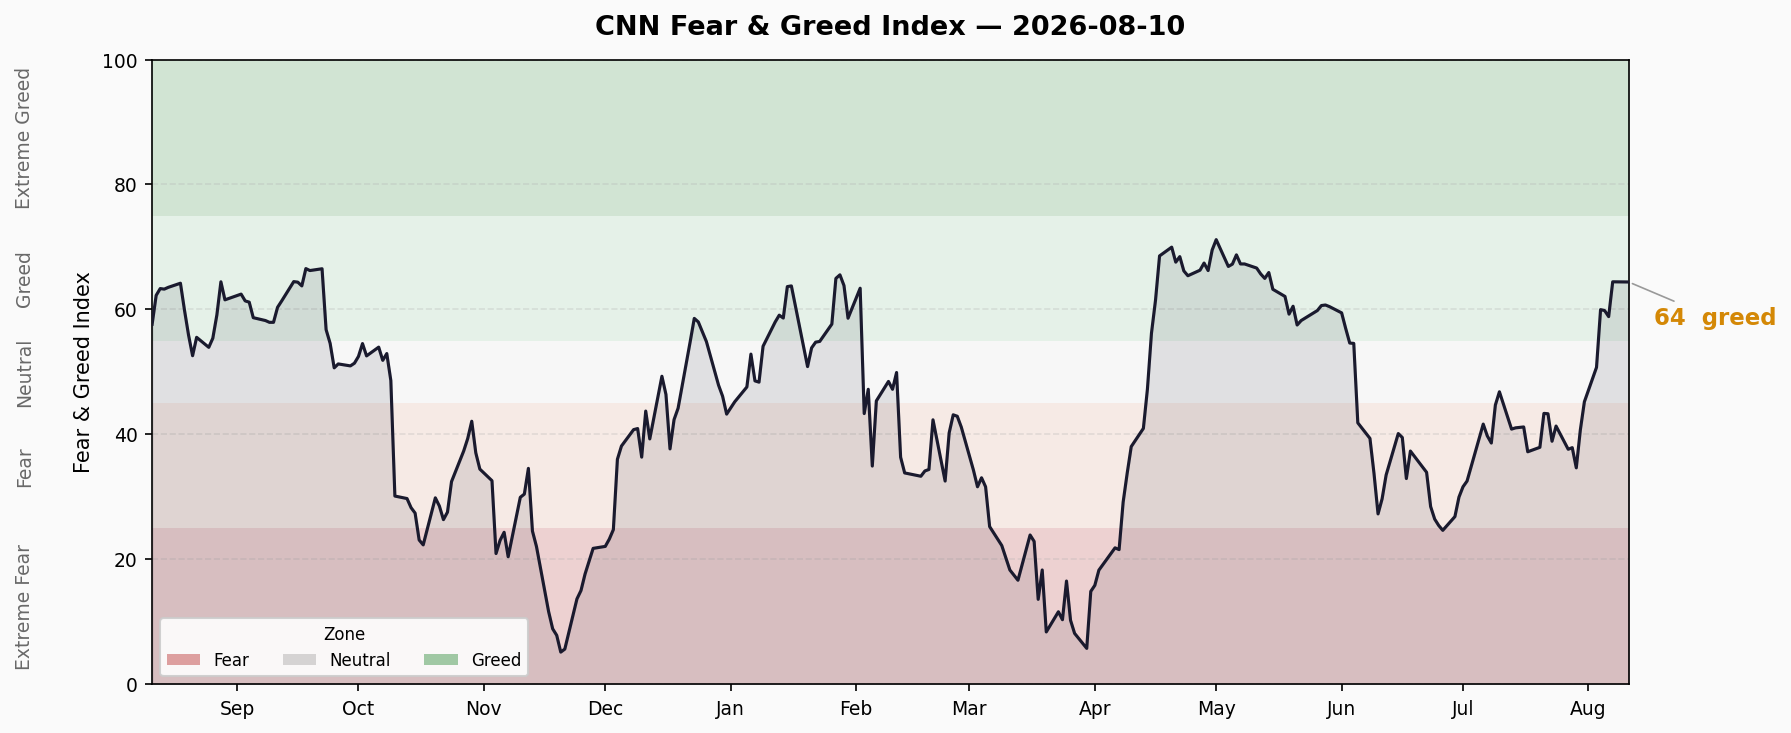
Composite index at 64.4 (Greed), unchanged from Friday. Surged +26.5 points over 10 trading days from fear zone (37.9) to greed zone (64.4). Significant structural divergence: momentum, put/call ratio, and junk bond demand at extreme greed, while stock price strength and breadth remain in fear territory — exposing a narrow concentration rally. Crisis signals: credit spreads normal (HY 2.70% / IG 0.78%), yield curve normal but slightly flat (10Y-2Y +47bp), but margin debt at all-time high ($1.502T, +49% YoY), IPO and ETF inflows at record levels — risk accumulation ongoing.
Composite Index Trend
Latest Reading: 64.4 — Greed
| Date | Score | Rating |
|---|---|---|
| Aug 10 (Mon) | 64.4 | Greed |
| Aug 7 (Fri) | 64.4 | Greed |
| Aug 6 | 58.9 | Greed |
| Aug 5 | 59.8 | Greed |
| Aug 4 | 60.0 | Greed |
| Aug 3 | 50.7 | Neutral |
| Jul 31 | 45.2 | Neutral |
- vs. Previous Day: 64.4 → 64.4, flat (first trading day after weekend, no change)
- 10-Day Trend: Jul 28 37.9 (Fear) → Aug 10 64.4 (Greed), cumulative +26.5 points
- Phase Transition: Fear zone → crossed into Neutral on Jul 31 → crossed into Greed on Aug 4 → has remained in Greed for 5 trading days
- Direction: Jumped +5.5 on Aug 7, then flattened on Aug 10. Consolidating in Greed zone
Seven Sub-Indicators Scan
| # | Indicator | Score | Rating | Raw Value | vs. Prev Day |
|---|---|---|---|---|---|
| 1 | S&P 500 Momentum | 76.8 | Extreme Greed | 7753.11 | ↓ -4.5 |
| 2 | Stock Price Strength | 31.8 | Fear | 1.08 | ↓ -0.06 |
| 3 | Stock Price Breadth | 44.2 | Fear | 976.75 | ↑ +17.7 |
| 4 | Put/Call Options | 77.4 | Extreme Greed | 0.69 | ↑ +0.01 |
| 5 | VIX Volatility | 50.0 | Neutral | 15.46 | ↑ +0.56 |
| 6 | Junk Bond Demand | 98.8 | Extreme Greed | 1.22 | ↓ -0.01 |
| 7 | Safe Haven Demand | 71.8 | Greed | 3.76 | ↑ +0.82 |
Indicator-by-Indicator Analysis:
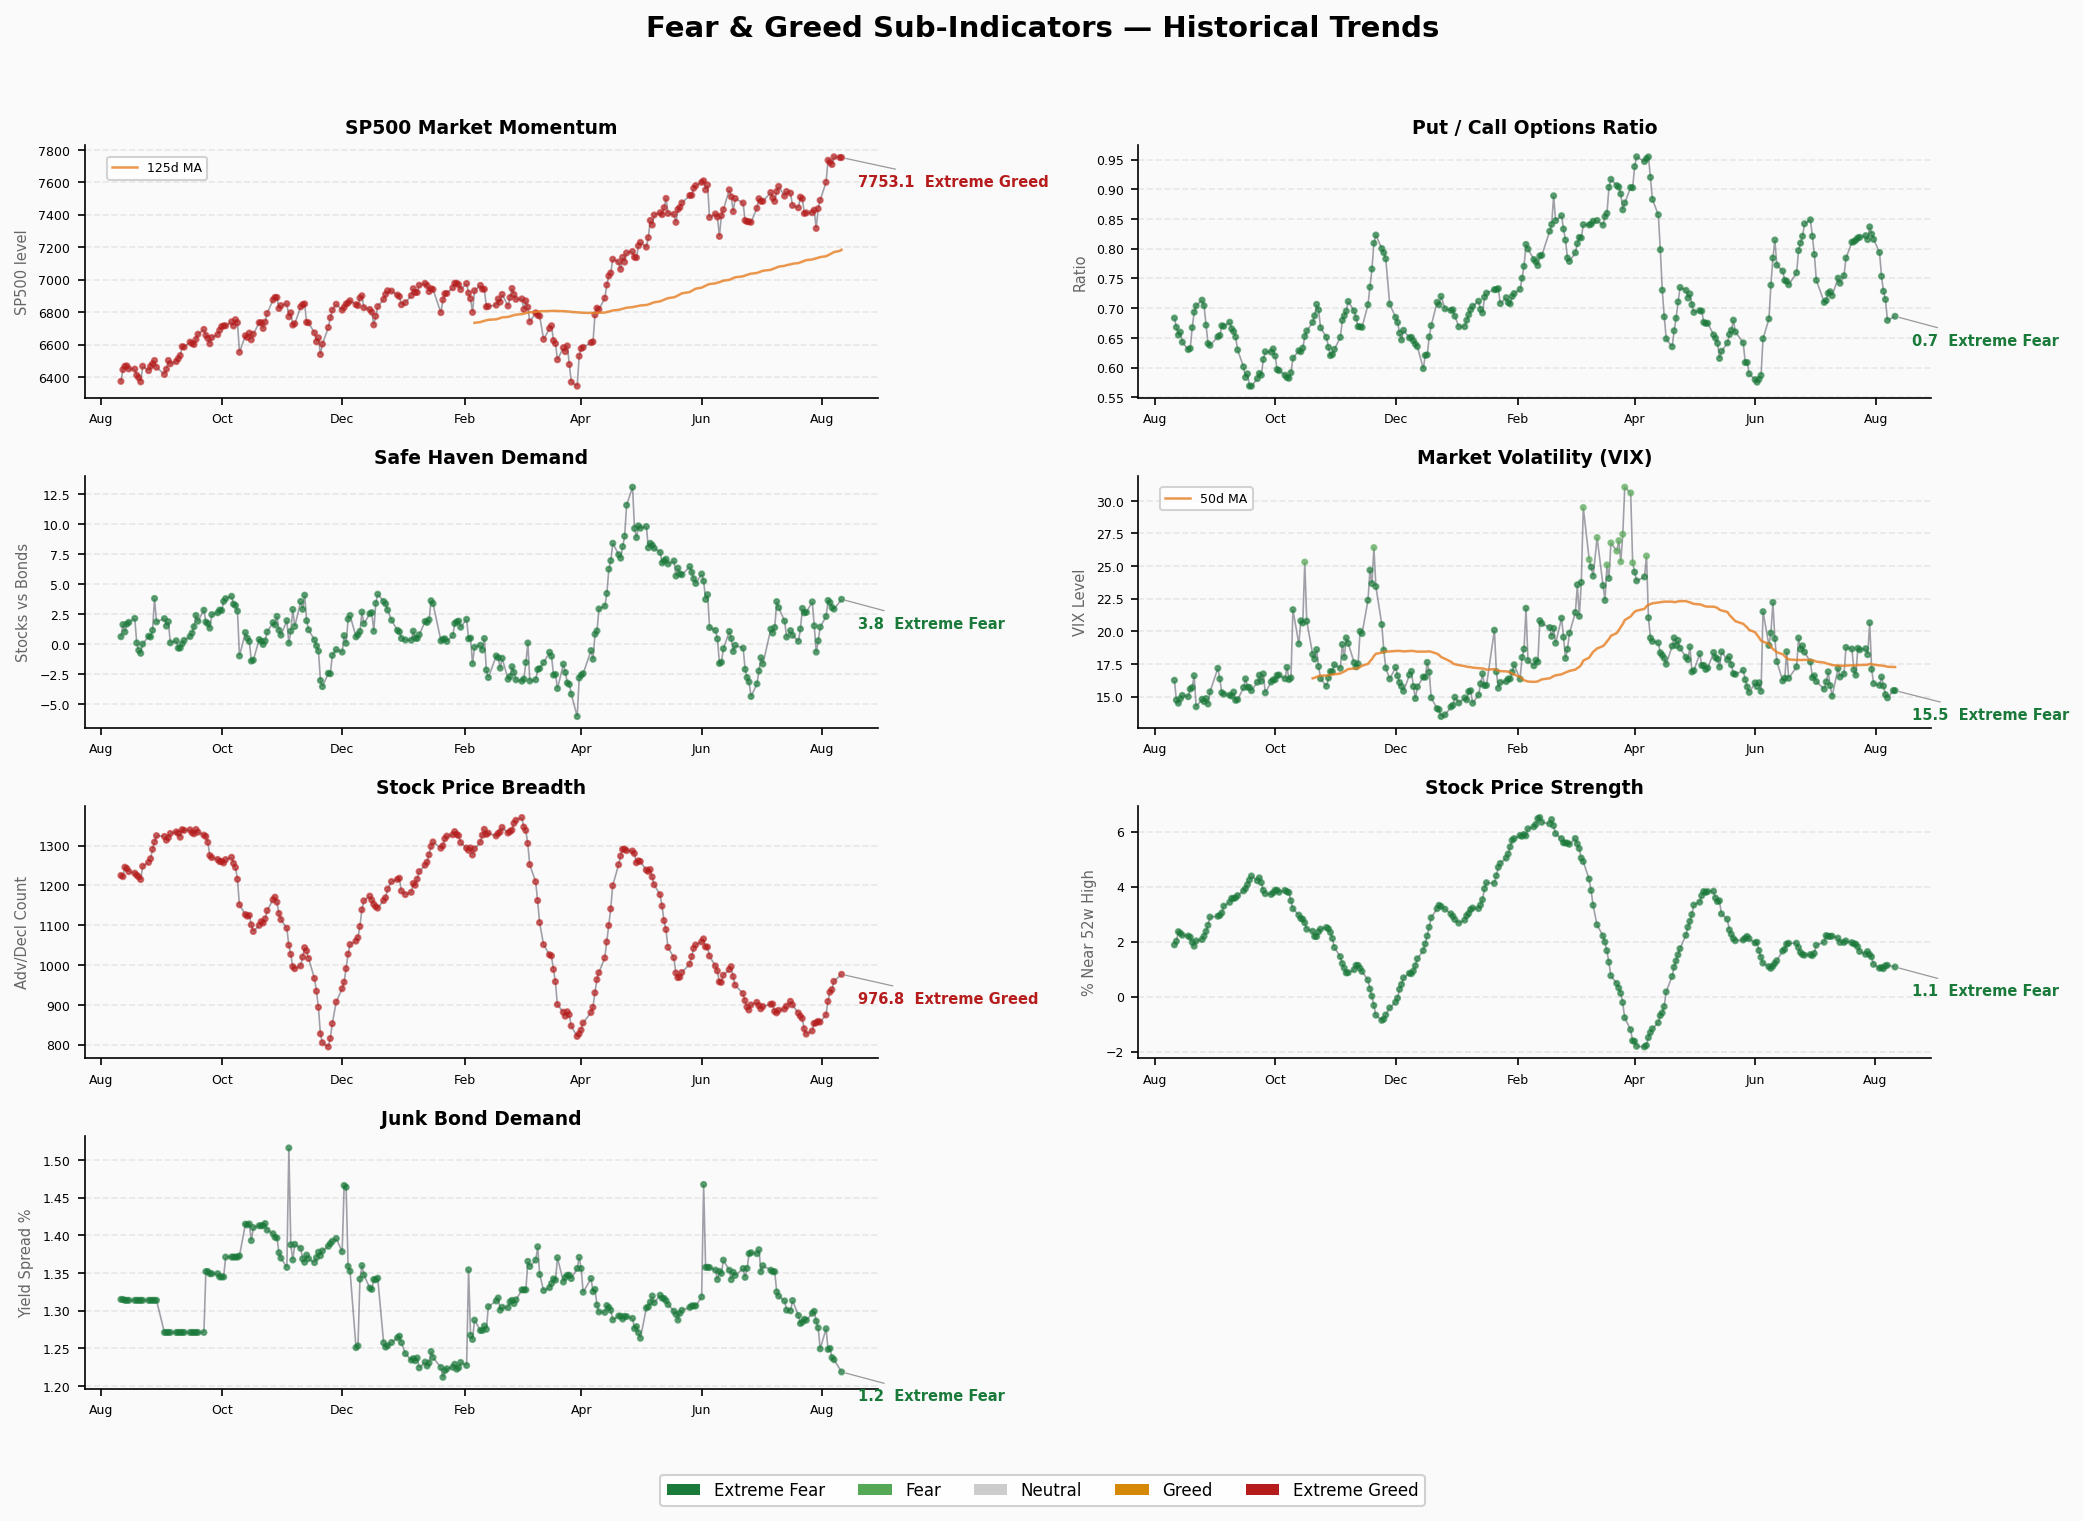
S&P 500 Momentum (76.8 / Extreme Greed): Index at 7753, well above 125-day moving average. Strong momentum, but down 4.5 points intraday — early signs of slowing upside.
Stock Price Strength (31.8 / Fear): Proportion of stocks hitting 52-week highs is low. With the index at elevated levels, individual stock new-high capability is insufficient — a classic “index up, stocks not” pattern.
Stock Price Breadth (44.2 / Fear): Advancers vs. decliners show narrowing breadth. Index maintains high levels, but internal participation is declining. Breadth improved slightly intraday (+17.7), but remains in fear territory.
Put/Call Options (77.4 / Extreme Greed): Put/Call ratio at 0.69. Options market is extremely bullish — traders are heavily buying Calls over Puts, with very low hedging appetite.
VIX Volatility (50.0 / Neutral): VIX at 15.46, historically low. Up 0.56 intraday, suggesting a slight uptick in market nervousness, but overall still calm.
Junk Bond Demand (98.8 / Extreme Greed): Spread between junk and investment-grade bonds is extremely tight. Capital is flooding into high-yield debt. This indicator is near maximum — risk appetite could not be much higher.
Safe Haven Demand (71.8 / Greed): Treasury demand relative to stock demand is low. Capital prefers risk assets. Safe haven demand declined further intraday (+0.82), risk appetite continuing to warm.
Structural Divergence Analysis
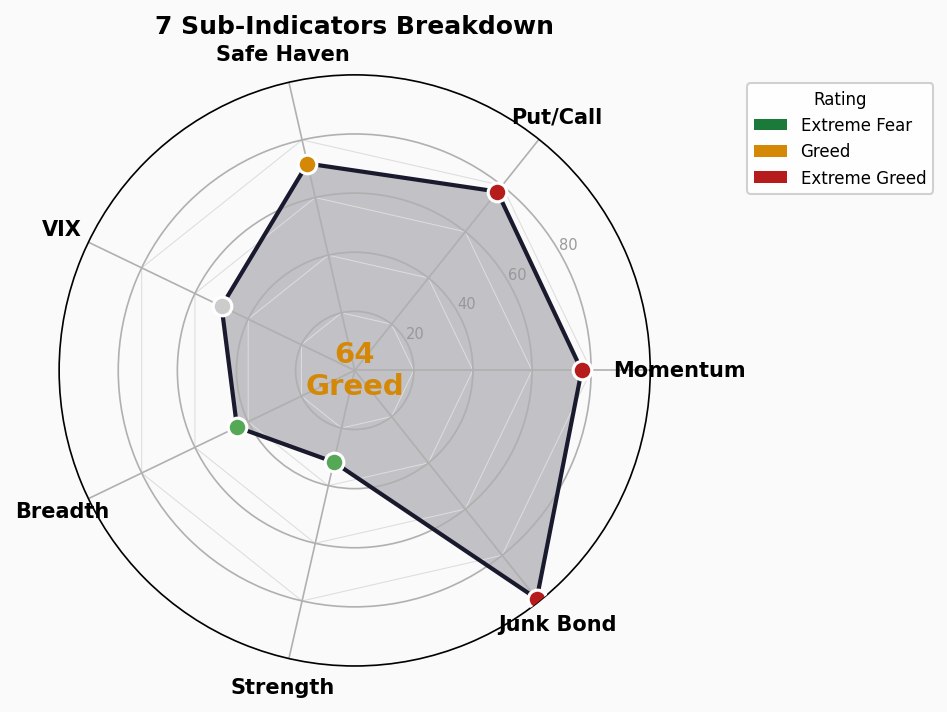
The current FNG exhibits a classic “extreme divergence” structure:
Extreme Greed Camp (>75):
- S&P 500 Momentum: 76.8
- Put/Call Ratio: 77.4
- Junk Bond Demand: 98.8
Fear Camp (<45):
- Stock Price Strength: 31.8
- Stock Price Breadth: 44.2
Core Contradiction: Index momentum and options sentiment are at extreme greed, but individual stock measures — new-high capability and advance breadth — are in fear. This means the current rally is concentrated in a handful of mega-cap stocks. Market participants are expressing bullish sentiment through index products (ETFs) and options, rather than broad individual stock exposure.
Junk Bond Demand at 98.8 is another warning signal. A near-maximum reading means the credit market is pricing risk at almost zero — investors are chasing yield while completely ignoring credit risk. Historically, extremely tight junk bond spreads have often preceded risk appetite reversals.
Safe Haven Demand rising alongside VIX: Both “safety-oriented” indicators ticked up intraday (safe haven +0.82, VIX +0.56), but scores remain in greed/neutral territory. If these two continue to rise, it could signal the early stages of a sentiment shift.
Trend Assessment
- Duration in Zone: Composite has been in Greed for 5 trading days (since Aug 4). The prior move from Fear to Greed took only 4 trading days (Jul 31 → Aug 4) — an extremely rapid ascent
- Reversal Signals: Composite jumped +5.5 on Aug 7, then flattened on Aug 10. Upward momentum has paused, but no reversal signal yet
- Distance to Extreme Greed (>75): Still 10.6 points away. If stock strength and breadth improve, the composite could push into extreme greed — but if momentum and options sentiment pull back, the index may correct from current levels
- Key Watchpoint: Whether Stock Price Strength (31.8) and Breadth (44.2) improve — if they recover to neutral (50+), the composite will easily break above 70; if they continue to deteriorate, the divergence with momentum will intensify, creating a fragile market structure
🚨 Crisis Precursor Dashboard
1. Credit Spreads
- High Yield OAS: 2.70% | 🟢 Normal (Thresholds: <3% normal / 3-5% caution / 5-8% panic / >8% crisis)
- Investment Grade OAS: 0.78% | 🟢 Normal (Thresholds: <1% normal / 1-2% caution / >2% panic)
- Trend: HY OAS holding at 2.70% — no stress in credit markets. However, FNG junk bond demand score has reached 98.8 (extreme greed), meaning spreads are compressed to the limit with little room to tighten further
2. Yield Curve
- 10Y-2Y Spread: +47bp | 🟢 Normal, slightly flat
- 10Y: 4.65% | 2Y: 4.19% | 30Y: 5.19%
- Trend: Curve has normalized (no longer inverted). 10Y-2Y at +47bp is in the normal-to-low range. 30Y-10Y spread at +54bp — long-end curve shape is healthy
3. Margin Debt
- FINRA Margin Debt: $1.502T (June 2026) | 🔴 All-Time High
- MoM: +6.1% (+$86.5B), May $1.416T → June $1.502T
- YoY: +49.0% (+$494B), Jun 2025 $1.008T → Jun 2026 $1.502T
- Trend: Margin debt has climbed for 8 consecutive months. June’s $86.5B jump is one of the fastest monthly increases on record. Leverage levels are now nearly double the 2021 peak (~$780B). This is a strong systemic risk signal
4. IPO Market
- 2026 H1 IPOs: 62 deals (>$50M), raising ~$114.1B | 🔴 Record
- YoY: Proceeds are 7x+ compared to H1 2025 ($14.8B → $114.1B)
- Highlights: SpaceX IPO was the largest in history; Cerebras Systems priced 50% above initial range
- Trend: IPO market is booming with massive capital flowing into primary markets. Historically, wide-open IPO windows have often coincided with market tops
5. Fund Flows
- 2026 H1 ETF Net Inflows: $1 trillion | 🔴 Record
- Equity ETFs: $680B (more than double YoY)
- Full-Year Projection: $2.3T (vs. $1.5T full-year 2025)
- Trend: ETF capital is flowing in at a historic pace. Rolling 12-month inflows have reached $2T. Passive capital continues to push indices higher
Summary Assessment
| Indicator | Status |
|---|---|
| Credit Spreads | 🟢 Normal |
| Yield Curve | 🟢 Normal, slightly flat |
| Margin Debt | 🔴 All-Time High |
| IPO Market | 🔴 Record Hot |
| Fund Flows | 🔴 Record Inflows |
2 🟢 / 0 🟡 / 3 🔴
Credit and yield curve — the two “hard indicators” — remain healthy. However, margin debt, IPO activity, and fund flows — the three “behavioral indicators” — are all flashing red. Current leverage levels and capital inflow velocity have far exceeded the 2021 peak. Credit spreads are low, but FNG junk bond demand is at 98.8 — the credit market’s risk pricing is extremely optimistic, and there is virtually no room for further spread compression. Once credit spreads begin to widen, the other risk indicators will deteriorate rapidly.