CNN Fear & Greed Sentiment Analysis 2026-08-10
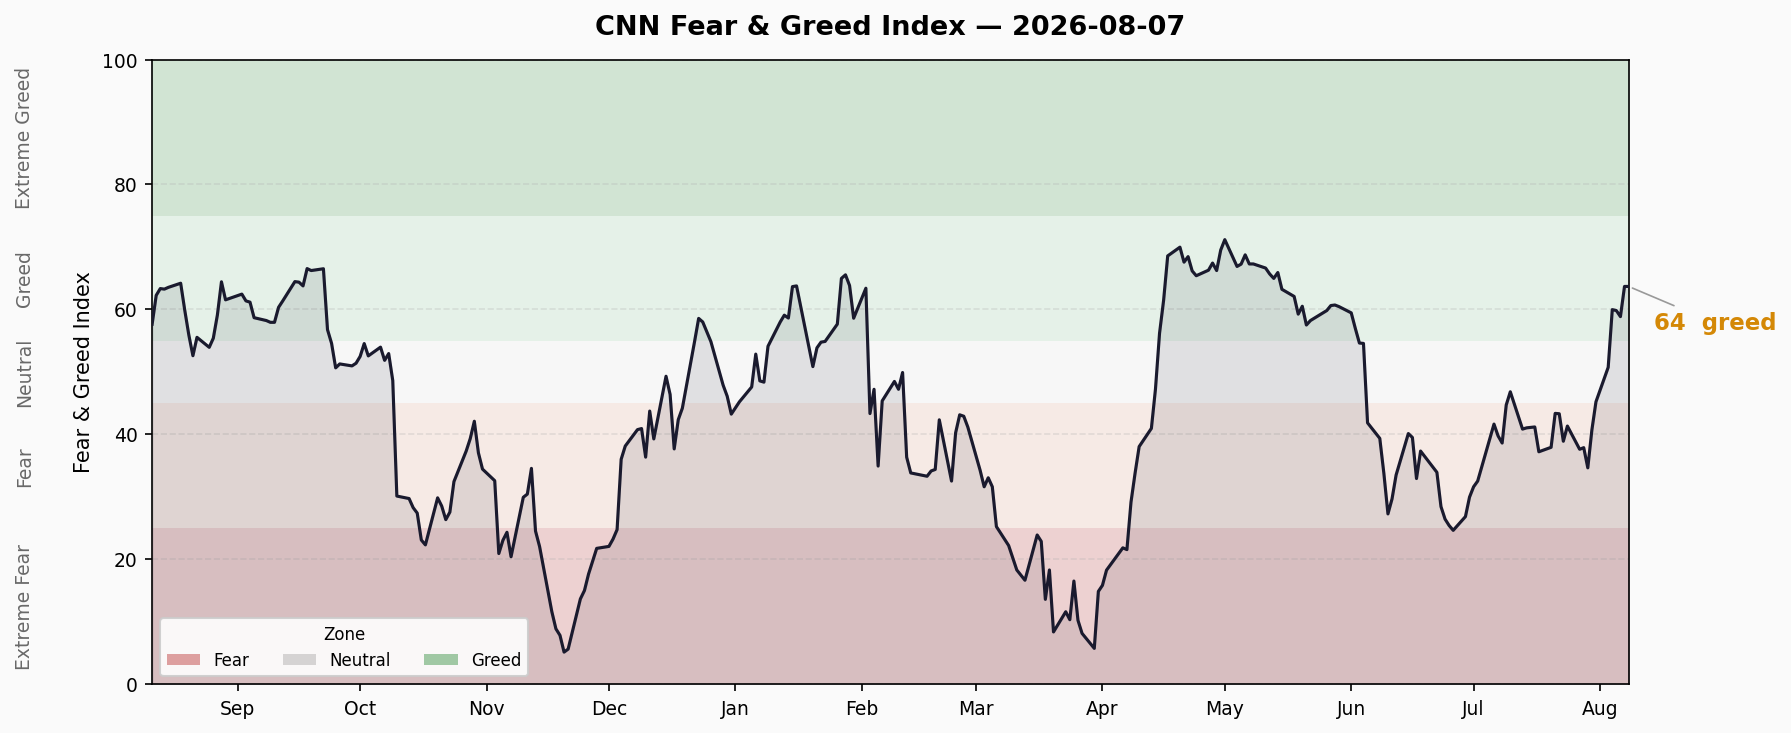
Composite score 63.7 (Greed), up +4.8 from prior day. S&P 500 momentum at extreme greed but stock price strength and breadth in fear — narrow rally signature. Junk bond demand 97.4 near maximum, put/call ratio 81.6 extreme greed, risk appetite elevated. FINRA margin debt at $1.502T all-time high, ETF YTD inflows ~$1.3T.
Composite Index
| Metric | Value |
|---|---|
| Composite FNG Score | 63.7 — Greed |
| Previous Day | 58.9 — Greed |
| Daily Change | +4.8 |
| Data Date | 2026-08-07 (Friday close) |
Last 10 Trading Days:
| Date | Score | Rating |
|---|---|---|
| 07-28 | 37.9 | Fear |
| 07-29 | 34.7 | Fear |
| 07-30 | 40.7 | Fear |
| 07-31 | 45.2 | Neutral |
| 08-03 | 50.7 | Neutral |
| 08-04 | 60.0 | Greed |
| 08-05 | 59.8 | Greed |
| 08-06 | 58.9 | Greed |
| 08-07 | 63.7 | Greed |
Trend Reading: The composite swung from Fear (34.7 on Jul 29) to Greed (63.7 on Aug 7) — a +29 point surge in just 7 trading days. The last three days show stabilization within the Greed zone (58.9→59.8→63.7), with a decelerating but still upward slope. A push above 75 would enter Extreme Greed territory, which historically tends to precede short-term pullbacks.
Seven Sub-Indicators Scan
1. Market Momentum (S&P 500 vs 125-day MA)
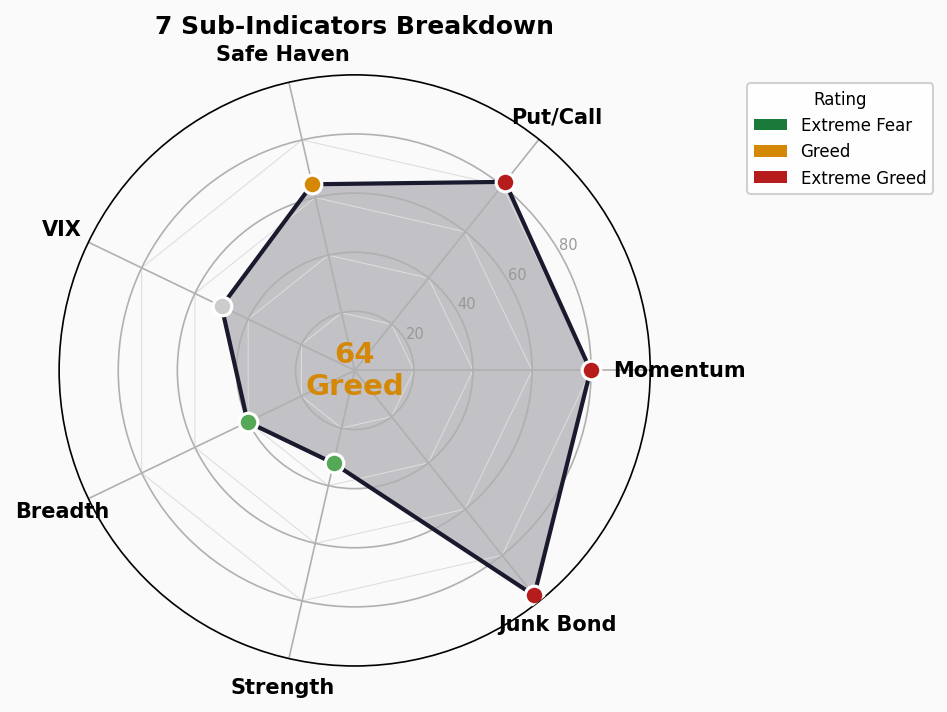
- Score: 79.8 — Extreme Greed 🔴
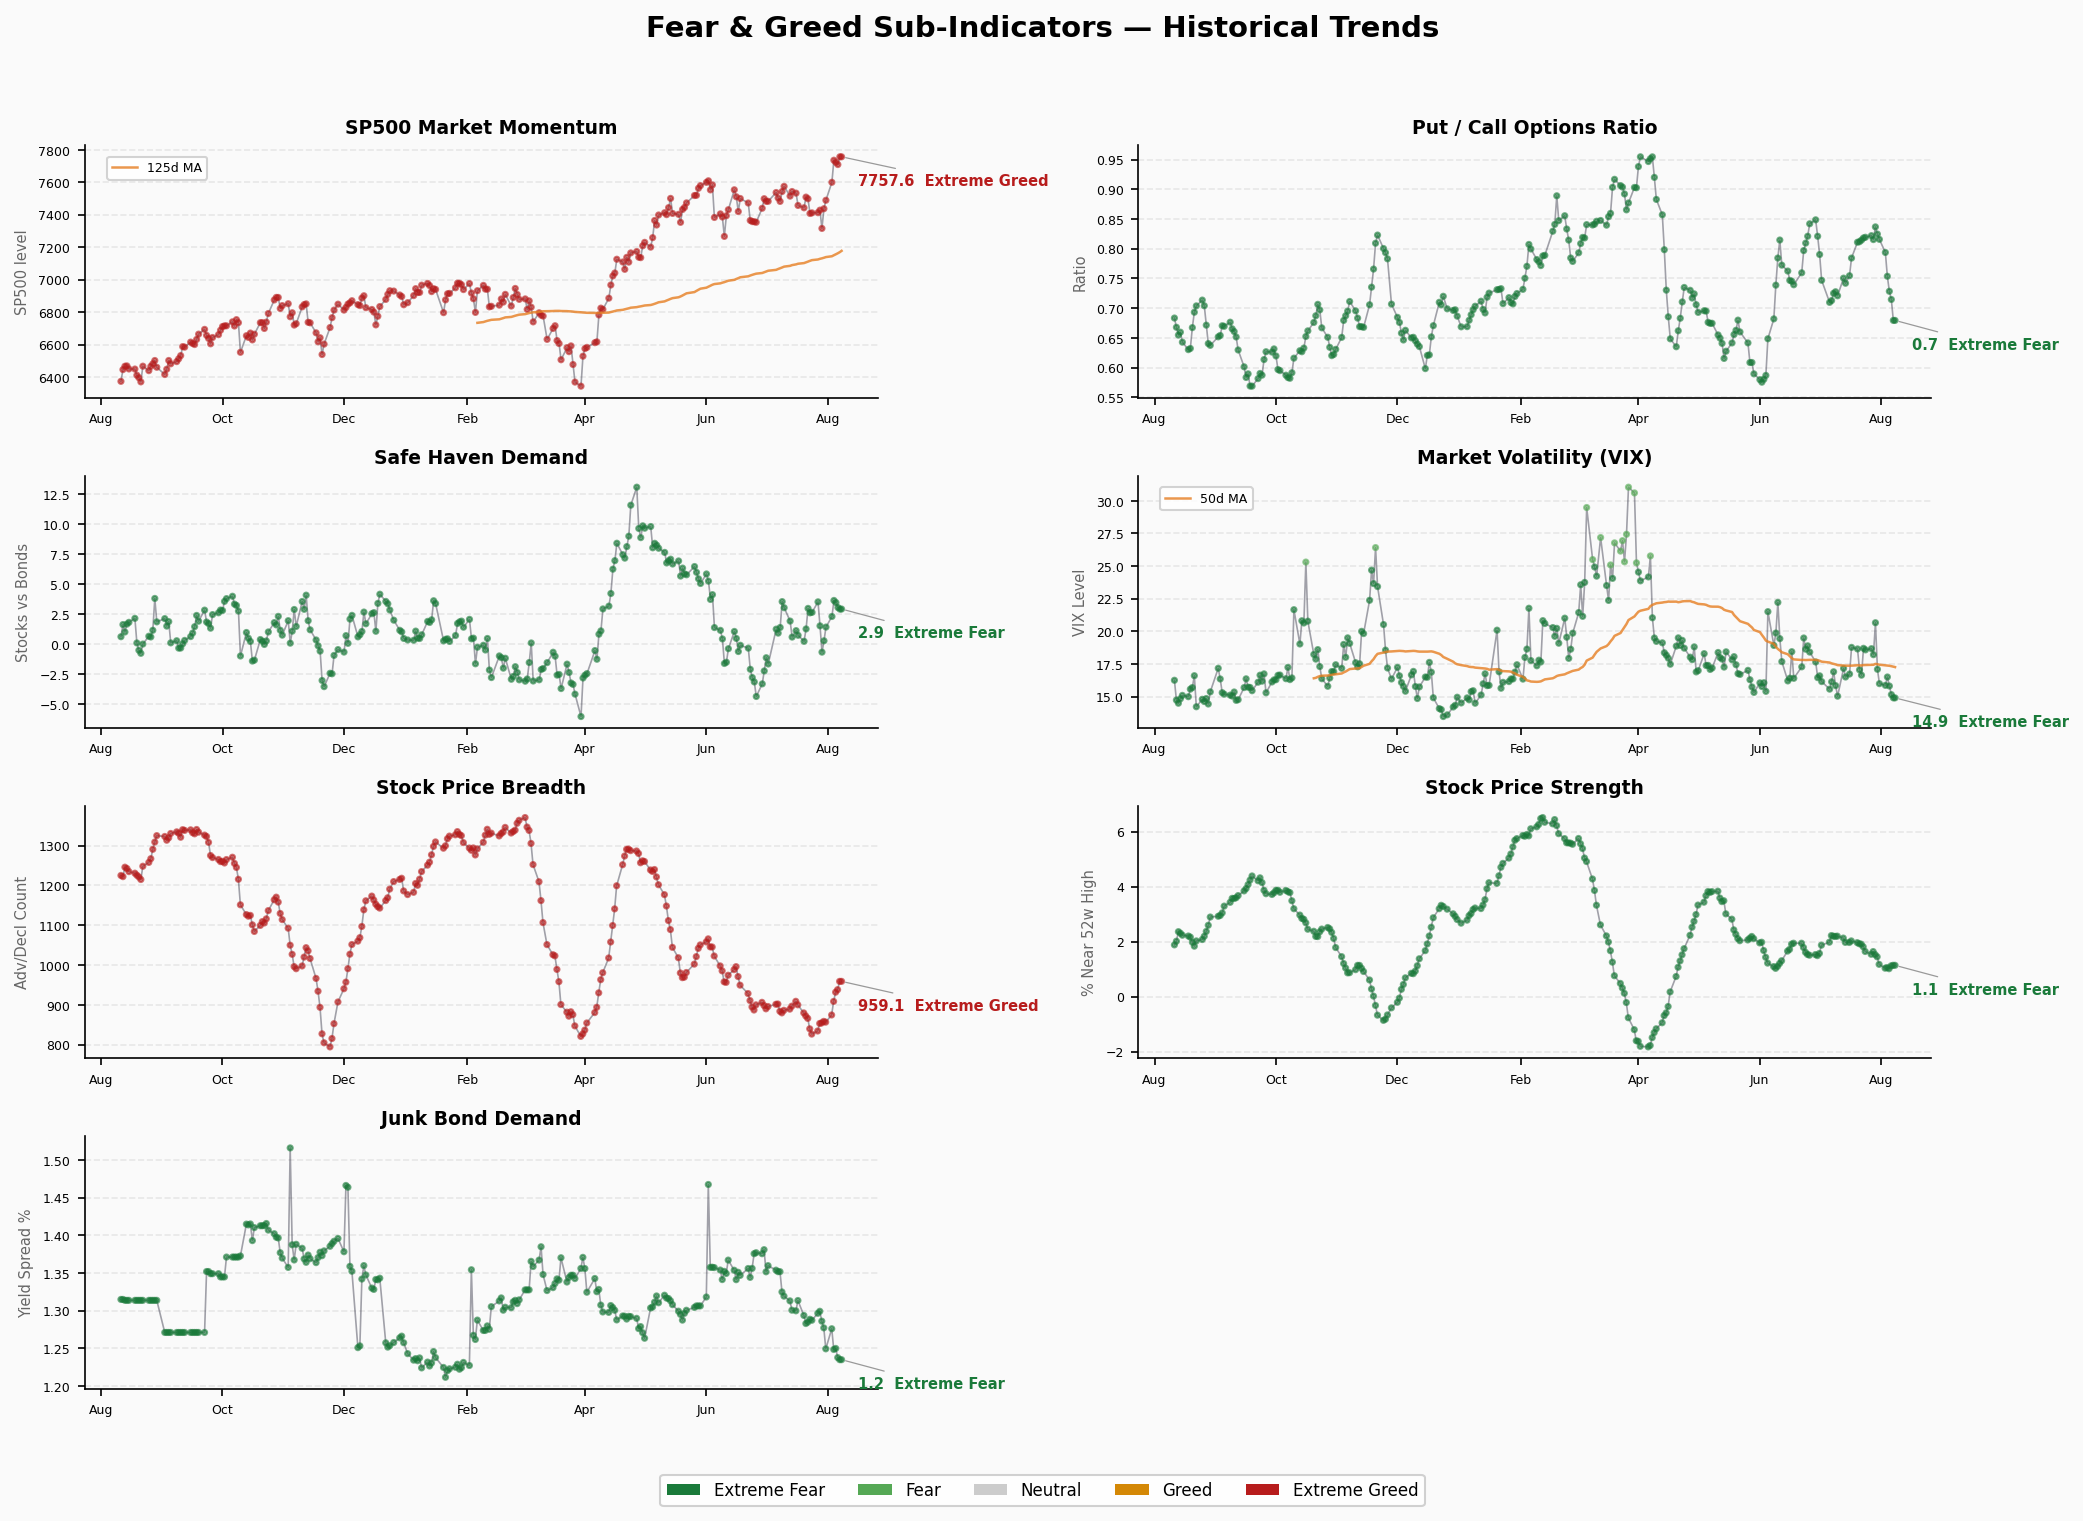
- Raw Value: S&P 500 = 7,757.64 (well above 125-day MA)
- Daily Change: +47.7 ↑
- 5-Day Trend: 7437→7600→7736→7710→7758, continuous upside
- Reading: S&P 500 far exceeds its 125-day moving average, momentum extremely strong. But note: index-level strength does not mean broad participation (see strength and breadth below).
2. Stock Price Strength
- Score: 32.2 — Fear 🟡
- Raw Value: New High/Low Ratio = 1.14%
- Daily Change: +0.02 ↑
- 5-Day Trend: 1.04→1.06→1.02→1.12→1.14, slight recovery from lows
- Reading: Very few stocks making new highs; most issues are far from peak levels. Index rising but individual stocks not participating — a classic mega-cap dominated rally.
3. Stock Price Breadth
- Score: 40.2 — Fear 🟡
- Raw Value: McClellan Oscillator = 959.07
- Daily Change: +20.83 ↑
- 5-Day Trend: 875→909→932→938→959, improving steadily
- Reading: Breadth indicator is in fear territory but continuously improving, with the McClellan Oscillator rising from 875 to 959 over 5 days. If improvement continues, breadth fear may ease. However, the “few stocks rising” pattern persists for now.
4. Put/Call Options Ratio
- Score: 81.6 — Extreme Greed 🔴
- Raw Value: P/C Ratio = 0.6794
- Daily Change: -0.035 ↓ (lower ratio = more bullish)
- 5-Day Trend: 0.79→0.75→0.73→0.71→0.68, persistent decline
- Reading: Put/Call ratio has fallen for 5 consecutive days to 0.68, indicating the options market is extremely bullish with almost no one buying put protection. This “unprotected” state amplifies losses during market reversals.
5. Market Volatility (VIX)
- Score: 50 — Neutral ⚪
- Raw Value: VIX = 14.90
- Daily Change: -0.25 ↓
- 5-Day Trend: 15.86→16.50→15.81→15.15→14.90, downward trend
- Reading: VIX is near the 15 low zone but not yet at extreme levels. Continued VIX decline reflects diminishing volatility expectations, but combined with the P/C ratio, this is “complacency in calm.”
6. Junk Bond Demand
- Score: 97.4 — Extreme Greed 🔴
- Raw Value: HY vs IG Spread = 1.2349%
- Daily Change: -0.003 ↓ (spread tightening = more greedy)
- 5-Day Trend: 1.276→1.249→1.250→1.238→1.235, continuous tightening
- Reading: Junk bond spread at just 1.23%, near historical tights. The credit market is pricing virtually zero default risk — investors are piling into junk bonds chasing yield. A score of 97.4 approaches maximum and is the most extreme of all sub-indicators.
7. Safe Haven Demand
- Score: 64.6 — Greed 🟠
- Raw Value: Stock vs Treasury Returns = 2.9446
- Daily Change: -0.124 ↓
- 5-Day Trend: 0.30→3.66→3.48→3.07→2.94, peak and pullback
- Reading: Stocks significantly outperforming Treasuries, capital flowing from safe havens to risk assets. Though off the 3.66 peak, absolute levels remain elevated.
Structural Contradictions
⚠️ Contradiction 1: Index Strength vs Individual Stock Weakness (Core Contradiction)
- S&P 500 Momentum: 79.8 (Extreme Greed)
- Stock Price Strength: 32.2 (Fear)
- Stock Price Breadth: 40.2 (Fear)
This is the most significant structural contradiction in the current market. The S&P index far exceeds its moving average with extreme momentum, but very few stocks are making new highs and market breadth remains in fear territory. The 47.6-point剪刀差 (scissor gap) between momentum and strength indicates the rally is highly concentrated in a handful of mega-cap stocks. Historically, prolonged divergence resolves in one of two ways: breadth improves (small caps catch up) or the index falls (large caps correct).
⚠️ Contradiction 2: Credit Market “Zero Risk” Pricing
- Junk Bond Demand: 97.4 (Extreme Greed)
- HY OAS Actual Spread: 2.71%
CNN’s junk bond demand indicator approaches maximum (97.4), while FRED data shows HY OAS at only 2.71%. Credit spreads are at historically narrow levels, with the market pricing almost no default risk. If economic data deteriorates or Fed policy expectations shift, a sudden widening of credit spreads could be the catalyst for a chain reaction.
⚠️ Contradiction 3: Options Market “Naked” State
- P/C Ratio: 81.6 (Extreme Greed)
- VIX: 50 (Neutral)
VIX is not at extreme lows, but the P/C ratio is already at extreme greed. This means the market has some volatility expectation, but options traders are largely abandoning downside protection. If an unexpected shock hits, the unwinding of unhedged positions will amplify losses.
Trend Assessment
Duration in Zone: The composite bottomed at 34.7 (Fear) on Jul 29 and entered Greed territory in just 6 trading days. It has spent 4 days in the Greed zone with no clear reversal signal yet.
Turning Indicators to Watch:
- Breadth improving (+20.8/day): If sustained, may ease Contradiction 1
- P/C ratio still declining: No bottoming signal yet
- Junk bond spread still tightening: Greed trend not terminated
- VIX declining but not extreme: Room to go lower
Conclusion: Short-term sentiment is still in the greedening process with no clear reversal signal. However, three structural contradictions (narrow rally, zero-risk credit pricing, options nakedness) have significantly elevated market fragility. If S&P momentum breaks above 80+ and breadth remains weak, the market enters the “extreme greed + structural fragility” danger zone.
🚨 Crisis Precursor Dashboard
1. Credit Spreads
- High Yield OAS: 2.71% | 🟢 Normal
- Investment Grade OAS: 0.78% | 🟢 Normal
- Trend: Stable day-over-day, HY OAS hovering near 2.7%, IG OAS below 1% threshold
- Data Date: 2026-08-06 (FRED)
Credit spreads remain in normal territory, but note that CNN’s junk bond demand indicator has reached 97.4 (extreme greed), meaning spreads are not at warning levels but the tightening trend is extreme. Credit markets are a “boiling frog” risk — spreads within normal range but compressing to extremes, and once they turn, the move tends to be violent.
2. Yield Curve
- 10Y-2Y Spread: +46bp | 🟢 Normal (slightly flat)
- 10Y: 4.69% | 2Y: 4.25% | 30Y: 5.22%
- 10Y-30Y Spread: -53bp | 🟡 Mildly Inverted
- Trend: 10Y-2Y normal but 10Y-30Y inverted by 53bp, long-end curve anomaly
The 10Y-2Y is normal but the 30Y-10Y inversion is noteworthy — reflecting elevated long-term rate expectations, likely pricing fiscal deficit and inflation stickiness. This is a “term premium” inversion, different from a pure recession signal, but still暗示s long-end risk.
3. Margin Debt (FINRA)
- Latest Data: $1.502 Trillion (June 2026) | 🔴 All-Time High
- Monthly Change: +$86.5B (+6.1%), up sharply from May’s $1.416T
- YoY Change: +$494B (+49%), nearly doubled from $1.008T in Jun 2025
- GDP Ratio: ~4.1% (historical median 1.5%)
- Trend: 10th consecutive monthly increase, accelerating
Margin debt is growing at nearly $100B per month, up 49% YoY. The GDP ratio of 4.1% is 2.7x the historical median. This cannot be fully explained by “market gains naturally increasing margin” — the acceleration of leverage is abnormal. In a 5-10% market pullback, margin call cascades will act as an amplifier.
4. IPO & Fund Flows
- 2026 YTD IPO Count: ~73 (Renaissance Capital)
- 2026 YTD ETF Net Inflows: ~$1.3 Trillion (through end-July)
- H1 2026 ETF Inflows: $1T (record H1, +86% YoY)
- Full-Year Forecast: $2.3T (State Street, would surpass 2025’s $1.5T record)
- Trend: 🔴 Record inflow pace
ETF inflows are growing at a historic pace — $1T in H1, with another ~$190B in July. Low-cost ETFs captured 49% of inflows. Equity ETFs ($680B H1) and fixed income ETFs ($292B H1) are dual engines. The inflow itself is a bullish signal, but when inflow velocity far exceeds fundamental improvement, there’s a “passive flows push valuations higher → valuations attract more flows” positive feedback risk.
Summary Assessment
| Indicator | Status | Signal |
|---|---|---|
| Credit Spreads (HY/IG OAS) | 🟢 Normal | No stress yet |
| Yield Curve (10Y-2Y) | 🟢 Normal/Flat | 30Y inversion worth watching |
| Margin Debt | 🔴 All-Time High | Extreme leverage risk |
| IPO/Fund Flows | 🔴 Record | Positive feedback risk |
Overall: 2 🟢 / 0 🟡 / 2 🔴
Credit spreads and yield curve — two traditional indicators — remain in normal territory, but margin debt and fund flows — two behavioral indicators — are flashing red. This aligns with FNG’s structural contradictions: the credit market (traditional indicator) hasn’t reflected risk yet, but leverage and flow (behavioral indicators) are already at extreme levels.
Core Risk Pathway: If a catalyst (economic miss, geopolitical event, hawkish Fed pivot) triggers a 5%+ pullback → margin call cascades → passive ETF redemption wave → already-fragile breadth accelerates decline → VIX spike forces P/C ratio rapid correction → credit spreads widen last but confirm the move.
This is not an “imminent crash” signal, but market fragility is significantly elevated above normal. Monitor closely: ① S&P momentum breaking 80 into extreme greed; ② Breadth failing to improve; ③ HY OAS beginning to widen.