CNN Fear & Greed Sentiment Analysis 2026-08-09
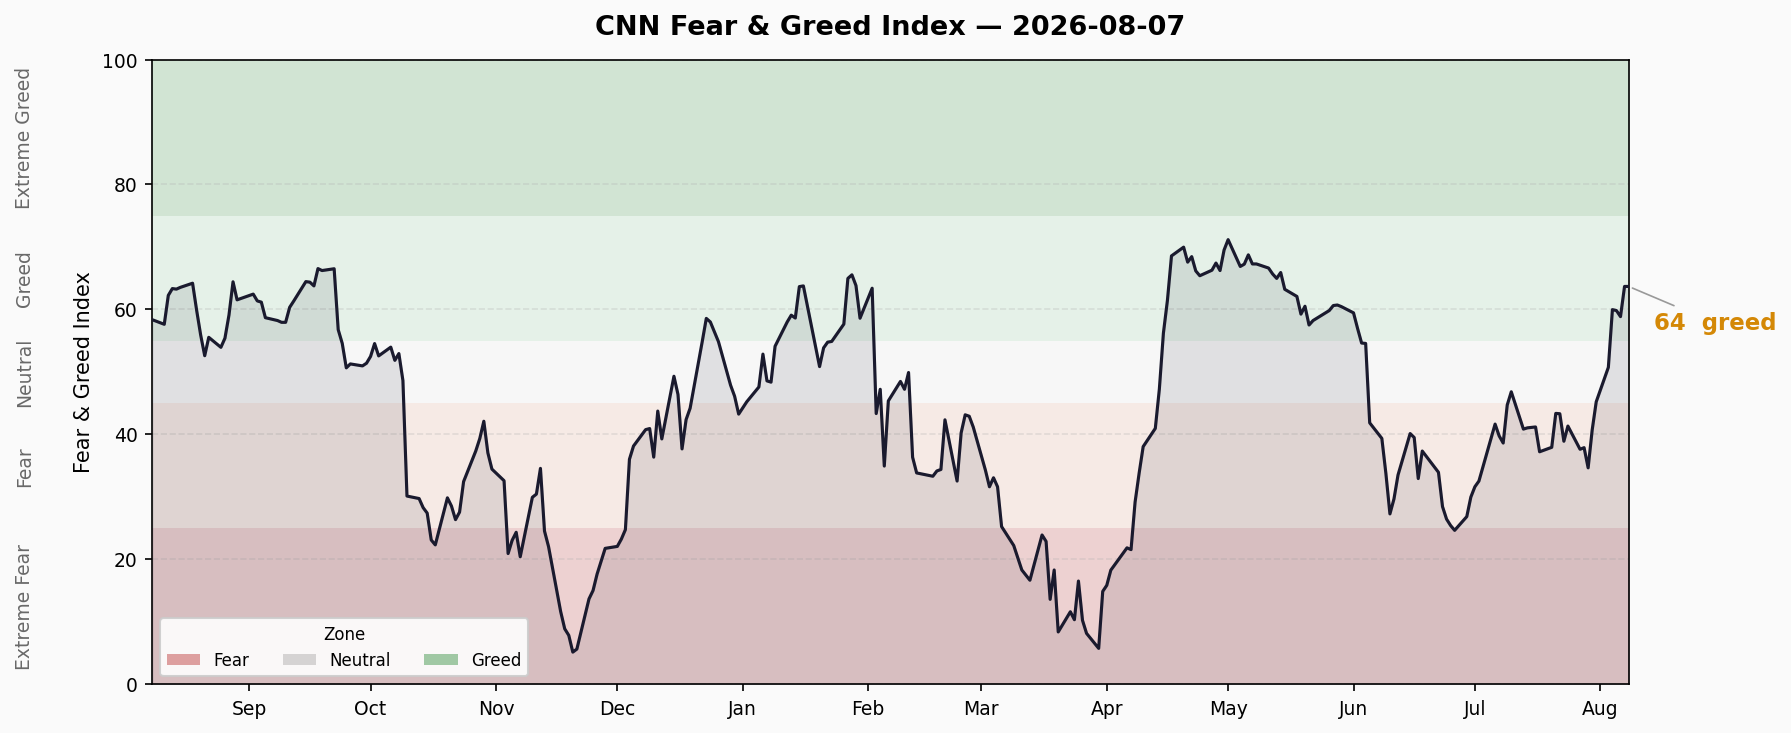
Composite index at 63.7 (Greed), up +4.8 points from prior day. 10-day surge from 37.6 (Fear) to 63.7 (Greed), a +26.1 point swing. Structural divergence is significant: momentum/options/junk bonds at extreme greed (80-97) while price strength/breadth at fear (32-40). Margin debt hit $1.502T record in June, ETF flows topped $1T in H1 2026.
Composite Index
| Metric | Value |
|---|---|
| Current Score | 63.7 — Greed |
| Previous Day (8/6) | 58.9 — Greed |
| Daily Change | +4.8 ⬆️ |
| One Week Ago (7/31) | 45.2 — Neutral |
| 10 Days Ago (7/27) | 37.6 — Fear |
10-Day Trend: V-shaped rebound. Bottomed at 37.6 (Fear) on 7/27, returned to Neutral 45.2 on 7/31, surged into Greed 60.0 on 8/4, and has held the 58-64 range since. The +26.1 point gain over 10 days is extremely rapid.
Duration in Zone: Greed zone for 5 trading days (8/4-8/7). Previously spent ~3 weeks in Fear (7/7-7/31).
Seven Sub-Indicators Scan
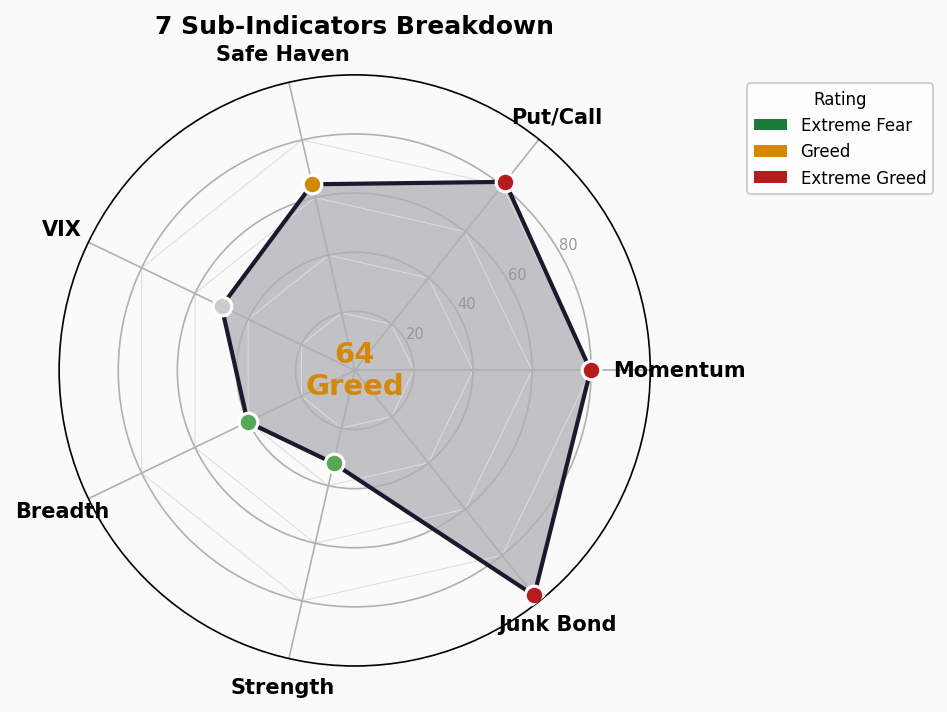
| # | Indicator | Score | Rating | Raw Value | Direction |
|---|---|---|---|---|---|
| 1 | Market Momentum (S&P 500) | 79.8 | 🔴 Extreme Greed | 7757.64 (well above 125-day MA) | ⬆️ |
| 2 | Stock Price Strength | 32.2 | 🟡 Fear | 1.14% (few at 52-week highs) | ⬇️ |
| 3 | Stock Price Breadth | 40.2 | 🟡 Fear | 959.07 (McClellan Oscillator) | → |
| 4 | Junk Bond Demand | 97.4 | 🔴 Extreme Greed | 1.23% (HY spread extremely tight) | ⬆️ |
| 5 | Market Volatility (VIX) | 50.0 | ⚪ Neutral | 14.90 | → |
| 6 | Safe Haven Demand | 64.6 | 🟢 Greed | 2.94 (stocks outperforming bonds) | ⬆️ |
| 7 | Put/Call Options | 81.6 | 🔴 Extreme Greed | 0.679 (call options dominant) | ⬆️ |
Sub-Indicator Interpretation
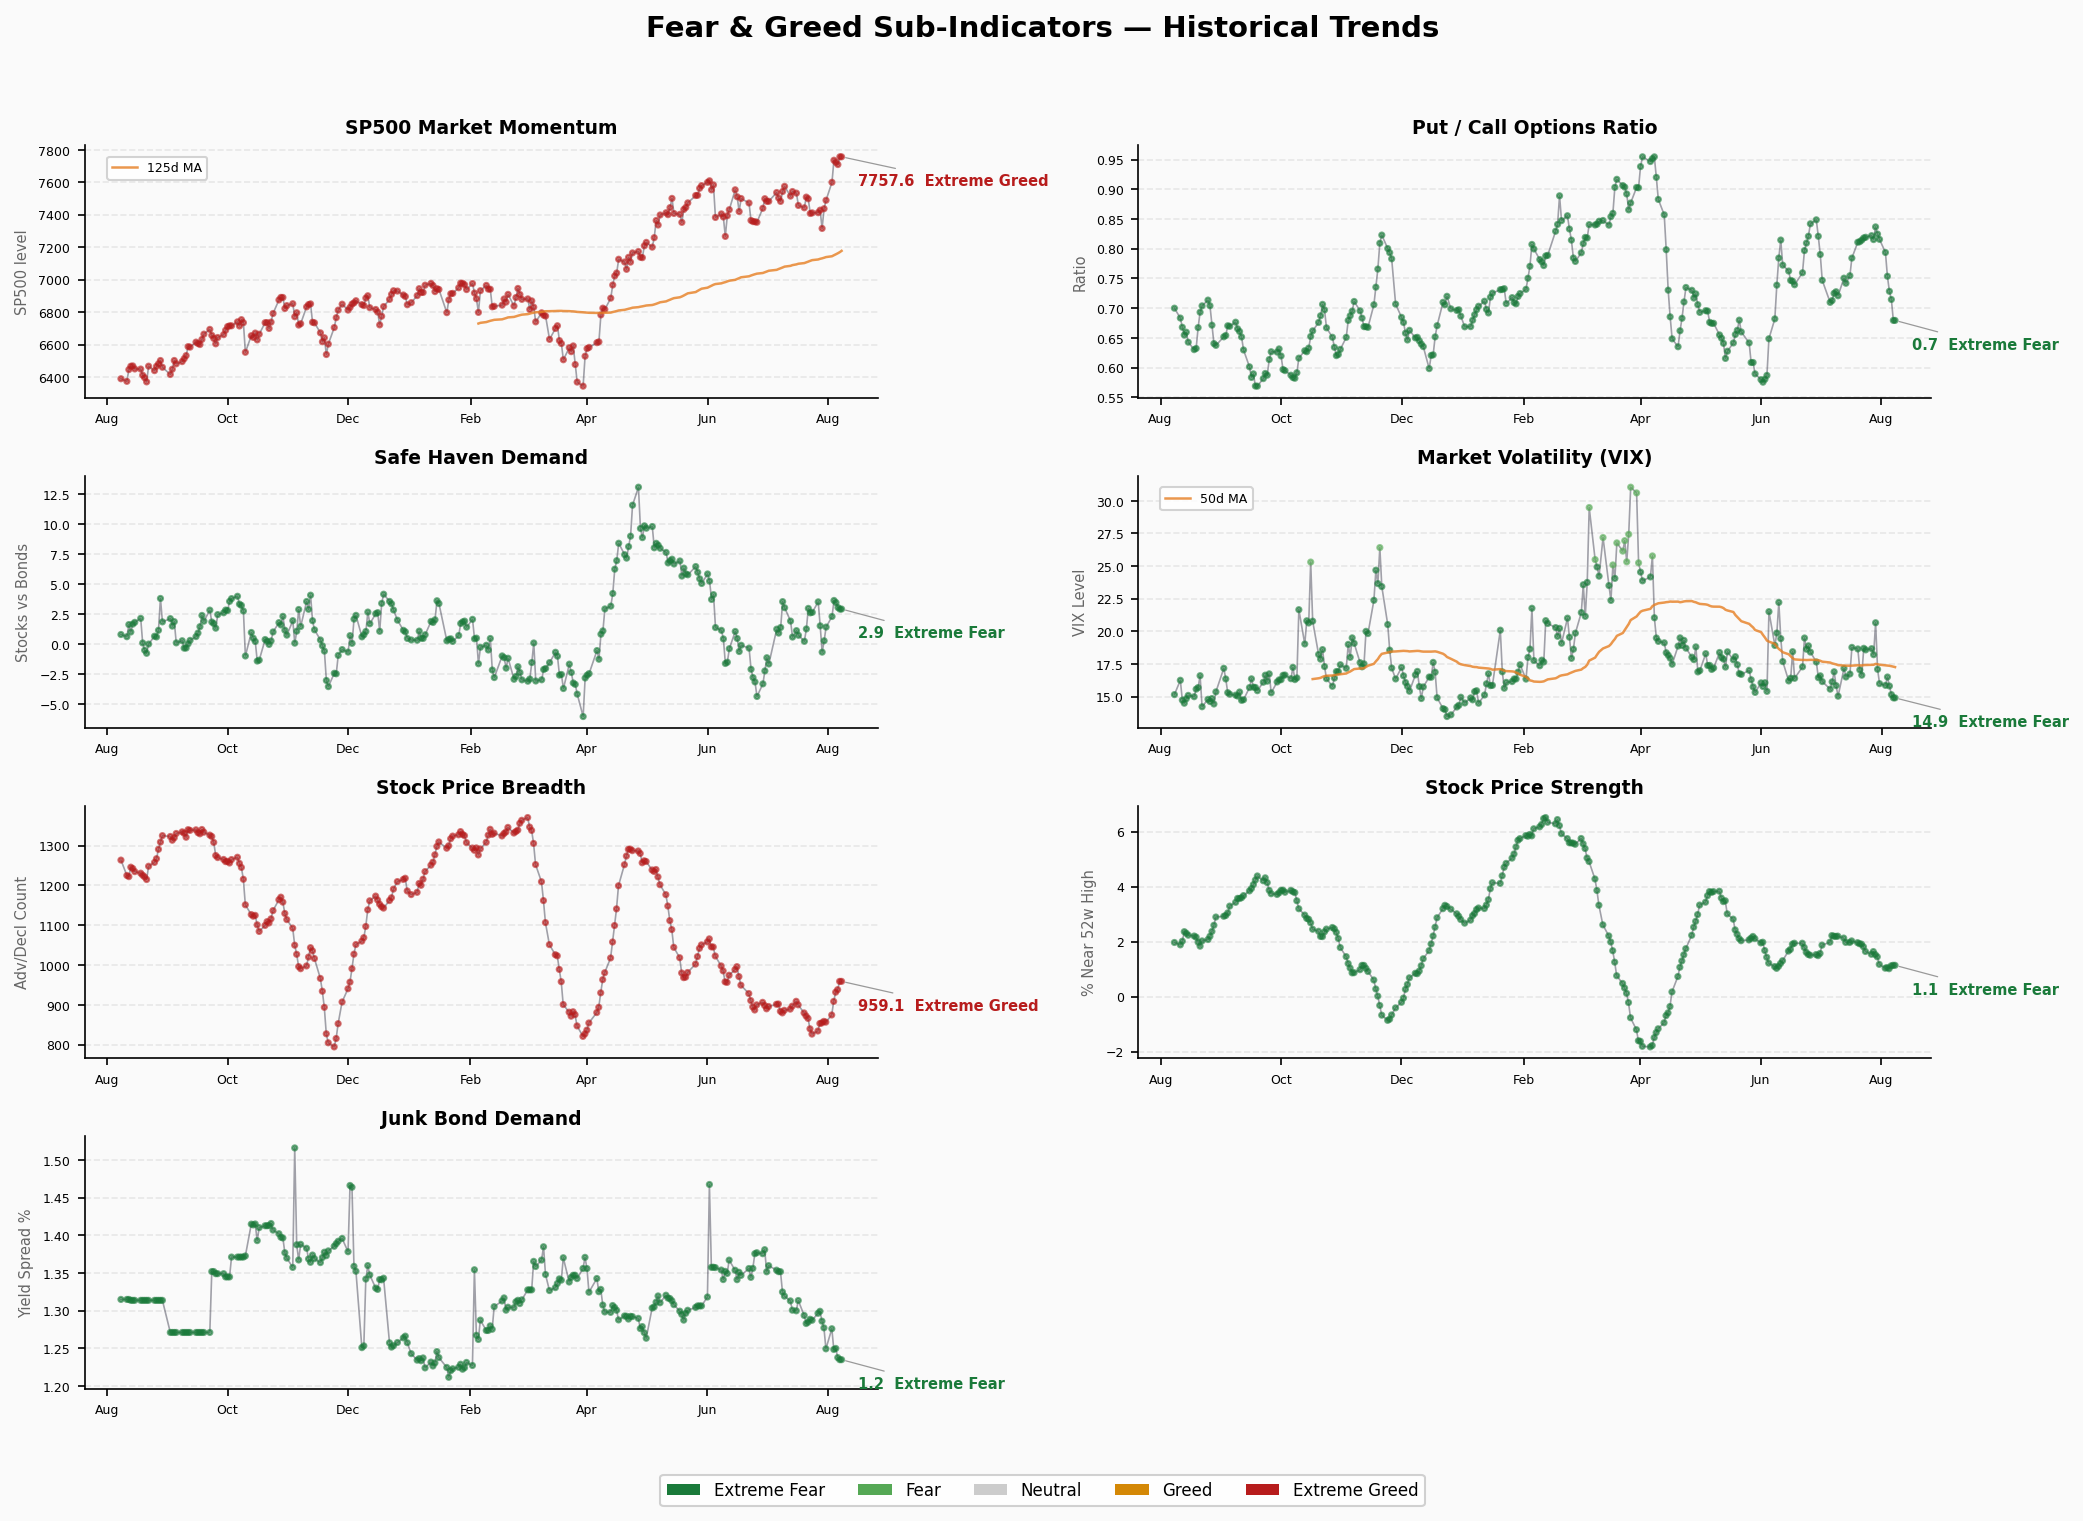
1. Market Momentum — 79.8 Extreme Greed S&P 500 is far above its 125-day moving average. Score has climbed from the 60 range in late June to the 80 edge, entering overbought territory. Index-level strength masks growing stock-level divergence.
2. Stock Price Strength — 32.2 Fear Only 1.14% of stocks are at 52-week highs, abnormally low. The index rises but few individual stocks make new highs — a classic “mega-cap carry” pattern.
3. Stock Price Breadth — 40.2 Fear McClellan Oscillator at 959, positive but flattening. Market breadth is not expanding with the index, raising questions about rally quality.
4. Junk Bond Demand — 97.4 Extreme Greed HY bond spread at just 1.23%, extremely compressed. Investors demand almost no credit risk premium. This level historically coincides with peak risk appetite.
5. Market Volatility (VIX) — 50.0 Neutral VIX at 14.90, historically low. The market prices no volatility risk premium. Low VIX + weak breadth = complacency.
6. Safe Haven Demand — 64.6 Greed Stocks outperforming bonds by 2.94 points over 20 days. Capital prefers risk assets over safe havens, consistent with junk bond demand.
7. Put/Call Options — 81.6 Extreme Greed P/C ratio at 0.679, call-heavy. Options market is betting on continued upside with insufficient downside hedging. A turn would accelerate without put protection.
Structural Divergence Analysis
⚠️ Core Divergence: Extreme Momentum vs Weak Breadth
| Camp | Indicators | Score Range |
|---|---|---|
| Extreme Greed Camp | Momentum(79.8), Junk Bonds(97.4), Put/Call(81.6) | 80-97 |
| Fear Camp | Price Strength(32.2), Price Breadth(40.2) | 32-40 |
| Middle Ground | VIX(50), Safe Haven(64.6) | 50-65 |
Three extreme greed (≥80) vs two fear (≤40), a 65-point spread.
This is a textbook late-cycle bull market divergence:
- Liquidity/sentiment extremely optimistic: tight spreads, call-heavy options, momentum chasing
- Fundamentals/breadth clearly lagging: few new highs, narrow advance
Historical pattern: When momentum indicators ≥80 and breadth ≤40, the rally is typically driven by a handful of mega-cap stocks (concentration risk). Market fragility increases. Any catalyst (rate shock, geopolitical event, earnings miss) could trigger a concentration reversal.
Extreme Values
- >80 (Extreme Greed): 3 indicators — Junk Bond Demand(97.4), Put/Call(81.6), Market Momentum(79.8 approx)
- <20 (Extreme Fear): 0 indicators
- Highest: Junk Bond Demand 97.4 — peak risk appetite across the market
- Lowest: Stock Price Strength 32.2 — severe stock-level divergence
Trend Assessment
Zone Duration: Greed zone for only 5 days, still early. Previously, Fear zone lasted ~3 weeks (7/7-7/31), and before that, Greed zone lasted ~4 weeks (6/16-7/3).
Turning Indicators:
- 8/4 single-day jump of +9.2 points (50.7→60.0) — a sentiment regime shift
- Breadth indicators (Strength/Breadth) are not following the rebound, forming a bearish divergence
- If breadth continues to deteriorate while momentum holds high, divergence widens → risk increases
- VIX hovering near 15, no panic signal, but limited downside room
Scenario Analysis:
- 🟢 Continued upside: If breadth indicators recover (capital broadens from concentrated stocks), divergence converges, rally is sustainable
- 🟡 Sideways/consolidation: Current pattern persists — momentum supports index, breadth lags, until a catalyst arrives
- 🔴 Correction risk: If breadth worsens further + any rate/geopolitical shock → concentration reversal, downside could be sharp
🚨 Market Crash Precursor Dashboard
1. Credit Spreads
- HY OAS: 2.71% | 🟢 Normal
- IG OAS: 0.78% | 🟢 Normal
- Trend: HY OAS stable in the 2.7-2.8% range, no widening. Credit market is not pricing recession risk
- Thresholds: HY <3% normal | 3-5% caution | 5-8% panic | >8% crisis
2. Yield Curve
- 10Y-2Y Spread: +46bp | 🟢 Normal (un-inverted)
- 10Y-30Y Spread: -53bp | 🟡 Inverted long end (unusual)
- 10Y: 4.69% | 2Y: 4.25% | 30Y: 5.22%
- Trend: Short-end curve normalized, but 10Y-30Y inversion signals the market pricing weak long-term growth + unstable inflation expectations. Monitor closely
3. Margin Debt
- FINRA Margin Debt: $1.502T (June 2026) | 🔴 Record High
- Monthly Change: May $1.416T → June $1.502T, +$86B (+6.1%) in one month
- Trend: 4 consecutive months of increase (Mar $1.221T → Jun $1.502T), +23% in 4 months. At ~4.1% of GDP, exceeding peaks before the 2000 dot-com crash and 2007 GFC
- Risk: Leverage concentrated in AI/tech stocks. Any sector pullback could trigger margin calls and forced deleveraging
4. IPO Activity
- 2026 YTD: ~73 IPOs (Renaissance Capital) | 🟡 Below average
- Trend: IPO count has not surged with the market rally, well below 2021 peak. Primary market remains disciplined, no bubble signal here
5. Fund Flows
- ETF H1 2026 Inflows: $1 trillion (record) | 🔴 Record inflows
- Full-year projection: $2.3 trillion (State Street), far exceeding 2025’s $1.5T record
- Rolling 12-month flows: $2 trillion (all-time high)
- Latest week (ending 7/29): ETF net issuance $46.5B
- Trend: Passive capital flooding in, low-cost ETFs capturing 49% of inflows. Liquidity is abundant, but also a “everyone is in the pool” signal
Summary Assessment
| Signal | Status |
|---|---|
| Credit Spreads | 🟢 Normal |
| Yield Curve (short end) | 🟢 Normal |
| Yield Curve (long end) | 🟡 Inverted |
| Margin Debt | 🔴 Record High |
| IPO Activity | 🟡 Below average |
| Fund Flows | 🔴 Record inflows |
Total: 2 🟢 / 2 🟡 / 2 🔴
Conclusion: Credit spreads and the short-end curve remain normal — no systemic risk is being priced. However, margin debt at $1.502T and record ETF inflows mean leverage and passive capital are at extreme levels. Combined with the FNG structural divergence (extreme greed in momentum vs fear in breadth), market fragility is notably elevated.
This is not a “crash tomorrow” signal. It is a “if triggered, the downside could be severe” precondition. Watch for: HY OAS widening, VIX breaking above 20, and further deterioration in breadth indicators.