CNN Fear & Greed Sentiment Analysis 2026-08-08
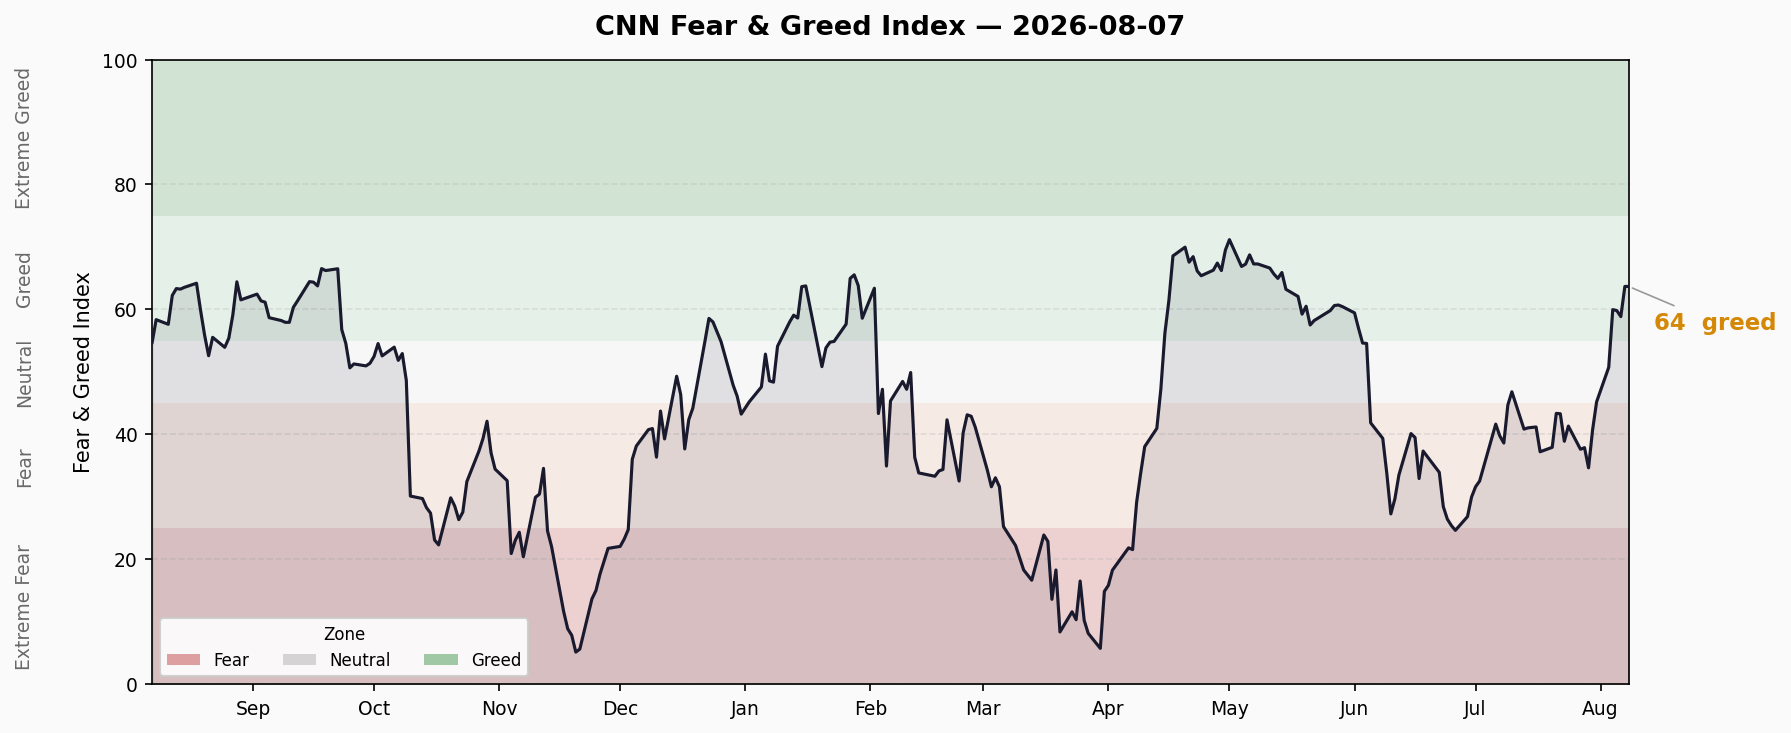
Composite index at 63.7 (Greed), flat from prior day. Surged from 37.6 (Extreme Fear) over 10 trading days. Junk bond demand 97.4 extreme greed vs stock price strength 32.2 fear — sharp structural divergence. FINRA margin debt at $1.502T all-time high, ETF inflows H1 2026 hit $1T record.
Composite Index
- Latest Score: 63.7 — Greed
- Previous Day: 63.7 — Flat (0.0 change)
- 10-Day Trend: 37.6 → 50.7 → 63.7 (Extreme Fear → Greed, +26.1 points)
- Direction: ↗ Sharply rising, plateauing in last 2 days
A 26-point swing from Extreme Fear to Greed in 10 trading days is remarkable in recent history. However, the last two readings are identical (63.69), suggesting upward momentum is stalling near the Greed zone ceiling.
Seven Sub-Indicators Scan
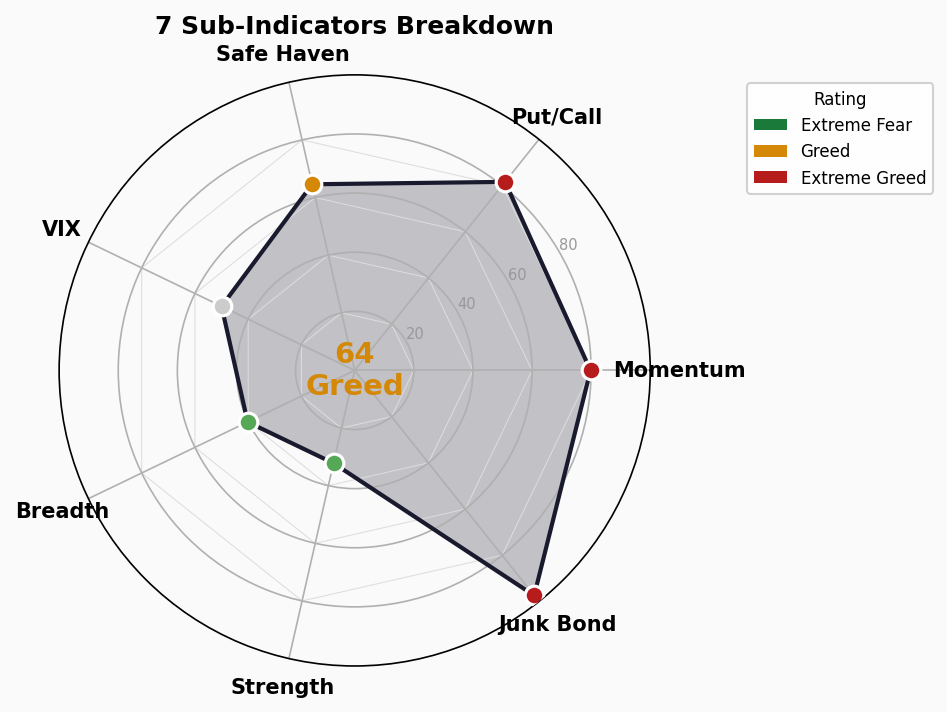
| Indicator | Score | Rating | Raw Value | 10D Change | Direction |
|---|---|---|---|---|---|
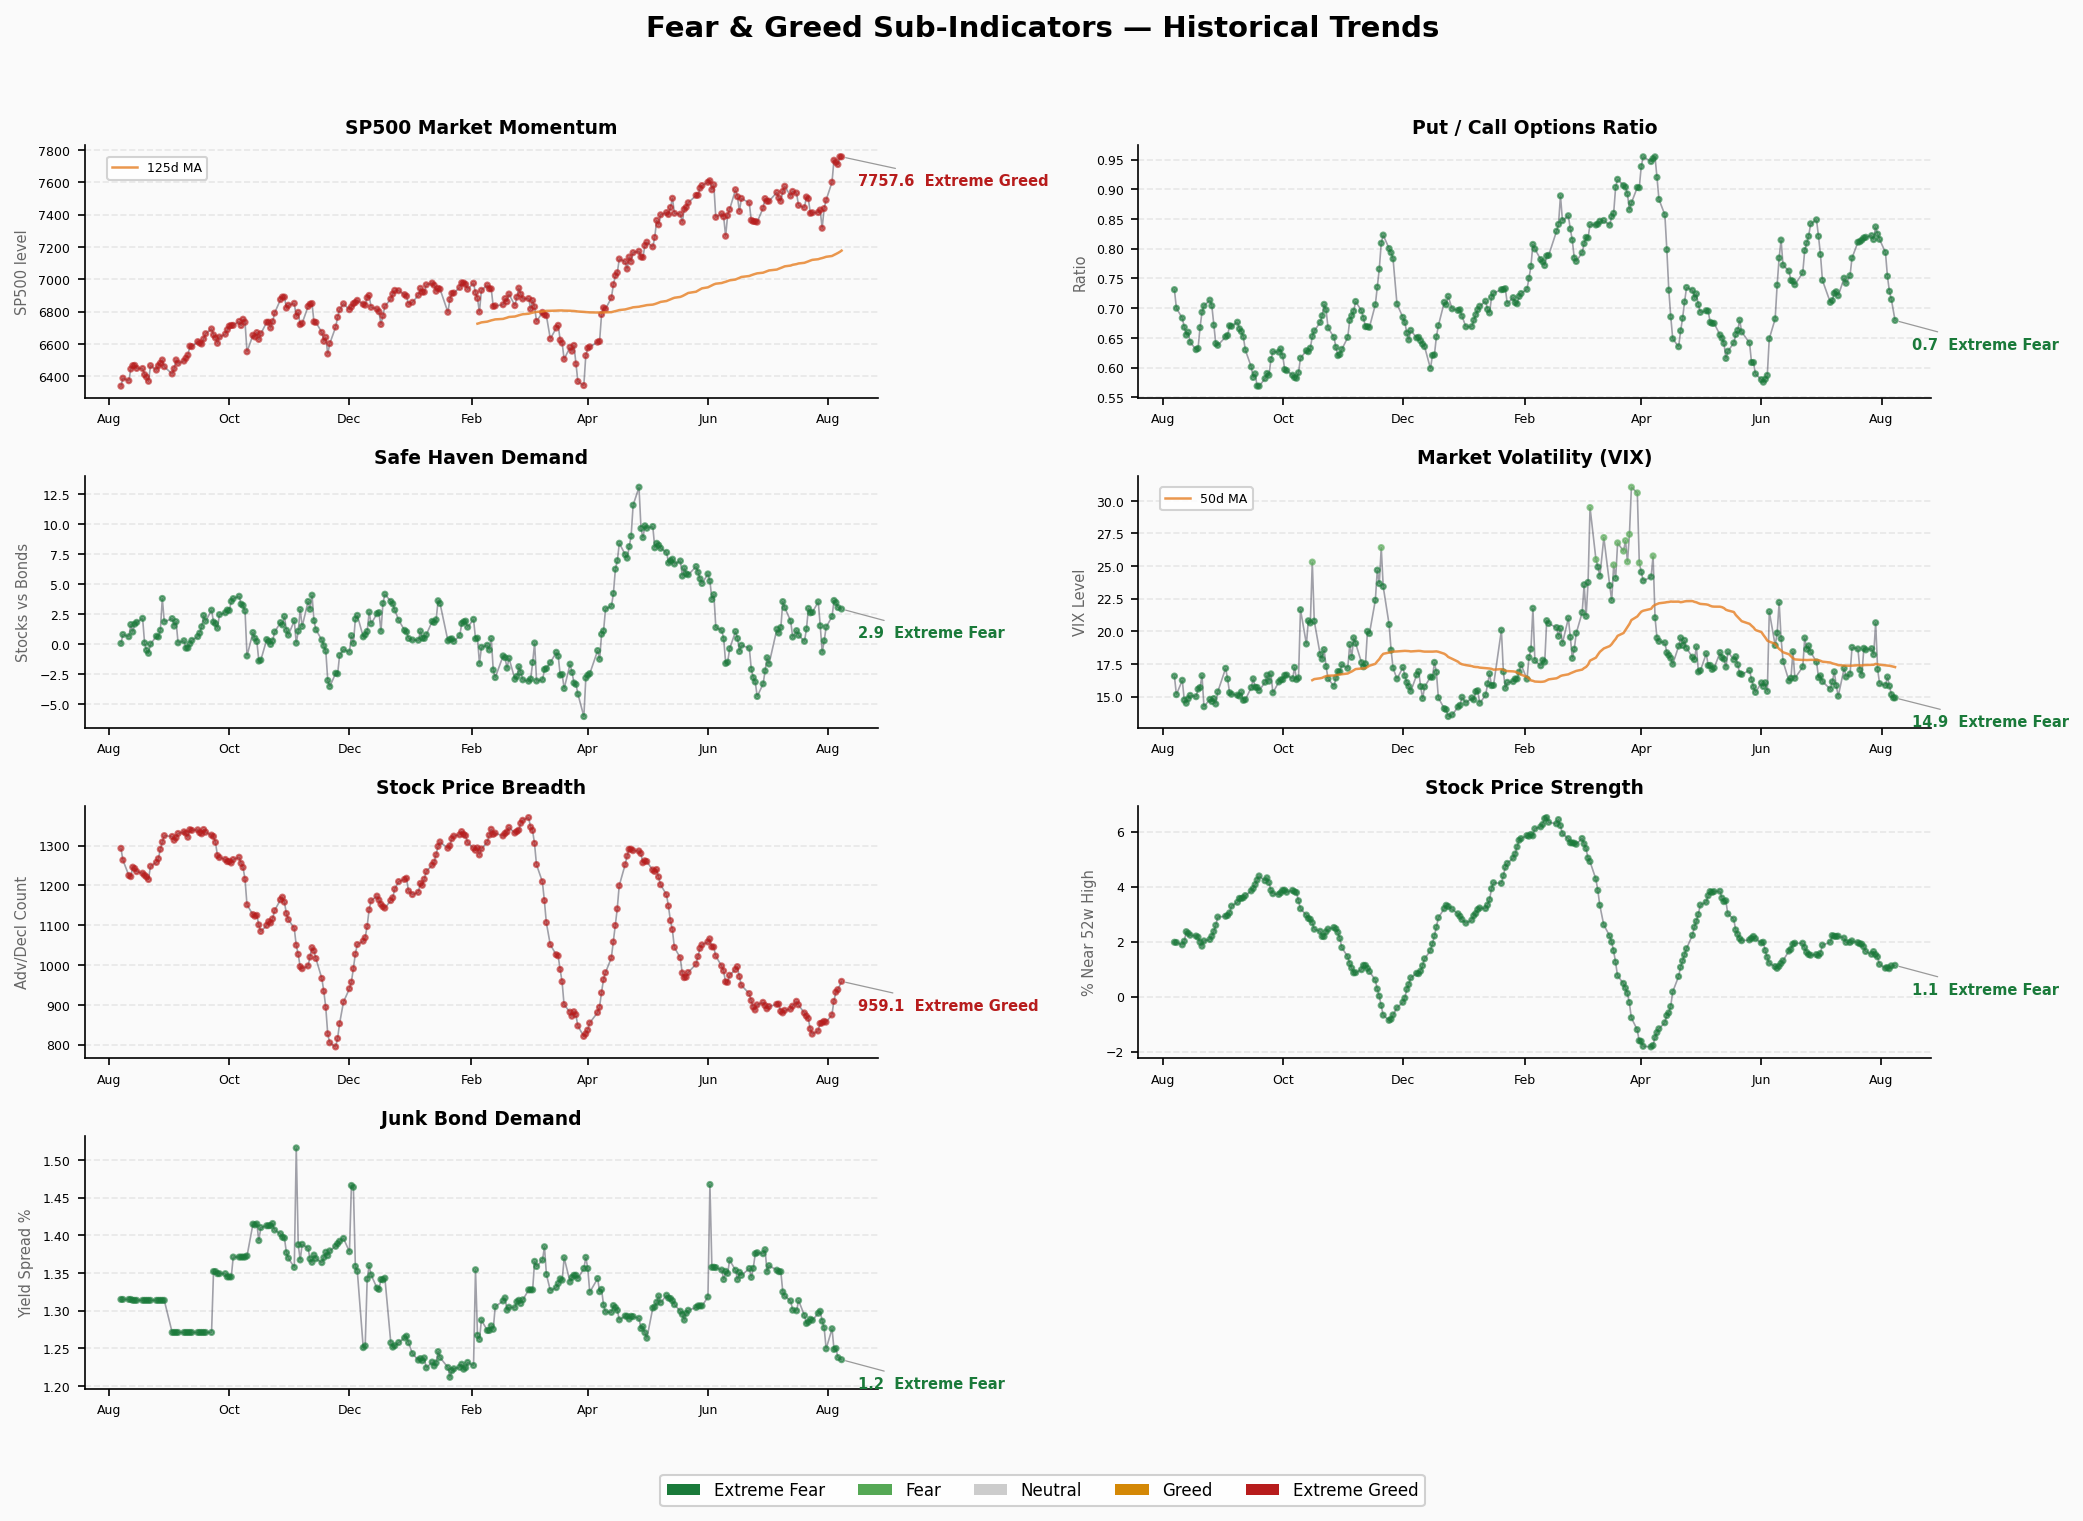
| Market Momentum (S&P 500) | 79.8 | Extreme Greed | 7757.64 | +344.5 | ↑ |
| Stock Price Strength | 32.2 | Fear | 1.14 | -0.51 | ↓ |
| Stock Price Breadth | 40.2 | Fear | 959.07 | +132.5 | ↑ |
| Put/Call Options | 81.6 | Extreme Greed | 0.68 | -0.14 | ↓ |
| Market Volatility (VIX) | 50.0 | Neutral | 14.90 | -3.77 | ↓ |
| Junk Bond Demand | 97.4 | Extreme Greed | 1.23% | -6bp | ↓ |
| Safe Haven Demand | 64.6 | Greed | 2.94 | +0.27 | ↑ |
Distribution: 3 Extreme Greed / 1 Greed / 1 Neutral / 2 Fear / 0 Extreme Fear
Sub-Indicator Breakdown
Market Momentum (79.8 Extreme Greed) — S&P 500 at 7757.64, up from 7413.18 ten days ago (+4.6%). Momentum is strong, but this is a price-tracking metric, not forward-looking. Reaching this level warrants caution rather than enthusiasm.
Stock Price Strength (32.2 Fear) — Declined from 1.65 to 1.14 over 10 days. While the index rises, individual stock new-high/new-low relative strength is deteriorating. Classic “narrow rally” pattern where a few mega-cap names carry the index.
Stock Price Breadth (40.2 Fear) — Improved from 826.59 to 959.07, but still in Fear territory. More stocks are participating in the rally, but breadth has not yet confirmed the index strength.
Put/Call Options (81.6 Extreme Greed) — P/C ratio dropped from 0.82 to 0.68. Traders are barely buying put protection. This level of complacency typically appears near market tops.
Market Volatility VIX (50.0 Neutral) — VIX fell from 18.67 to 14.90, sitting in the lower-middle range historically. Low volatility alone isn’t dangerous, but combined with extreme P/C greed and ultra-tight junk bond spreads, it signals zero pricing of tail risk.
Junk Bond Demand (97.4 Extreme Greed) — HY spread narrowed from 1.29% to 1.23%, near the tightest in the dataset. The credit market is pricing near-zero default risk. This is the most extreme indicator in today’s report.
Safe Haven Demand (64.6 Greed) — Stock-to-Treasury relative yield rose from 2.67 to 2.94. Capital continues to prefer risk assets over safe havens.
Structural Contradictions
Contradiction 1: Junk Bond Demand 97.4 vs Stock Price Strength 32.2 (Extreme Divergence)
The most acute structural conflict in today’s report. Credit markets price in near-zero default risk (HY OAS at just 2.71%), while equity internals show weak stock strength in Fear territory. Credit and equities are two sides of the same economic coin — when credit is ultra-optimistic but stock internals deteriorate, it typically means a few large-cap stocks are masking broad weakness. Historically, this divergence appeared at 2007 mid-cycle and late 2021.
Contradiction 2: Put/Call 81.6 vs Stock Price Strength 32.2
Options traders are completely unhedged (P/C at 0.68, virtually no one buying protection) while individual stock strength is deteriorating. If the index reverses, un-hedged positions will accelerate liquidation. Combined with record-high margin debt, the leverage + zero-hedge combination is dangerous.
Contradiction 3: Market Momentum 79.8 vs Stock Price Breadth 40.2
S&P 500 momentum is in Extreme Greed, but market breadth remains in Fear. This is the classic “narrow rally” signal — the index is rising, but too few stocks are participating. If breadth doesn’t improve, index momentum will eventually be dragged down.
Trend Assessment
Zone Duration: The composite broke into the Greed zone (50-75) two trading days ago. Prior to that, it spent ~5 trading days in Fear (25-50) and ~5 trading days in Extreme Fear (0-25).
Reversal Signals:
- Last two readings are perfectly flat (63.69 → 63.69), upward momentum paused
- Junk bond demand at 97.4, near ceiling, limited upside
- VIX neutral (50.0) — the only “balanced” indicator
- If stock strength and breadth continue to deteriorate, they could pull the composite back down
Key Question: Can the index break through the 65-70 platform into Extreme Greed (>75)? This depends on whether breadth improves. If breadth remains weak, the more likely scenario is a peak in the Greed zone followed by a pullback.
🚨 Crisis Precursor Dashboard
1. Credit Spreads
- HY OAS: 2.71% | 🟢 Normal
- IG OAS: 0.78% | 🟢 Normal
- Trend: HY OAS stable around 2.7%, roughly flat from prior day. Credit spreads show no stress signals. However, note that the FNG junk bond demand sub-indicator is at 97.4 (Extreme Greed) — spreads are near cycle tights. “No fear” in credit itself warrants caution.
- Thresholds: <3% Normal | 3-5% Warning | 5-8% Panic | >8% Crisis
2. Yield Curve
- 10Y-2Y Spread: +46bp | 🟢 Normal (not inverted)
- 10Y: 4.69% | 2Y: 4.25% | 30Y: 5.22%
- 10Y-30Y Spread: -53bp | 🟡 Anomalous (30Y below 10Y)
- Trend: Yield curve has normalized with 10Y-2Y back in positive territory. However, 10Y-30Y remains inverted at -53bp, suggesting lingering doubts about long-term growth. Not a classic recession signal, but worth monitoring.
- Thresholds: >0 Normal | 0 to -50bp Flat | <-50bp Inverted
3. Margin Debt
- FINRA Margin Debt: $1.502T (June 2026) | 🔴 All-Time High
- Prior Month: $1.416T (May) → $1.502T (June), +$86B (+6.1%)
- Year-over-Year: +53.7% (from $920.96B one year ago)
- GDP Ratio: ~4.1%, well above the 50-year median of 1.5%
- Historical Context: Current level exceeds March 2000 (dot-com peak), July 2007 (pre-GFC), and August 2021 (pre-2022 bear market). Every prior margin debt peak preceded a significant equity drawdown. June 2026 is the latest available FINRA data.
- Threshold: >$1.2T 🔴 Historical high zone
4. IPO & Fund Flows
- ETF Inflows: H1 2026 net inflows $1 trillion | 🔴 Record
- Full-Year Projection: State Street projects $2.3T (vs 2025 record $1.5T, +53%)
- 12-Month Rolling Flows: Already at $2T, an all-time high
- Breakdown: Equity ETFs $680B (68%), Bond ETFs $300B, Tech sector $44B
- IPO: 2026 YTD ~73 (Renaissance Capital)
- Interpretation: Capital inflow velocity is unprecedented. Massive passive buying at elevated levels provides strong support, but also means that if sentiment turns, the outflow wave could be equally fierce.
- Threshold: ETF annual inflows >$1.5T 🔴 Record
Overall Assessment
| Indicator | Status |
|---|---|
| Credit Spreads | 🟢 |
| Yield Curve | 🟢 |
| Margin Debt | 🔴 |
| IPO/Fund Flows | 🔴 |
2 🟢 / 0 🟡 / 2 🔴
Credit spreads and yield curve — the “hard indicators” — remain normal, with no liquidity stress or recession pricing. However, margin debt and fund flows — the “behavioral indicators” — are both flashing red. Leverage levels and capital inflow velocity have surpassed every prior major drawdown in history.
Core Contradiction: Normal credit + extreme leverage = ample liquidity but excessive leverage. Normal credit spreads mean “no current stress,” but record-high margin debt means “once stress arrives, de-leveraging will be swift.” The FNG composite at 63.7 (Greed) with a 2-red, 2-green crisis dashboard is consistent with a late-cycle signal — not a crisis warning, but one that demands vigilance.