CNN Fear & Greed Sentiment Analysis 2026-08-07
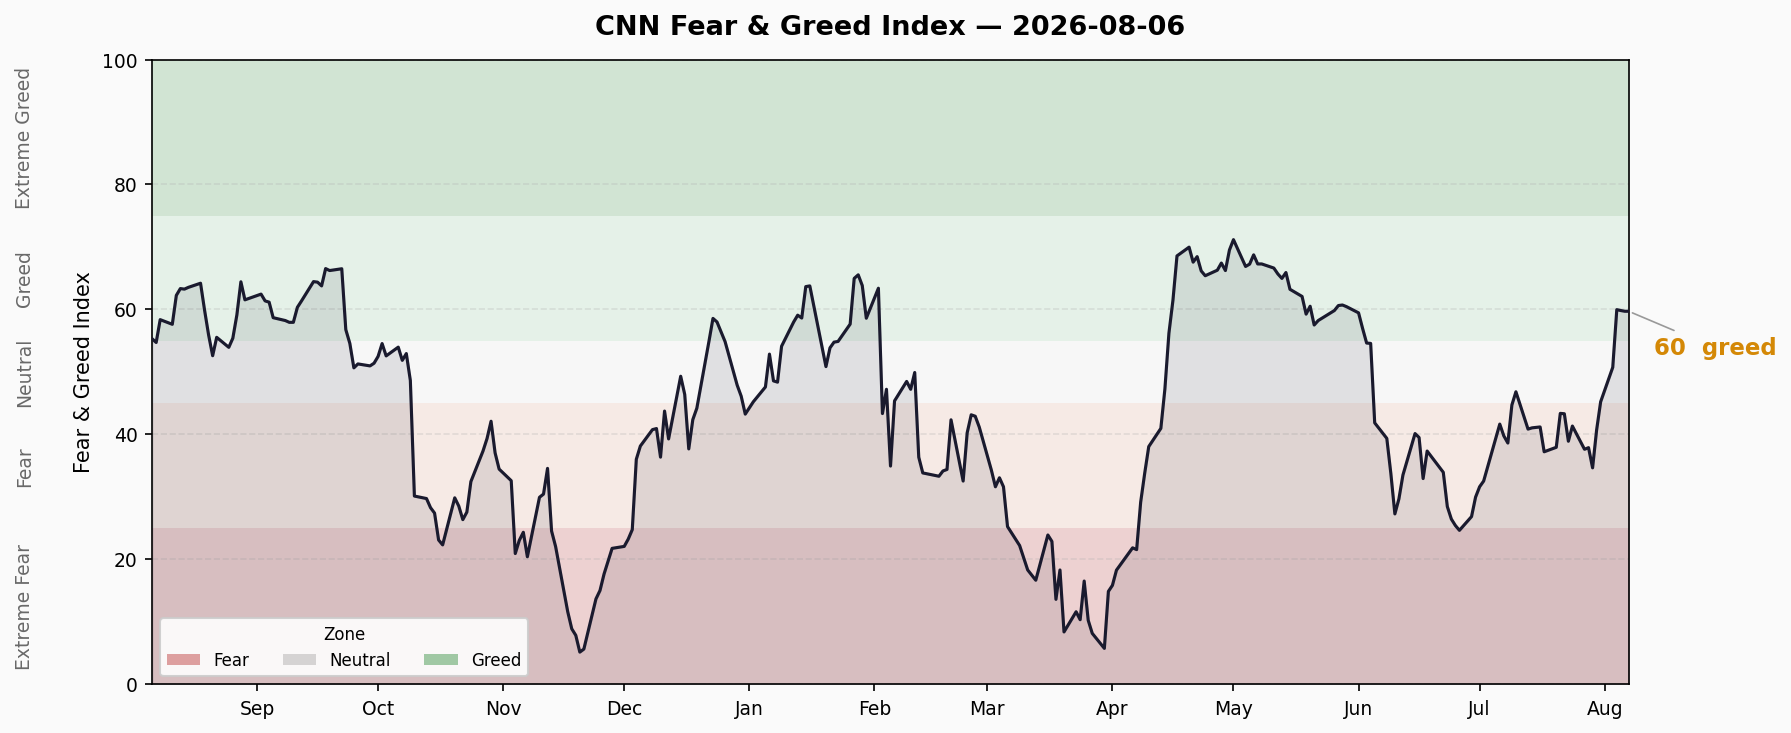
Composite at 59.7 (Greed), rebounding ~19 points from 40.7 one week ago. Extreme divergence: Junk Bond Demand at 97 (Extreme Greed) vs Stock Price Strength at 31.6 (Fear). Credit spreads normal, but FINRA margin debt hits record $1.416T (+53.7% YoY) and ETF inflows on pace for $2.3T full-year. Sentiment recovered fast but structural risks are accumulating.
Composite Index Overview
| Metric | Value |
|---|---|
| Latest Score | 59.7 — Greed |
| Previous Close | 59.7 |
| Daily Change | +0.06 (essentially flat) |
| 1 Week Ago | 40.7 (Fear) → +19.0 points |
| 1 Month Ago | 41.7 (Fear) → +18.0 points |
| 1 Year Ago | 55.3 (Greed) → +4.4 points |
Bottom line: The composite surged from fear (34.7) to greed (59.7) in just 10 days — an extremely rapid V-shaped recovery. Now stabilizing around 60 for three consecutive days. The fear-to-greed transition is complete; momentum has cooled but no reversal signal yet.
Last 10 Days Trend
| Date | Score | Rating |
|---|---|---|
| 7/27 | 37.6 | Fear |
| 7/28 | 37.9 | Fear |
| 7/29 | 34.7 | Fear |
| 7/30 | 40.7 | Fear |
| 7/31 | 45.2 | Neutral |
| 8/3 | 50.7 | Neutral |
| 8/4 | 60.0 | Greed |
| 8/5 | 59.8 | Greed |
| 8/6 | 59.7 | Greed |
| 8/7 | 59.7 | Greed |
Trend: V-shaped rebound. Bottomed at 34.7 on 7/29, broke into greed territory on 8/4, then consolidated at 59-60 for three days. Rebound momentum has faded but no sign of reversal.
Seven Sub-Indicators Scan
| # | Indicator | Score | Rating | Raw Value | Direction |
|---|---|---|---|---|---|
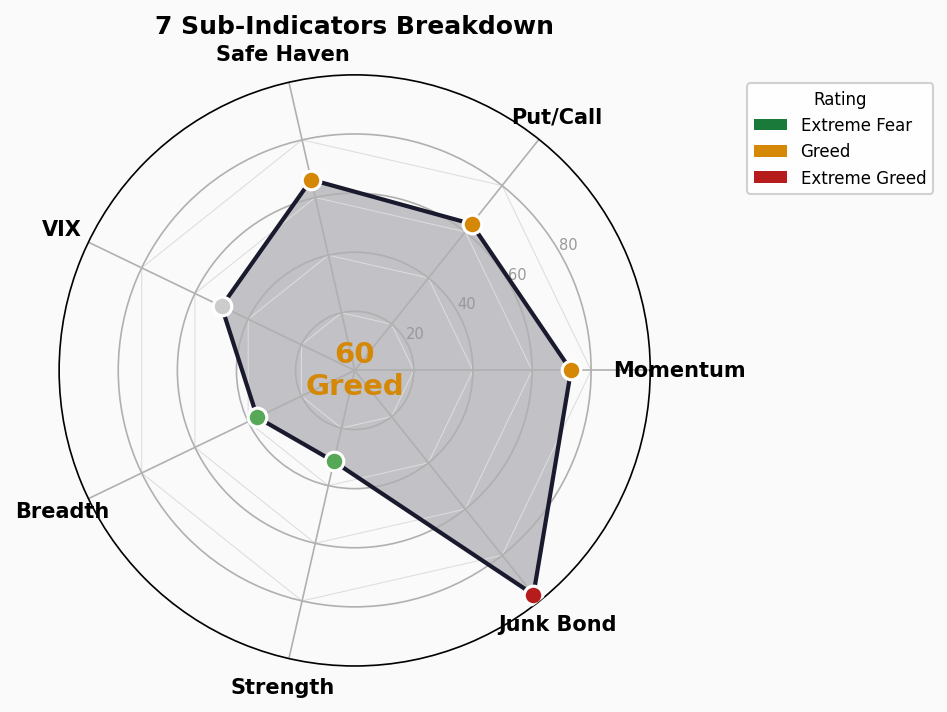
| 1 | Market Momentum (S&P 500) | 73.2 | 🟢 Greed | S&P 500 @ 7,710 | → Flat |
| 2 | Stock Price Strength | 31.6 | 🔴 Fear | 52wk high ratio 1.12 | ↑ Slight rise |
| 3 | Stock Price Breadth | 36.6 | 🔴 Fear | Adv/Dec ratio 938.2 | ↑ Slight rise |
| 4 | Put/Call Options | 63.4 | 🟢 Greed | P/C ratio 0.71 | ↓ Calls easing |
| 5 | Market Volatility (VIX) | 50.0 | ⚪ Neutral | VIX 15.15 | ↓ Volatility falling |
| 6 | Safe Haven Demand | 66.2 | 🟢 Greed | Stock-bond yield gap 3.07% | ↓ De-risking cooling |
| 7 | Junk Bond Demand | 97.0 | 🔴 Extreme Greed | Spread ratio 1.24 | → Flat |
Sub-Indicator Notes
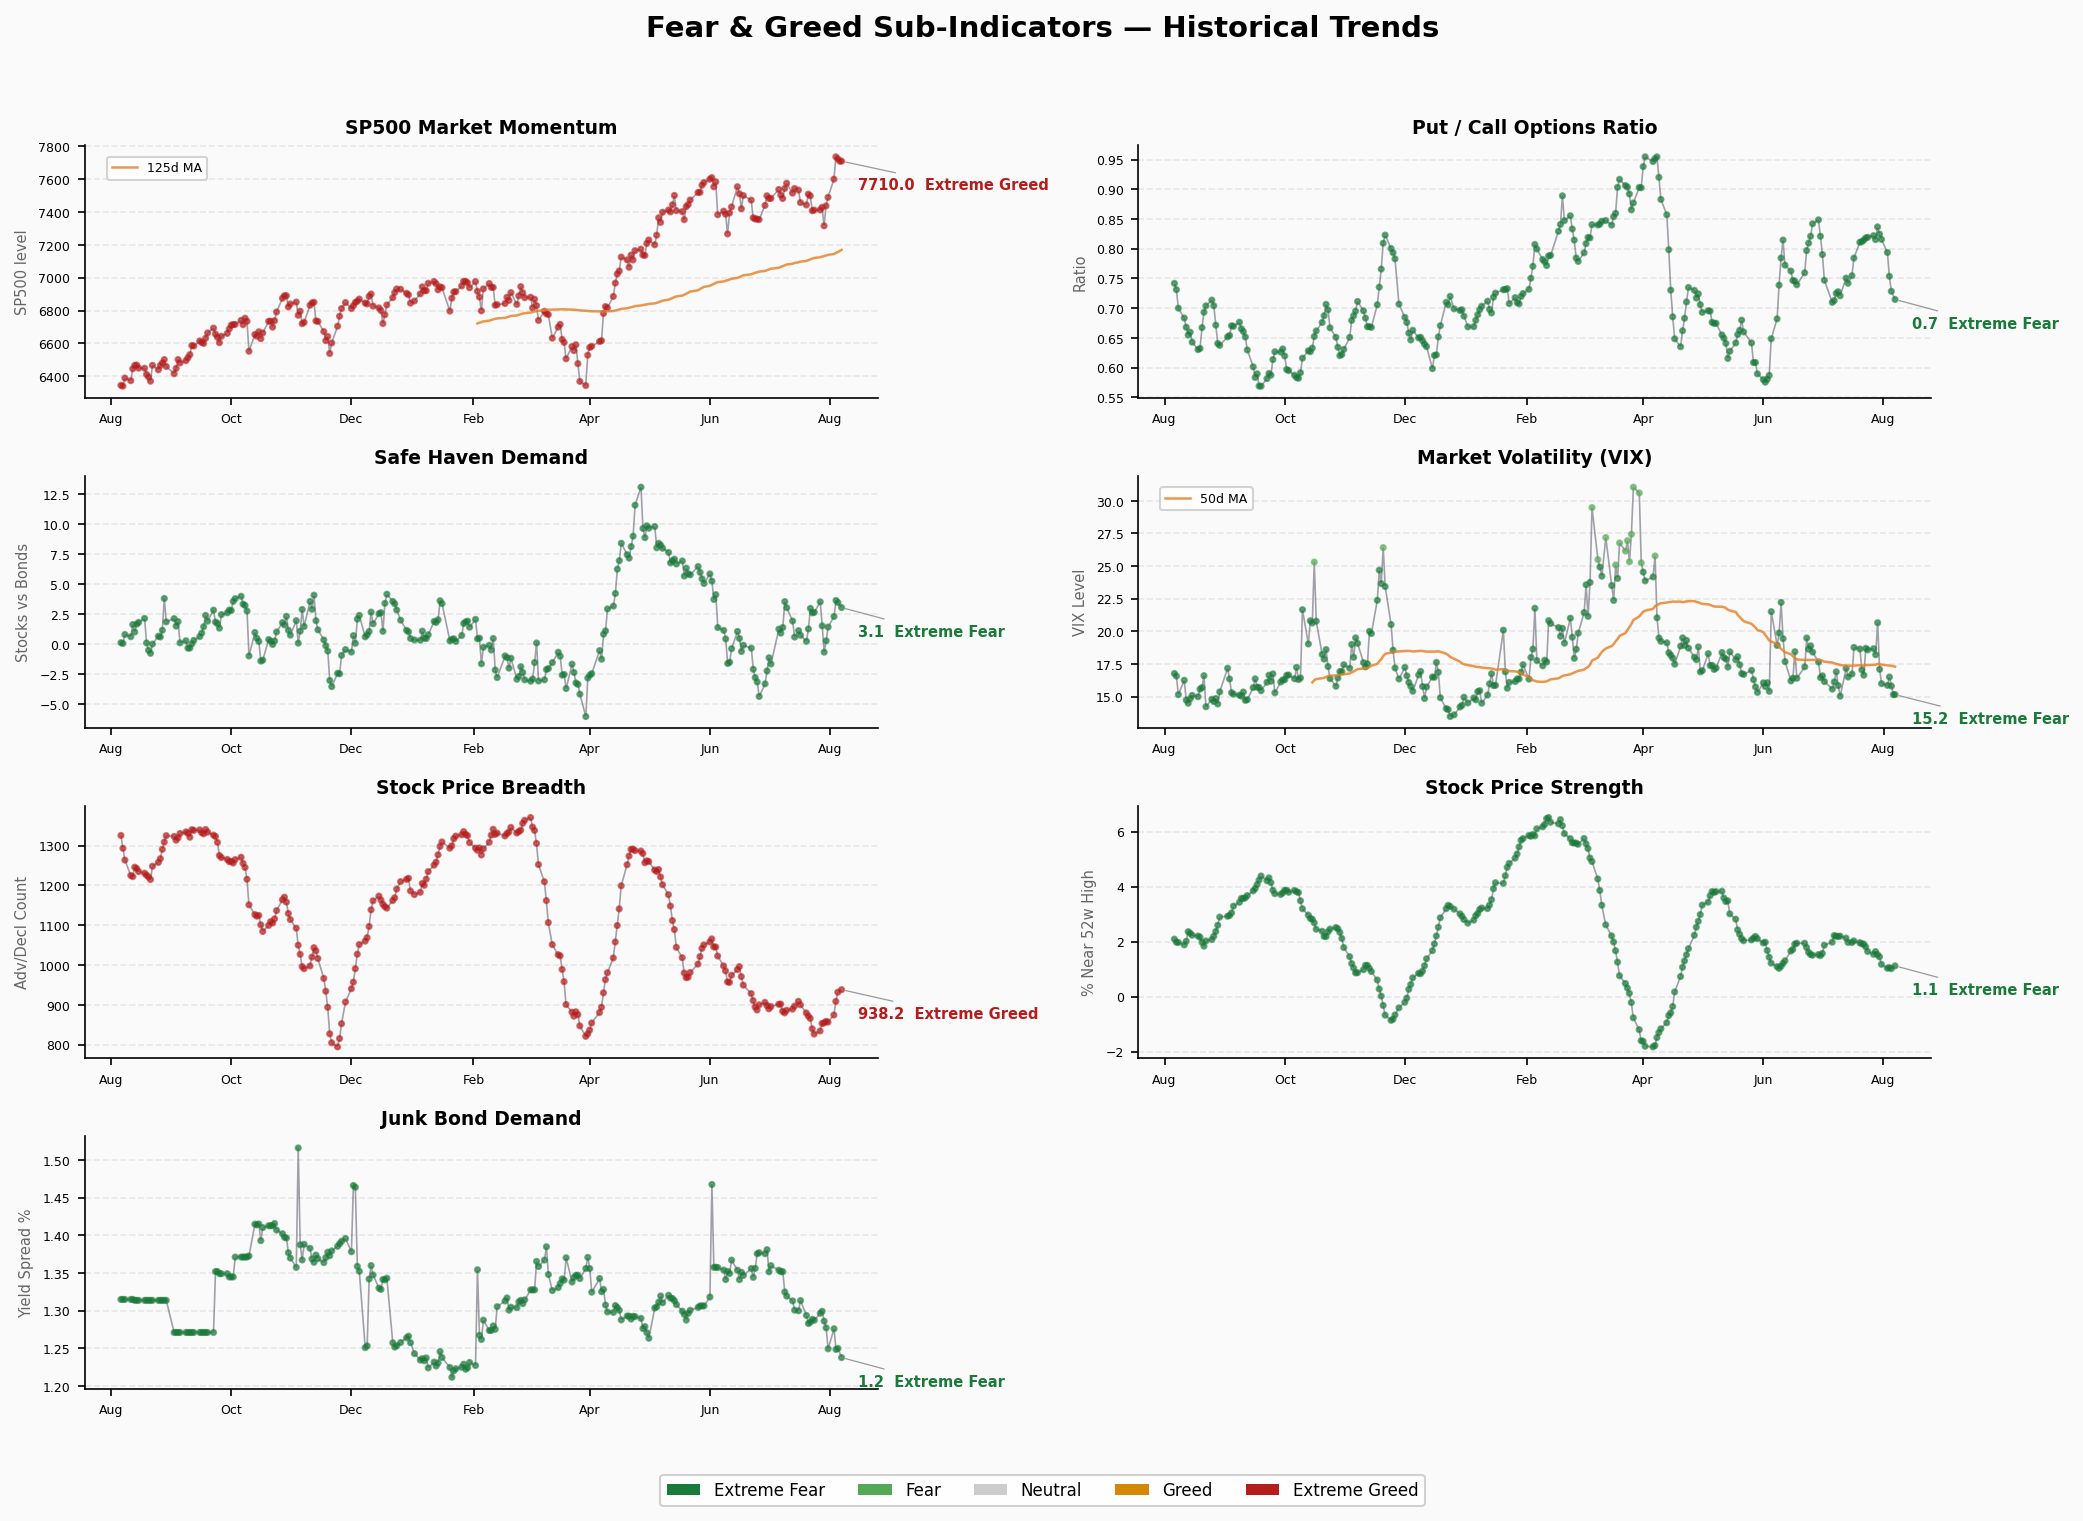
1. Market Momentum (73.2 — Greed) S&P 500 at 7,710, holding above 125-day moving average. Momentum remains in greed territory but has flatlined over the past three sessions. Upward thrust is decelerating.
2. Stock Price Strength (31.6 — Fear) Only 1.12% of stocks are near 52-week highs — well below what a healthy market should show. The index rises but individual stocks aren’t breaking out. Classic “narrow leadership” pattern.
3. Stock Price Breadth (36.6 — Fear) Advance/decline ratio improved from 908 to 938 but remains in fear zone. Market participation is thin — large-cap growth stocks carry the index while mid/small caps lag.
4. Put/Call Options (63.4 — Greed) P/C ratio at 0.71, options market leans bullish. Slightly lower than prior day’s 0.73, marginal decrease in call activity.
5. Market Volatility VIX (50.0 — Neutral) VIX at 15.15, historically mid-range. Down from 15.81 prior day. Panic has fully dissipated. Neutral VIX means neither fear nor extreme complacency.
6. Safe Haven Demand (66.2 — Greed) Stock-bond yield gap narrowed from 3.48% to 3.07%, capital rotating from bonds to equities. Risk appetite recovering, but trend is decelerating (3.66% → 3.07%).
7. Junk Bond Demand (97.0 — Extreme Greed) High-yield spreads extremely tight. Investors are pricing near-zero credit risk. Most extreme reading across all indicators, sustained at 95+ for weeks.
Structural Divergence Analysis
⚠️ Extreme Value Alerts
- >80 (Extreme Greed): Junk Bond Demand at 97.0 — credit markets in euphoria
- <40 (Fear): Stock Price Strength at 31.6, Stock Price Breadth at 36.6 — internal market weakness
🔍 Key Divergences
Divergence 1: Index Strength vs Individual Stock Weakness Market Momentum 73.2 (Greed) vs Stock Price Strength 31.6 (Fear) and Breadth 36.6 (Fear) — a 42-point gap. The index rally lacks broad participation, driven by a handful of mega-cap names. If leaders pull back, the index can catch down quickly.
Divergence 2: Credit Euphoria vs Equity Caution Junk Bond Demand 97.0 (Extreme Greed) shows credit markets pricing zero risk, yet Stock Price Strength sits at 31.6 (Fear). Credit markets are far more optimistic than equities — historically, this divergence resolves with credit tightening first.
Divergence 3: VIX Neutral vs Junk Bond Extreme VIX at 50.0 (Neutral) suggests normal volatility expectations, but Junk Bond Demand at 97.0 (Extreme Greed) shows credit markets with zero hedging. If credit spreads widen suddenly, VIX neutrality will be broken rapidly.
Trend Assessment
- Duration in range: The composite spent ~3 weeks in fear territory (mid-July to early August) and only 3 days in greed. Greed state is not yet consolidated.
- Reversal signals: Three days of stabilization at 59-60, neither advancing nor declining. Without improvement in price strength and breadth, upside is capped. A decline in junk bond demand from 97 would be an early credit-turn signal.
- Overall assessment: Sentiment recovery is rapid but structurally fragile. Short-term bullish but mid-term risks are accumulating.
🚨 Crisis Precursor Dashboard
1. Credit Spreads
| Indicator | Value | Status | Data Date |
|---|---|---|---|
| HY OAS | 2.75% | 🟢 Normal | 2026-08-05 |
| IG OAS | 0.78% | 🟢 Normal | 2026-08-05 |
- Thresholds: HY <3% normal | 3-5% caution | 5-8% panic | >8% crisis
- Trend: HY OAS holding at 2.75%, historically low. Credit markets are not pricing any recession risk. Consistent with FNG Junk Bond Demand at 97 (Extreme Greed) — tighter spreads = higher greed reading.
2. Yield Curve
| Indicator | Value | Status |
|---|---|---|
| 10Y-2Y Spread | +44bp | 🟢 Normal/Flat |
| 10Y | 4.63% | — |
| 2Y | 4.18% | — |
| 30Y | 5.17% | — |
| 10Y-30Y Spread | -54bp | ⚠️ 30Y above 10Y |
- Interpretation: The front-end (10Y-2Y) spread has normalized and is no longer inverted. However, 10Y-30Y remains negative (30Y higher than 10Y), reflecting term premium and inflation expectation mismatch. No crisis signal overall.
3. FINRA Margin Debt
| Indicator | Value | Status |
|---|---|---|
| Latest Margin Debt | $1.416T (May 2026) | 🔴 Record High |
| MoM Change | +$112B (+8.5%) | ↑ Surging |
| YoY Change | +53.7% | 🔴 Abnormally high |
| Margin Debt / GDP | 4.71% (Jun 2026) | 🔴 Record High |
| Long-term Average | 3.05% | — |
- Interpretation: Margin debt has grown for 10 consecutive months, reaching $1.416T in May with +53.7% YoY growth. Historically, only three periods saw similar growth rates: 1999-2000 (dot-com), 2007 (pre-GFC), and 2021 (pre-2022 bear market). Each was followed by a significant drawdown within 12 months. Margin debt-to-GDP at 4.71% is the highest on record. This is the brightest red flag currently.
4. IPO Activity
| Indicator | Value | Status |
|---|---|---|
| 2026 YTD IPOs | ~73 | 🟡 Below average |
- Interpretation: IPO volume is moderate, far below 2021’s frenzy. This suggests market enthusiasm is concentrated in existing assets (ETFs and large caps) rather than new issuance. Not a red flag.
5. Fund Flows
| Indicator | Value | Status |
|---|---|---|
| 2026 H1 ETF Inflows | $1 trillion | 🔴 Record pace |
| Full-year projection | $2.3 trillion | 🔴 Would exceed 2025’s $1.5T record |
| Equity ETFs | $680B (H1) | — |
| Bond ETFs | ~$300B (H1) | — |
| New ETF launches | 700 YTD | 🔴 Record |
- Interpretation: ETF inflows are unprecedented. H1 2026 saw $1T in flows, two-thirds of 2025’s full-year record. State Street projects $2.3T for the full year. Massive liquidity is the core driver of elevated valuations, but also means redemption pressure will be record-breaking if sentiment turns.
Composite Assessment
| Sector | Signal | Notes |
|---|---|---|
| Credit Spreads | 🟢 🟢 | HY and IG both normal, no credit stress |
| Yield Curve | 🟢 | 10Y-2Y normalized, no front-end inversion |
| Margin Debt | 🔴 | $1.416T record high, +53.7% YoY, comparable to 2000/2007/2021 |
| IPO | 🟡 | Moderate volume, not overheated |
| Fund Flows | 🔴 | $1T H1 inflows at record pace |
Total: 2 🟢 / 1 🟡 / 2 🔴
Overall Assessment: Credit spreads and yield curves — the two hard indicators — remain healthy with no immediate crisis signal. However, margin debt and fund flows — the leverage/sentiment indicators — are in historically extreme territory. The key risk is not credit markets (still calm) but leverage: $1.4T in margin debt growing at 53.7% YoY matches only three comparable historical periods, all followed by 20%+ drawdowns within 12 months. Credit spreads are lagging indicators — they were also benign in July 2007 with HY OAS around 3%.
Strategic implication: Not recommending panic selling, but leverage risk should be taken seriously. Consider modest de-risking or hedging. Watch for credit spread widening or VIX breaking above 20 as further action triggers.