CNN Fear & Greed Sentiment Analysis 2026-08-06
Composite score 59.66 (Greed), up 25 points in one week. Sub-indicator divergence is severe: Junk Bond Demand 95.2 extreme greed vs Stock Price Strength 29.4 fear. Credit spreads stable, FINRA margin debt at record $1.502T.
Composite Index
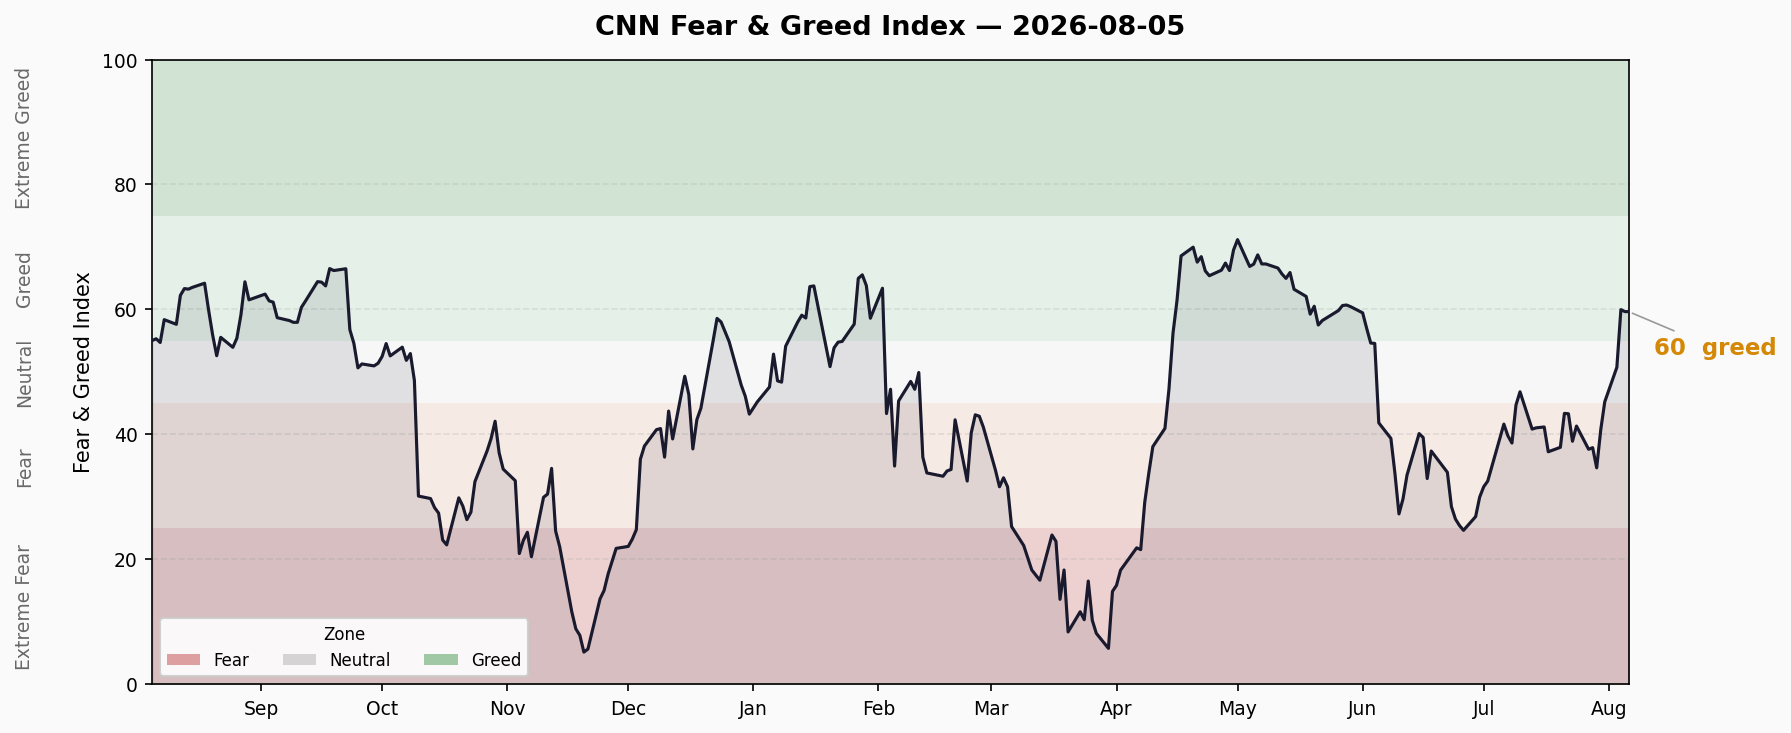
Latest Reading: 59.66 — Greed
| Timeframe | Score | Rating | Change |
|---|---|---|---|
| Today | 59.66 | Greed | — |
| Previous Close | 58.17 | Greed | +1.49 |
| 1 Week Ago | 34.66 | Fear | +25.00 |
| 1 Month Ago | 32.54 | Fear | +27.12 |
| 1 Year Ago | 55.03 | Greed | +4.63 |
Last 10 Days Trend:
| Date | Score | Rating |
|---|---|---|
| 07-24 | 41.3 | Fear |
| 07-27 | 37.6 | Fear |
| 07-28 | 37.9 | Fear |
| 07-29 | 34.7 | Fear |
| 07-30 | 40.7 | Fear |
| 07-31 | 45.2 | Neutral |
| 08-03 | 50.7 | Neutral |
| 08-04 | 60.0 | Greed |
| 08-05 | 59.7 | Greed |
Trend direction: ⬆ Sharp rebound. Jumped from Fear zone (34.7) to Greed zone (59.7) in one week, a 25-point swing. First return to Greed territory since mid-July.
Seven Sub-Indicators Scan
| # | Indicator | Score | Rating | Raw Value | Direction |
|---|---|---|---|---|---|
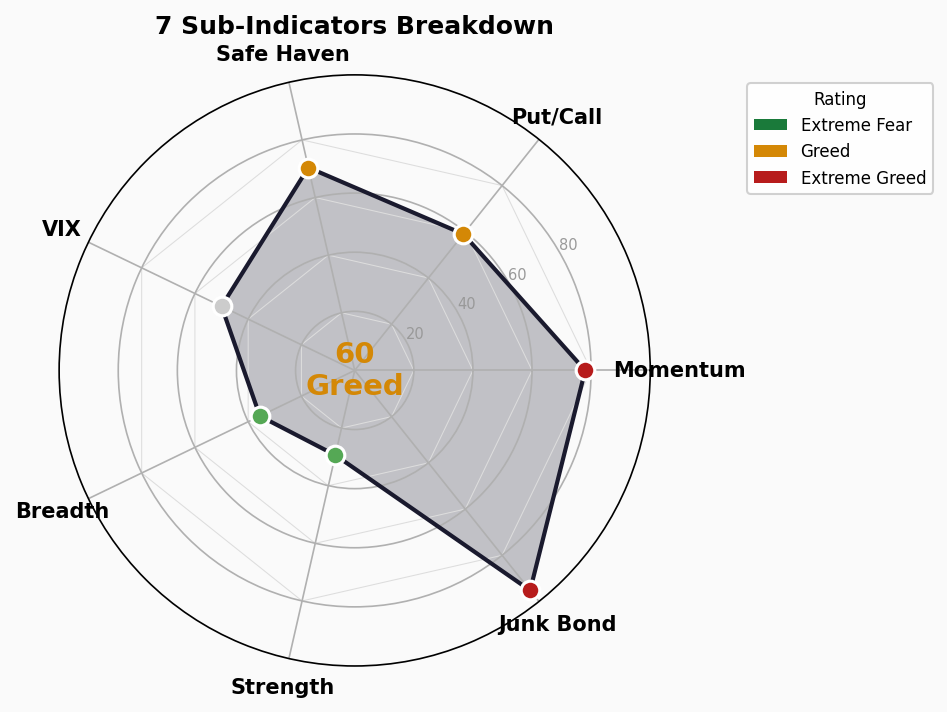
| 1 | Market Momentum S&P 500 | 78 | Extreme Greed | S&P 7723.55 | ⬆ |
| 2 | Stock Price Strength | 29.4 | Fear | Ratio 1.02 | ⬇ |
| 3 | Stock Price Breadth | 35.6 | Fear | 931.86 | ⬆ |
| 4 | Put/Call Options | 59 | Greed | 0.728 | ⬇ |
| 5 | Market Volatility VIX | 50 | Neutral | 15.81 | ⬇ |
| 6 | Junk Bond Demand | 95.2 | Extreme Greed | Spread 1.25% | ⬜ |
| 7 | Safe Haven Demand | 70.4 | Greed | 3.48 | ⬇ |
Sub-Indicator Breakdown
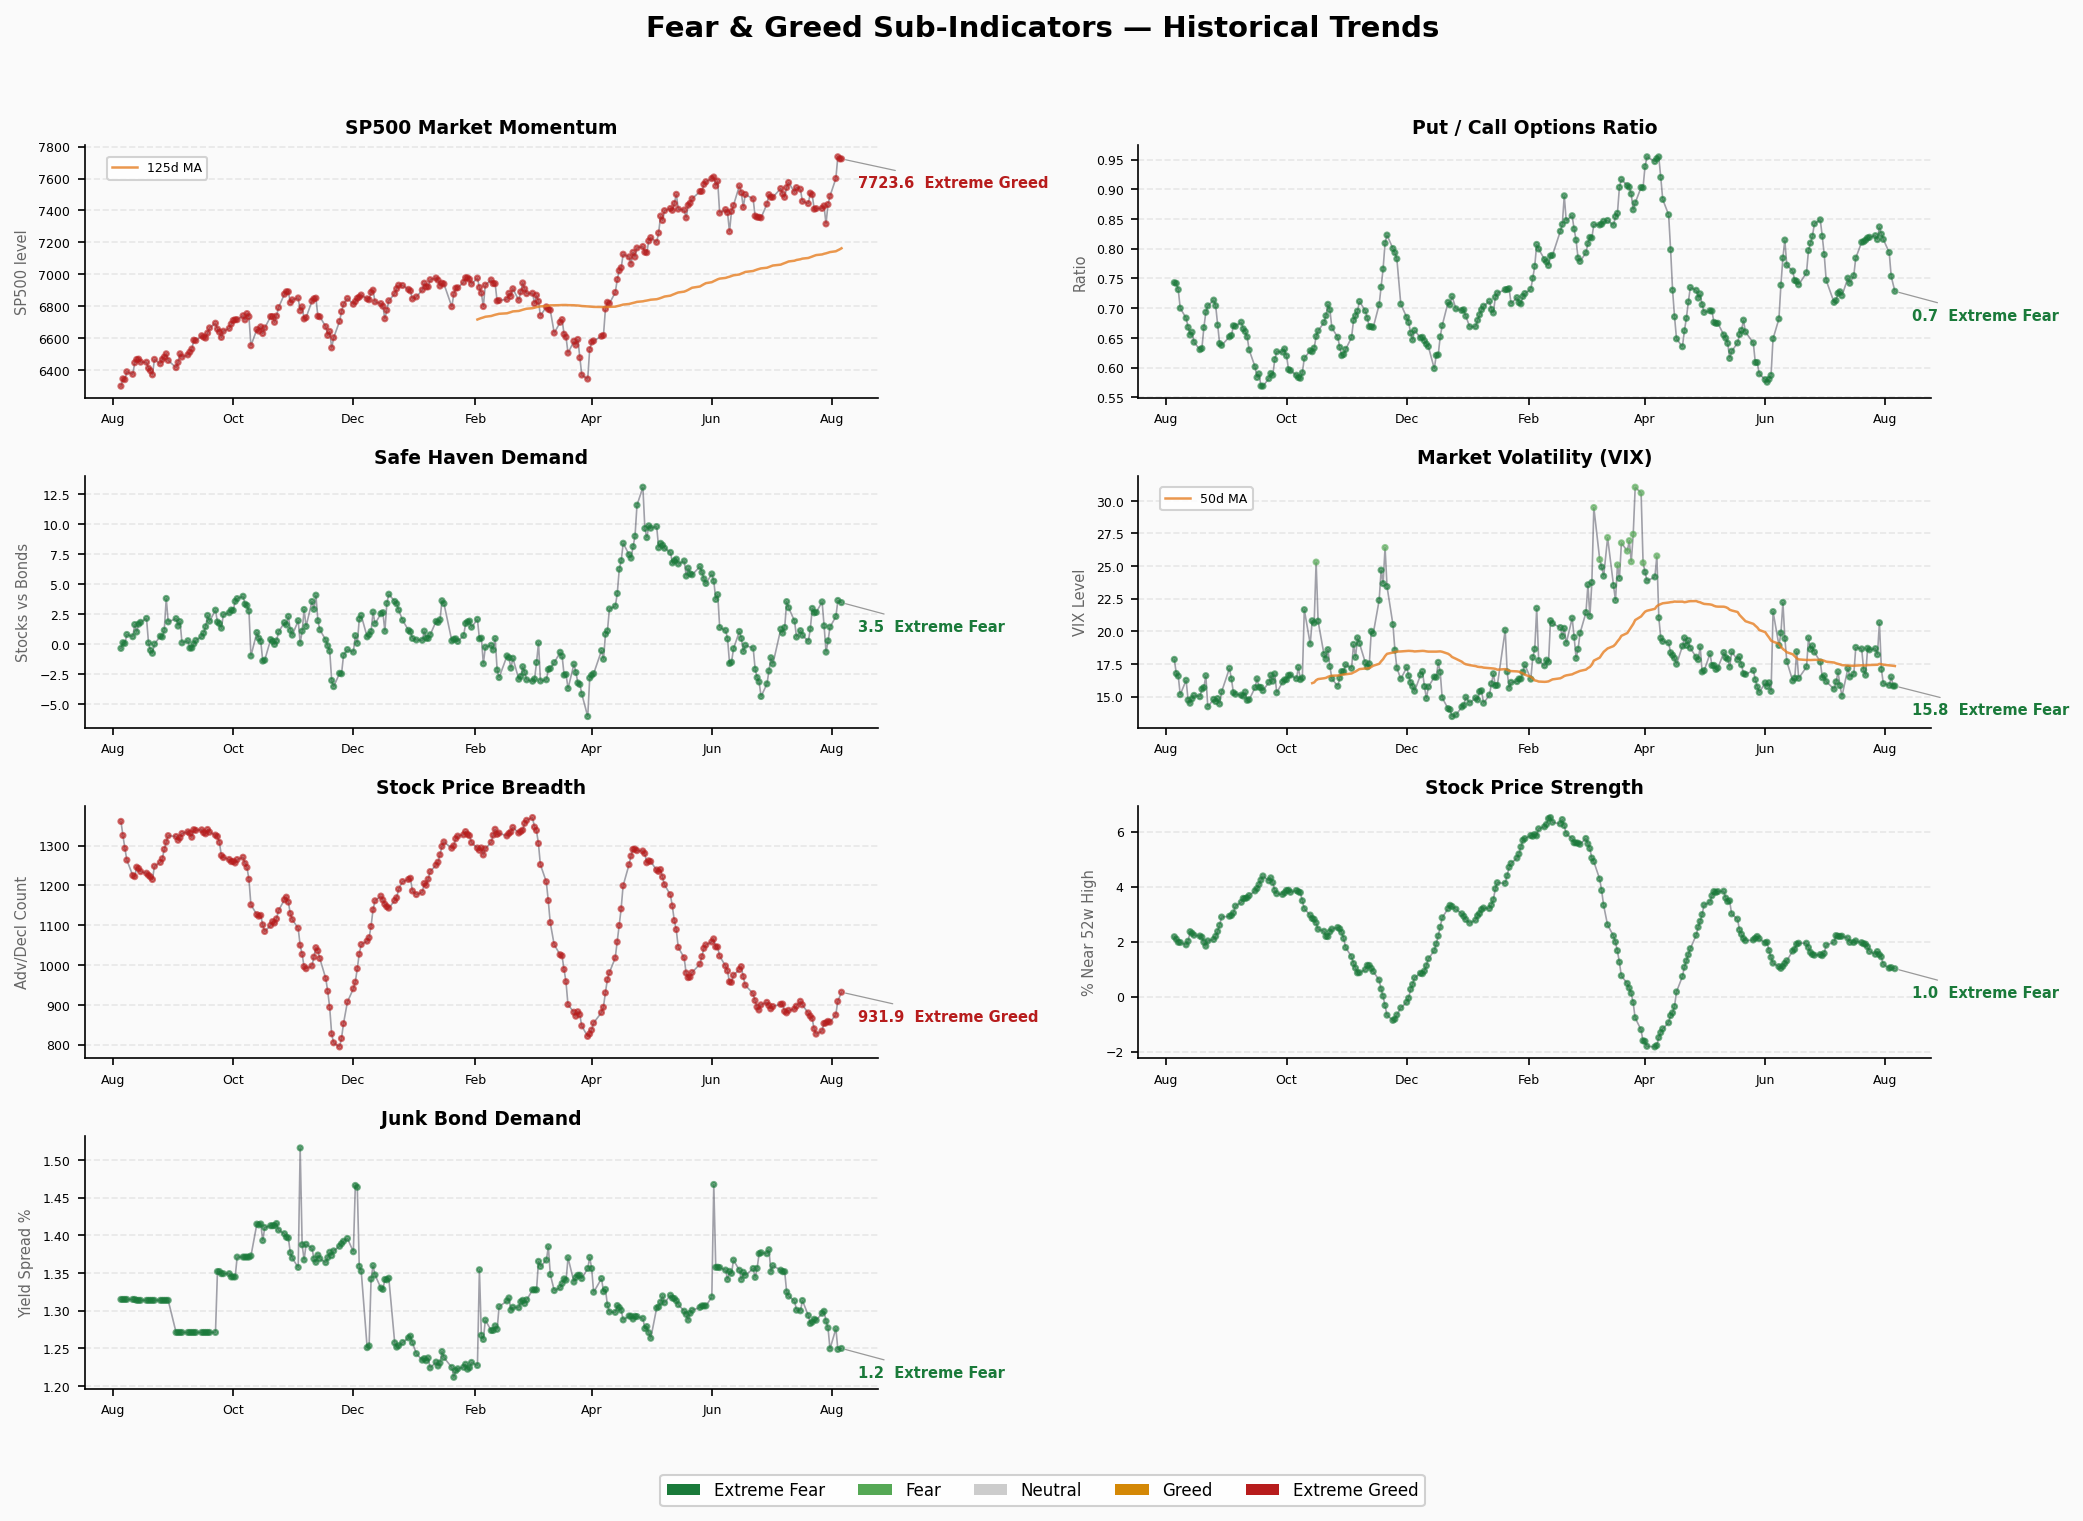
① Market Momentum (S&P 500): 78 — Extreme Greed S&P 500 at 7723.55, climbing steadily from 7489.72 over 5 days. Index momentum is strong, but gains are concentrated in a few high-weight names.
② Stock Price Strength: 29.4 — Fear New highs/new lows ratio at 1.02, near balance but weak. The index is rising, but few individual stocks are making new highs — a classic “few giants carry the index” pattern.
③ Stock Price Breadth: 35.6 — Fear Breadth indicator rose from 858.49 to 931.86, improving but still in Fear territory. The number of advancing stocks lags behind index gains, confirming insufficient breadth.
④ Put/Call Options: 59 — Greed P/C ratio at 0.728, continuously declining (from 0.825→0.728). Call buying is active. Options traders are leaning bullish.
⑤ Market Volatility VIX: 50 — Neutral VIX at 15.81, slightly down from 16.50 previous day. Volatility remains low with no obvious panic. 50-day average at 17.36 also declining.
⑥ Junk Bond Demand: 95.2 — Extreme Greed Junk bond spread at just 1.25%, extremely compressed. Investors are pricing almost zero credit risk, with capital flooding into high-yield bonds. This is the most extreme reading across all indicators.
⑦ Safe Haven Demand: 70.4 — Greed Safe haven demand indicator at 3.48, slightly down from 3.66 previous day. Capital continues to flow out of safe haven assets, though the pace is slowing.
Structural Divergence Analysis
Core Contradiction: Extreme Greed vs Fear Coexist
The composite FNG score of 59.66 (Greed) masks severe divergence among sub-indicators:
Junk Bond 95.2 vs Stock Price Strength 29.4 — 65.8-point gap Junk bond demand is at extreme greed (95.2), indicating the fixed income market is extremely tolerant of risk. Yet stock price strength is only 29.4 (Fear), with few stocks making new highs. Bonds say “no risk,” equity breadth says “rally is unhealthy.”
Market Momentum 78 vs Stock Price Breadth 35.6 — 42.4-point divergence S&P 500 momentum is in extreme greed, but stock price breadth is in Fear. The index is rising, but most stocks aren’t keeping up. Historically, this divergence is often a precursor to trend reversal.
VIX Neutral 50 vs Junk Bond 95.2 Volatility isn’t signaling panic, but the extreme greed in junk bonds suggests the market may be underpricing tail risk. Low volatility + extremely compressed credit spreads is typically a “calm before the storm” pattern.
Assessment: The composite index appears moderately greedy, but internal divergence has reached concerning levels. Classic signs of “fake prosperity” at the index level — a few mega-caps lifting the index, extremely low credit spreads, and insufficient breadth. Historically, this structure is vulnerable to rapid reversal under liquidity tightening or event shocks.
Trend Assessment
- Zone Duration: The composite just broke out from the Fear zone (where it spent ~3 weeks during late July, ranging 22-41) into Greed. Previously sustained in Fear/Extreme Fear for approximately 3 weeks.
- Reversal Speed: Jumped 25 points in one week (34.7→59.7), extremely rapid. Such sharp shifts are typically event-driven (e.g., Fed policy pivot, major economic data) and require monitoring for sustainability.
- Key Watch: If stock price strength and breadth can rise above neutral in the next 1-2 weeks, the current Greed reading has fundamental support. If they remain in Fear territory, the composite’s Greed reading is unsustainable and at risk of pullback.
🚨 Crisis Precursor Indicators Dashboard
1. Credit Spreads
- HY OAS: 2.73% | 🟢 Normal
- IG OAS: 0.78% | 🟢 Normal
- Trend: Stable. HY OAS remains below 3%, IG OAS below 1%. Credit market shows no stress signals.
- Data Date: 2026-08-04 (FRED)
2. Yield Curve
- 10Y-2Y Spread: +45bp | 🟢 Normal
- 10Y: 4.63% | 2Y: 4.20% | 30Y: 5.18%
- 10Y-30Y Spread: -55bp | 🟡 Long-end inversion
- Trend: Short-end curve is normal, but the long-end (10Y-30Y) is inverted by 55bp, suggesting market caution on long-term growth expectations.
3. Margin Debt
- FINRA Margin Debt: $1.502T (June 2026) | 🔴 Record High
- YoY Change: +41.3% (relative to M2, up from 4.6% to 6.5%)
- Trend: Consecutive monthly increases. Both absolute and relative values are at all-time highs. Leverage levels have exceeded the 2021 bubble peak.
- Source: FINRA / GuruFocus
4. IPO & Fund Flows
- IPO Proceeds: H1 2026 ~$114.1B, 7x YoY | 🔴 Overheated
- ETF Net Inflows: H1 2026 $1 trillion, all-time record | 🔴 Capital surge
- 2026 IPO Outlook: Full-year could exceed $250B, approaching 2021 peak
- Trend: SpaceX, Cerebras and other large IPOs drove proceeds. 97% of IPOs priced above offer price on first day, showing extremely strong risk appetite.
- Source: PwC / iShares / JPMorgan
Overall Assessment: 2 🟢 / 1 🟡 / 2 🔴
Credit spreads and the short-end yield curve remain normal, indicating market liquidity is adequate. However, FINRA margin debt at a record $1.502T and record IPO/ETF inflows signal that leverage and capital flows are in overheated territory. The long-end yield curve inversion (10Y-30Y -55bp) is an additional cautionary signal.
Combined with the structural divergence in FNG sub-indicators (junk bond extreme greed vs equity breadth fear), the current market “greed” is built on leverage and liquidity rather than broad fundamental support. Watch closely for any widening of credit spreads — that would be the first turning signal.