CNN Fear & Greed Sentiment Analysis 2026-08-05
Fear & Greed composite at 58.1 (Greed), surging +12.3 points from 45.8 prior day, jumping from Neutral into Greed territory. S&P momentum at extreme greed (81.4) severely diverges from price breadth (32.4, fear). Margin debt hits $1.502T record high. Credit spreads and yield curve remain normal, but leverage and fund flows flash red.
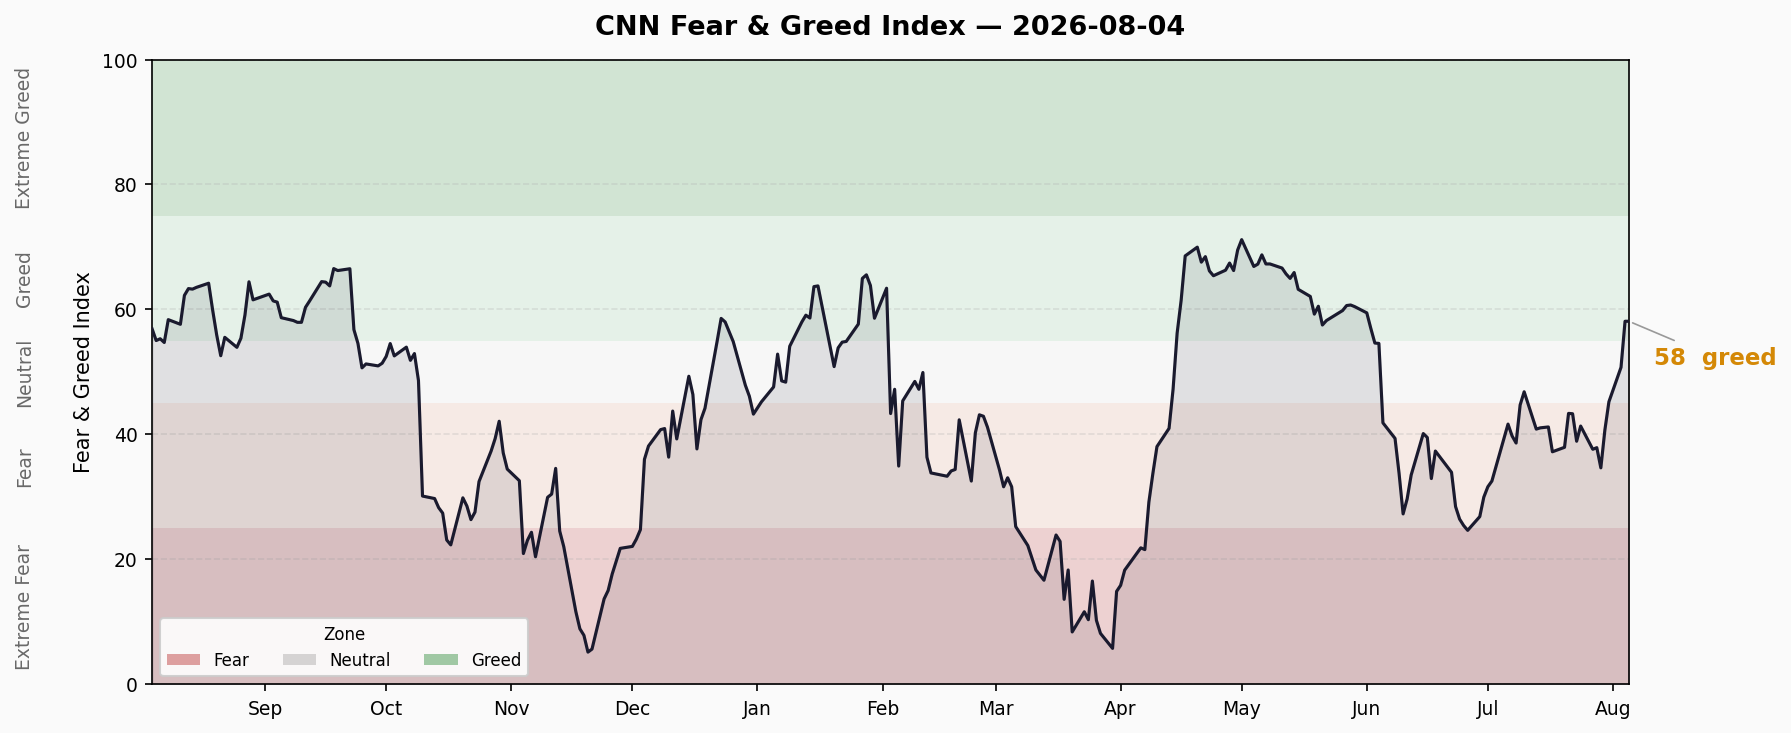
Composite Index Trend
| Metric | Value | Rating |
|---|---|---|
| Latest Index | 58.1 | 🟢 Greed |
| Previous Close | 45.8 | Neutral |
| 1 Week Ago | 37.9 | Fear |
| 1 Month Ago | 32.5 | Fear |
| 1 Year Ago | 56.9 | Greed |
Daily Change: +12.3 points (45.8 → 58.1), leaping from Neutral into Greed territory — a significant single-day rally.
Recent 10 Trading Days:
| Date | Index | Rating |
|---|---|---|
| 7/23 | 38.9 | Fear |
| 7/24 | 41.3 | Fear |
| 7/27 | 37.6 | Fear |
| 7/28 | 37.9 | Fear |
| 7/29 | 34.7 | Fear |
| 7/30 | 40.7 | Fear |
| 7/31 | 45.2 | Neutral |
| 8/1 (Fri) | — | — |
| 8/2 (Sat) | — | — |
| 8/3 (Mon) | 50.7 | Neutral |
| 8/4 (Tue) | 58.1 | Greed |
Trend Direction: 5 consecutive up-days (7/29 low of 34.7 → 8/4 at 58.1), a +23.4-point rebound. The index broke through the Neutral zone into Greed, signaling rapid sentiment repair.
Seven Sub-Indicators Scan
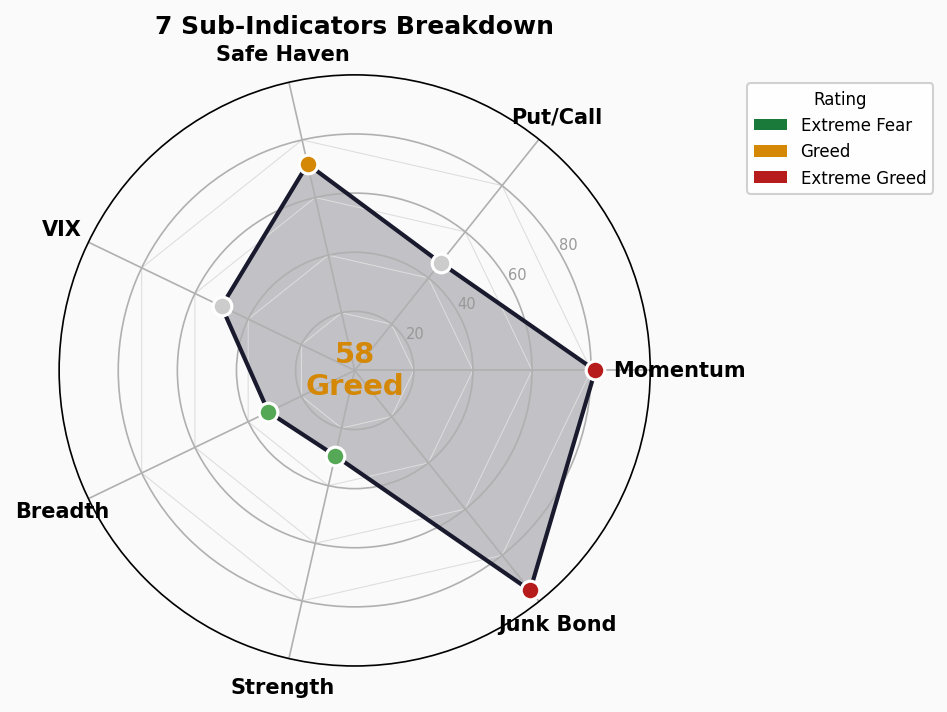
| # | Sub-Indicator | Score | Rating | Raw Value | Direction |
|---|---|---|---|---|---|
| 1 | Market Momentum (S&P 500) | 81.4 | 🔴 Extreme Greed | S&P 500 = 7,736.52 | ↑ Strengthening |
| 2 | Stock Price Strength | 29.6 | 🟡 Fear | NH-NL ratio = 1.06 | ↓ Deteriorating |
| 3 | Stock Price Breadth | 32.4 | 🟡 Fear | McClellan Osc = 908.66 | ↑ Slight improvement |
| 4 | Put/Call Options | 46.6 | ⚪ Neutral | P/C Ratio = 0.75 | ↓ Lean bullish |
| 5 | Market Volatility (VIX) | 50.0 | ⚪ Neutral | VIX = 16.50 | — Stable |
| 6 | Junk Bond Demand | 95.2 | 🔴 Extreme Greed | Spread = 1.25% | ↓ Spreads tightening |
| 7 | Safe Haven Demand | 71.6 | 🟢 Greed | Safe vs Risk = 3.64 | ↑ Risk appetite rising |
Sub-Indicator Interpretation
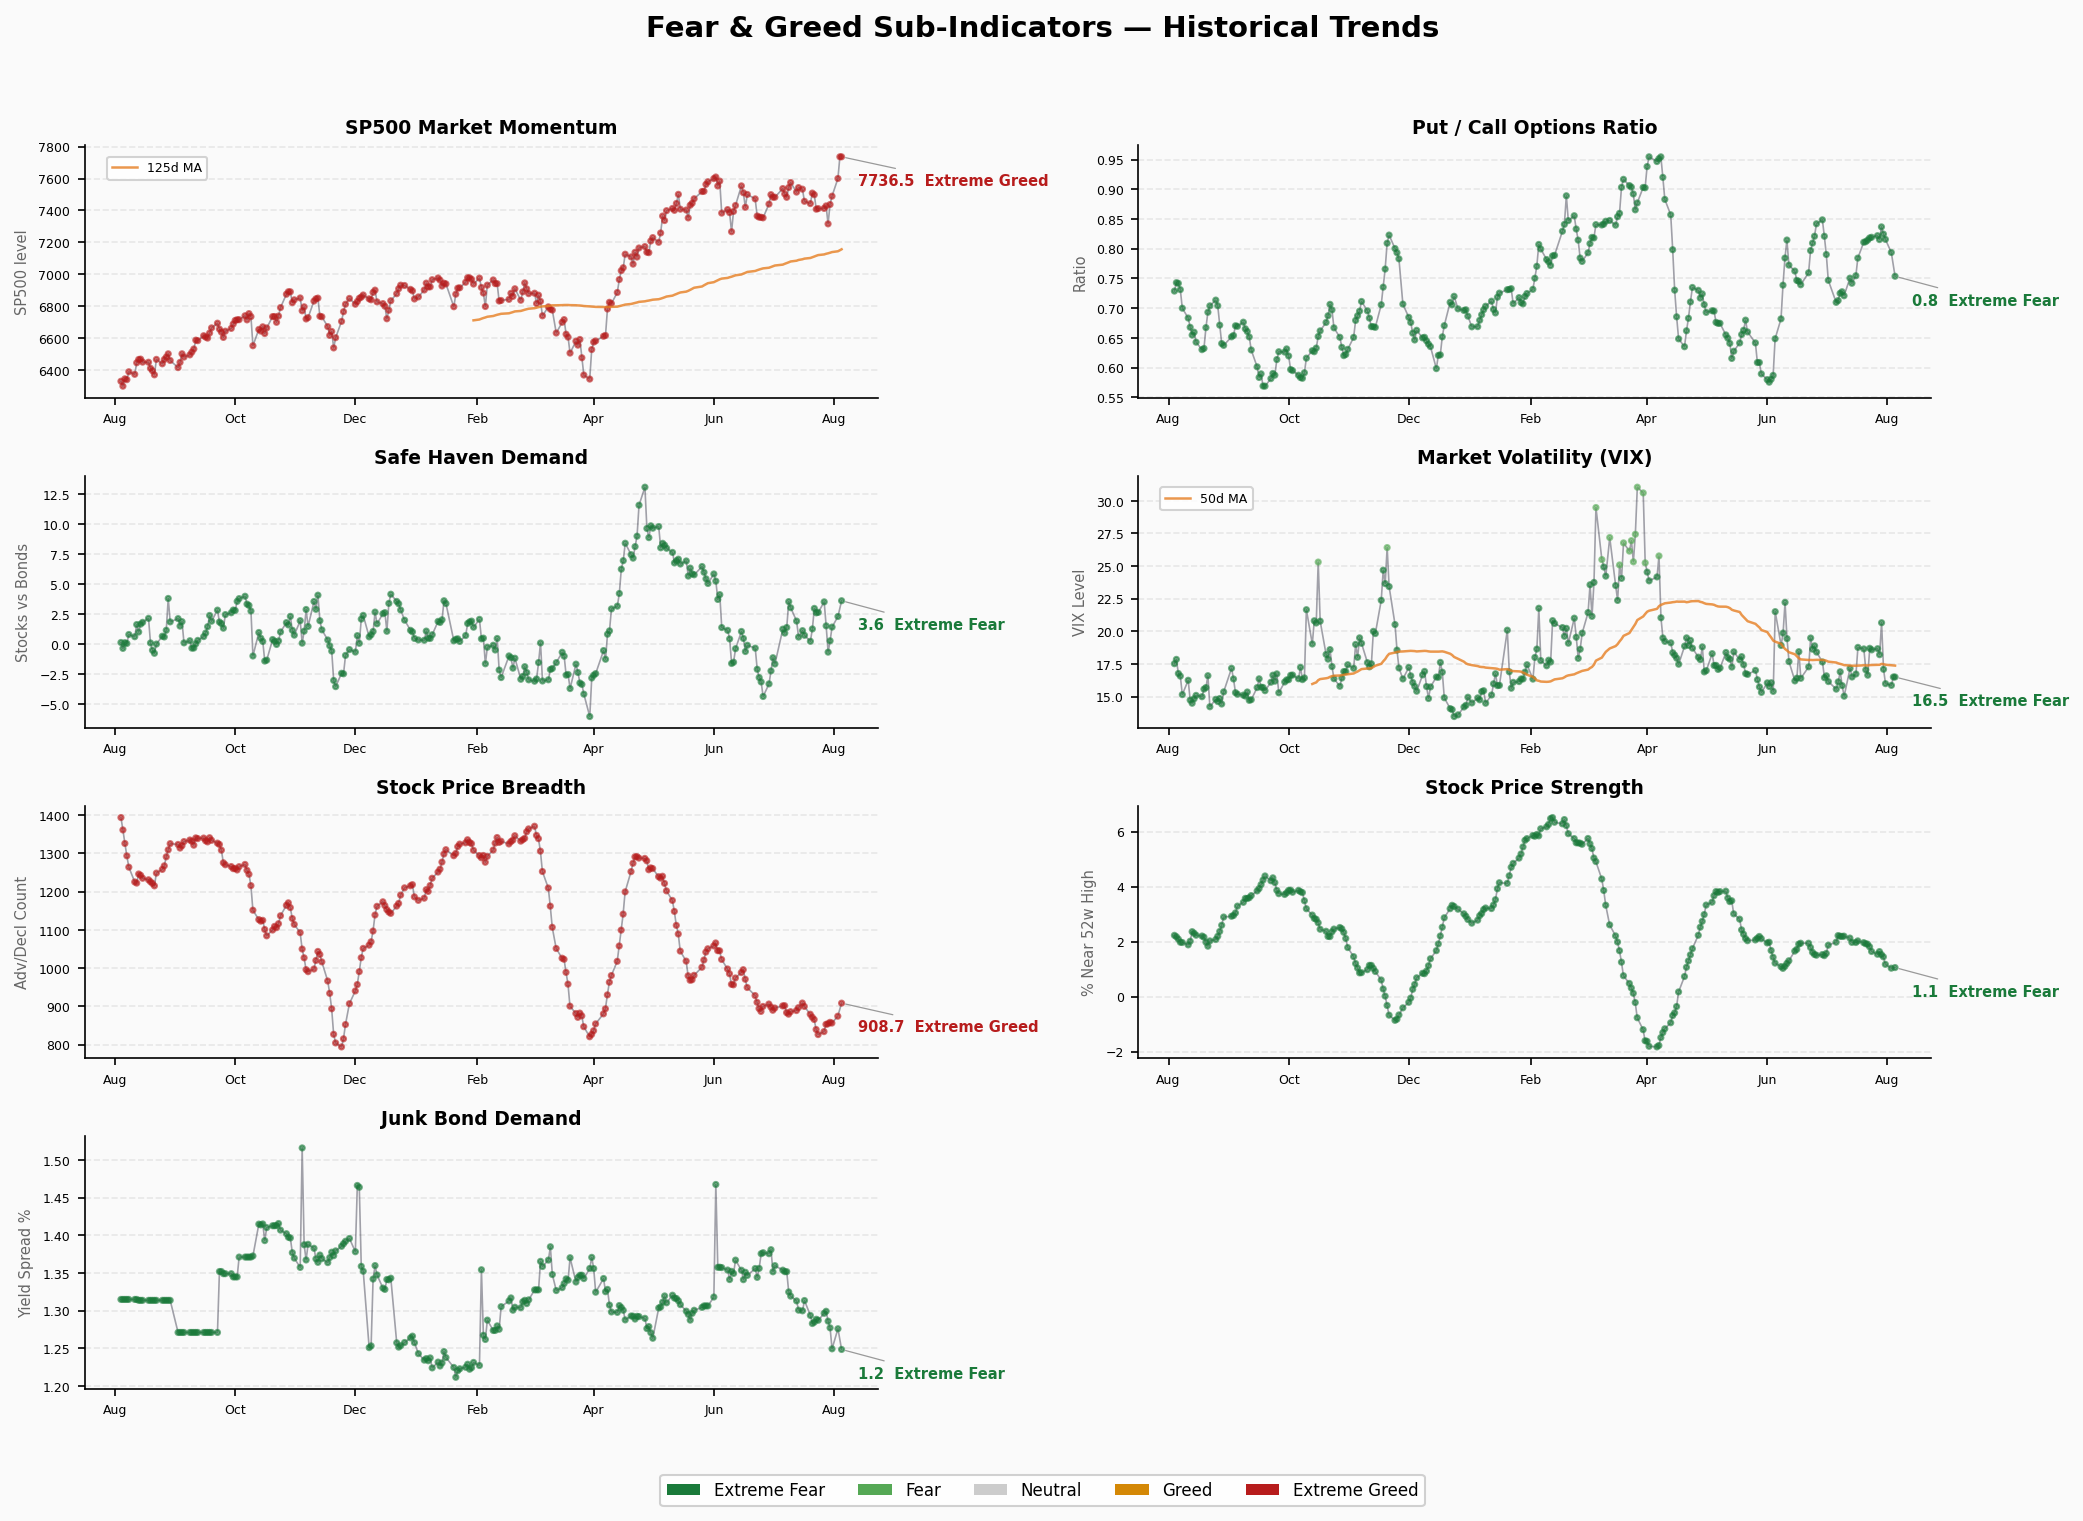
1️⃣ Market Momentum — Extreme Greed (81.4) S&P 500 at 7,736, well above its 125-day moving average. Price trend is strong, but this is one of the few indicators propping up the composite index.
2️⃣ Stock Price Strength — Fear (29.6) New high/new low ratio at just 1.06 — barely more stocks hitting 52-week highs than lows. With S&P 500 near record territory, this is anomalously weak. The index rally is driven by a handful of mega-cap names.
3️⃣ Stock Price Breadth — Fear (32.4) McClellan Oscillator at 908.66 — positive but narrow. Market participation is insufficient, creating a stark contrast with the momentum indicator.
4️⃣ Put/Call Options — Neutral (46.6) Put/call ratio at 0.75, slightly bullish but not extreme. Options market sentiment is relatively tempered — no signs of excessive optimism or pessimism.
5️⃣ Market Volatility (VIX) — Neutral (50.0) VIX at 16.50, historically low but not at extremes. Market volatility is calm; no panic signals present.
6️⃣ Junk Bond Demand — Extreme Greed (95.2) High-yield bond spread at just 1.25%, with capital flooding into junk bonds. The ultra-low spread indicates investors are pricing credit risk with extreme complacency — yield-chasing behavior has reached extreme levels.
7️⃣ Safe Haven Demand — Greed (71.6) Demand for safe-haven assets is declining as capital rotates into risk assets. Consistent with junk bond demand — risk appetite is elevated.
Structural Contradiction Analysis
⚠️ Core Divergence: Momentum Extreme Greed vs. Breadth Fear
This is the most prominent structural contradiction:
- S&P Momentum 81.4 (Extreme Greed) vs Price Breadth 32.4 (Fear) vs Price Strength 29.6 (Fear)
- Spread of 49-52 points — a severe divergence
Implication: The index looks strong on the surface, but internal participation is extremely low. A handful of mega-cap stocks (likely AI/tech leaders) are single-handedly pulling the index higher while most stocks lag behind. This “narrow rally” structure is a classic market-top precursor.
⚠️ Junk Bond Extreme Greed
Junk Bond Demand at 95.2 (Extreme Greed) with spreads at 1.25%. Investors are chasing risk yield without restraint. Credit risk pricing is extremely loose. Historically, this indicator above 90 often coincides with excessive complacency in credit markets.
⚠️ Safe Haven vs. Breadth Contradiction
Safe Haven Demand at 71.6 (Greed) shows capital flowing out of safe havens, yet price breadth is only 32.4 (Fear). Capital is chasing risk but not broadly participating — more likely passive flows and index funds pushing up heavy-weight stocks.
Trend Assessment
Range Duration: The composite spent most of July in the Fear zone (20-40), before breaking through Neutral into Greed in early August.
Turning Indicators:
- Bullish: Composite has risen for 5 consecutive days, breaking above the 50 midline; VIX remains low and stable
- Bearish: Breadth and strength indicators still in fear territory, severely diverging from momentum; junk bond demand at extreme greed
- Neutral: Put/call ratio is neutral — no extreme positioning in the options market
Assessment: The index may continue higher in the short term, but the breadth divergence is a significant hidden risk. If price strength and breadth do not repair within 1-2 weeks, the divergence will continue to widen, increasing the risk of a later correction. Historically, the combination of extreme greed in momentum + fear in breadth typically resolves through breadth “fixing” via a decline rather than small-caps catching up.
🚨 Crisis Precursor Dashboard
1. Credit Spreads
| Indicator | Value | Status | Data Date |
|---|---|---|---|
| HY OAS | 2.78% | 🟢 Normal/Greedy | 2026-08-03 |
| IG OAS | 0.78% | 🟢 Normal | 2026-08-03 |
Thresholds: HY <3% normal | 3-5% caution | 5-8% panic | >8% crisis Thresholds: IG <1% normal | 1-2% caution | >2% panic
Trend: HY OAS stable at 2.78%, below the 3% caution line. IG OAS at 0.78% also in normal territory. Credit markets are not pricing recession risk — consistent with the extreme greed in FNG junk bond demand. Credit spreads are compressed to the extreme, with risk pricing overly optimistic.
2. Yield Curve
| Indicator | Value | Status |
|---|---|---|
| 10Y-2Y Spread | +43bp | 🟢 Normal, slightly flat |
| 10Y | 4.70% | |
| 2Y | 4.25% | |
| 30Y | 5.23% |
Trend: Yield curve has normalized with 10Y-2Y back in positive territory at +43bp. However, the 10Y-30Y spread is -53bp (inverted) — the long end remains abnormal. 30Y at 5.23% significantly above 10Y at 4.70%, reflecting market concerns about long-term inflation or fiscal deficits. No near-term recession signal, but long-end inversion warrants attention.
3. Margin Debt
| Indicator | Value | Status |
|---|---|---|
| FINRA Margin Debt (Jun 2026) | $1.502 Trillion | 🔴 Record High |
Trend:
- Apr: $1.304T → May: $1.416T → Jun: $1.502T
- MoM: +8.5% (May→Jun), YoY: +53.7% (vs Jun 2025 $920.96B)
- 9 consecutive months of growth, continuously setting new records
- Margin Debt / GDP = 4.1% (historical median 1.5%)
- Investor credit balance at -$1.06T (new low) — investors owe more than they hold in cash
Assessment: 🔴 Severe caution. Margin debt growing at ~10% per month, leverage levels exceeding 2000 and 2007 bubble peaks (relative to GDP and M2). A 5-10% market pullback could amplify selling pressure via margin calls, creating a deleveraging cascade.
4. IPO Volume & Fund Flows
| Indicator | Value | Status |
|---|---|---|
| 2026 YTD IPOs | ~73 | 🟡 Moderate |
| ETF H1 2026 Net Inflows | $1 Trillion | 🔴 Record |
| ETF Full-Year Forecast | $2.3 Trillion | 🔴 Will set record |
| Total ETF Assets | $15.8 Trillion | All-time high |
Trend:
- H1 2026 ETF inflows of $1T, nearly double YoY, setting a new half-year record
- Equity ETFs contributed $680B, bond ETFs $300B
- Rolling 12-month inflows already at $2T; State Street projects $2.3T for the full year
- IPO count relatively moderate (73), but passive capital continues flooding in via ETFs
Assessment: 🔴 Record fund inflows. Passive capital mechanically pushing up mega-cap stocks, consistent with the breadth fear divergence. This “passive vacuum” pattern would equally accelerate selling if flows reverse.
Comprehensive Assessment
| Category | Green 🟢 | Yellow 🟡 | Red 🔴 |
|---|---|---|---|
| Credit Spreads | 2 | 0 | 0 |
| Yield Curve | 1 | 0 | 0 |
| Margin Debt | 0 | 0 | 1 |
| IPO/Fund Flows | 0 | 1 | 1 |
| Total | 3 | 1 | 2 |
Summary:
Credit spreads and yield curve remain calm — this is “calm on the surface.” Beneath the surface, margin debt at $1.502T is expanding at 10% monthly, ETF capital is flooding in at record pace, and the FNG structural divergence (extreme momentum greed vs. breadth fear) all point to one picture: the market is driven by liquidity, not breadth.
The 3-green, 2-red combination appears moderate, but the two red lights are precisely the most critical systemic risk indicators — leverage and capital flows. Credit spreads are a lagging indicator; once HY OAS begins widening, it’s typically confirmation rather than a leading signal. Key watchpoints: 1) whether margin debt growth decelerates; 2) whether ETF inflows reverse; 3) whether price breadth can repair.
Data sources: CNN Fear & Greed Index, FRED (BAMLH0A0HYM2, BAMLC0A4CBBB, T10Y2Y, DGS10, DGS2, DGS30), FINRA Margin Statistics, State Street ETF Flows Generated: 2026-08-05 06:30 CST