CNN Fear & Greed Sentiment Analysis 2026-08-04
Composite at 45.83 (neutral), continuing its rebound from 42.46. Among 7 sub-indicators: 2 greed, 2 neutral, 3 fear. Breadth and strength indicators diverge negatively from index momentum. On crisis signals, credit spreads and yield curve remain normal, but FINRA margin debt hits a record $1.502T, IPO and ETF inflows both at all-time highs — leverage and fund flow red flags.
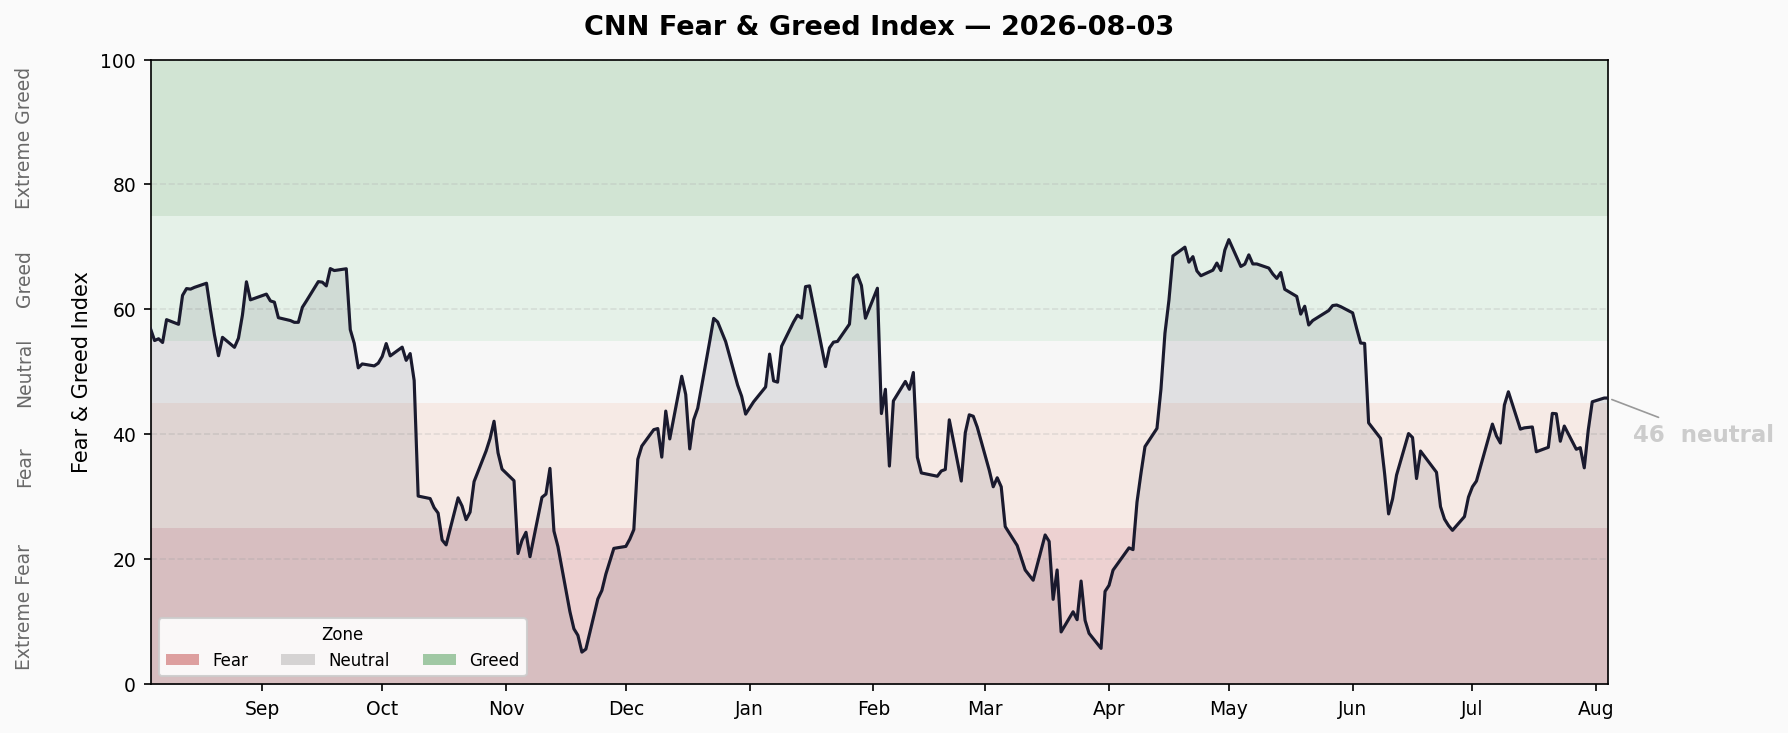
Composite Index Trend
Latest Score: 45.83 (Neutral) | Previous Close: 42.46 (Fear) | Daily Change: +3.37
| Timeframe | Score | Rating | Change |
|---|---|---|---|
| Current | 45.83 | Neutral | +3.37 |
| 1 week ago | 37.63 | Fear | +8.20 |
| 1 month ago | 32.54 | Fear | +13.29 |
| 1 year ago | 49.80 | Neutral | -3.97 |
Last 10 Trading Days:
- Jul 21: 43.37 (Fear)
- Jul 22: 43.31 (Fear)
- Jul 23: 38.91 (Fear)
- Jul 24: 41.34 (Fear)
- Jul 27: 37.63 (Fear)
- Jul 28: 37.89 (Fear)
- Jul 29: 34.66 (Fear, cycle low)
- Jul 30: 40.71 (Fear)
- Jul 31: 45.23 (Neutral)
- Aug 3: 45.83 (Neutral)
FNG lingered in the fear zone through late July, bottoming at 34.66 on Jul 29 before rebounding for three consecutive sessions. Now entering neutral territory, but at 45.83 it sits in the lower half of the neutral range — still 9 points away from greed territory (55+).
7 Sub-Indicators Scan
| Indicator | Score | Rating | Raw Value | Direction |
|---|---|---|---|---|
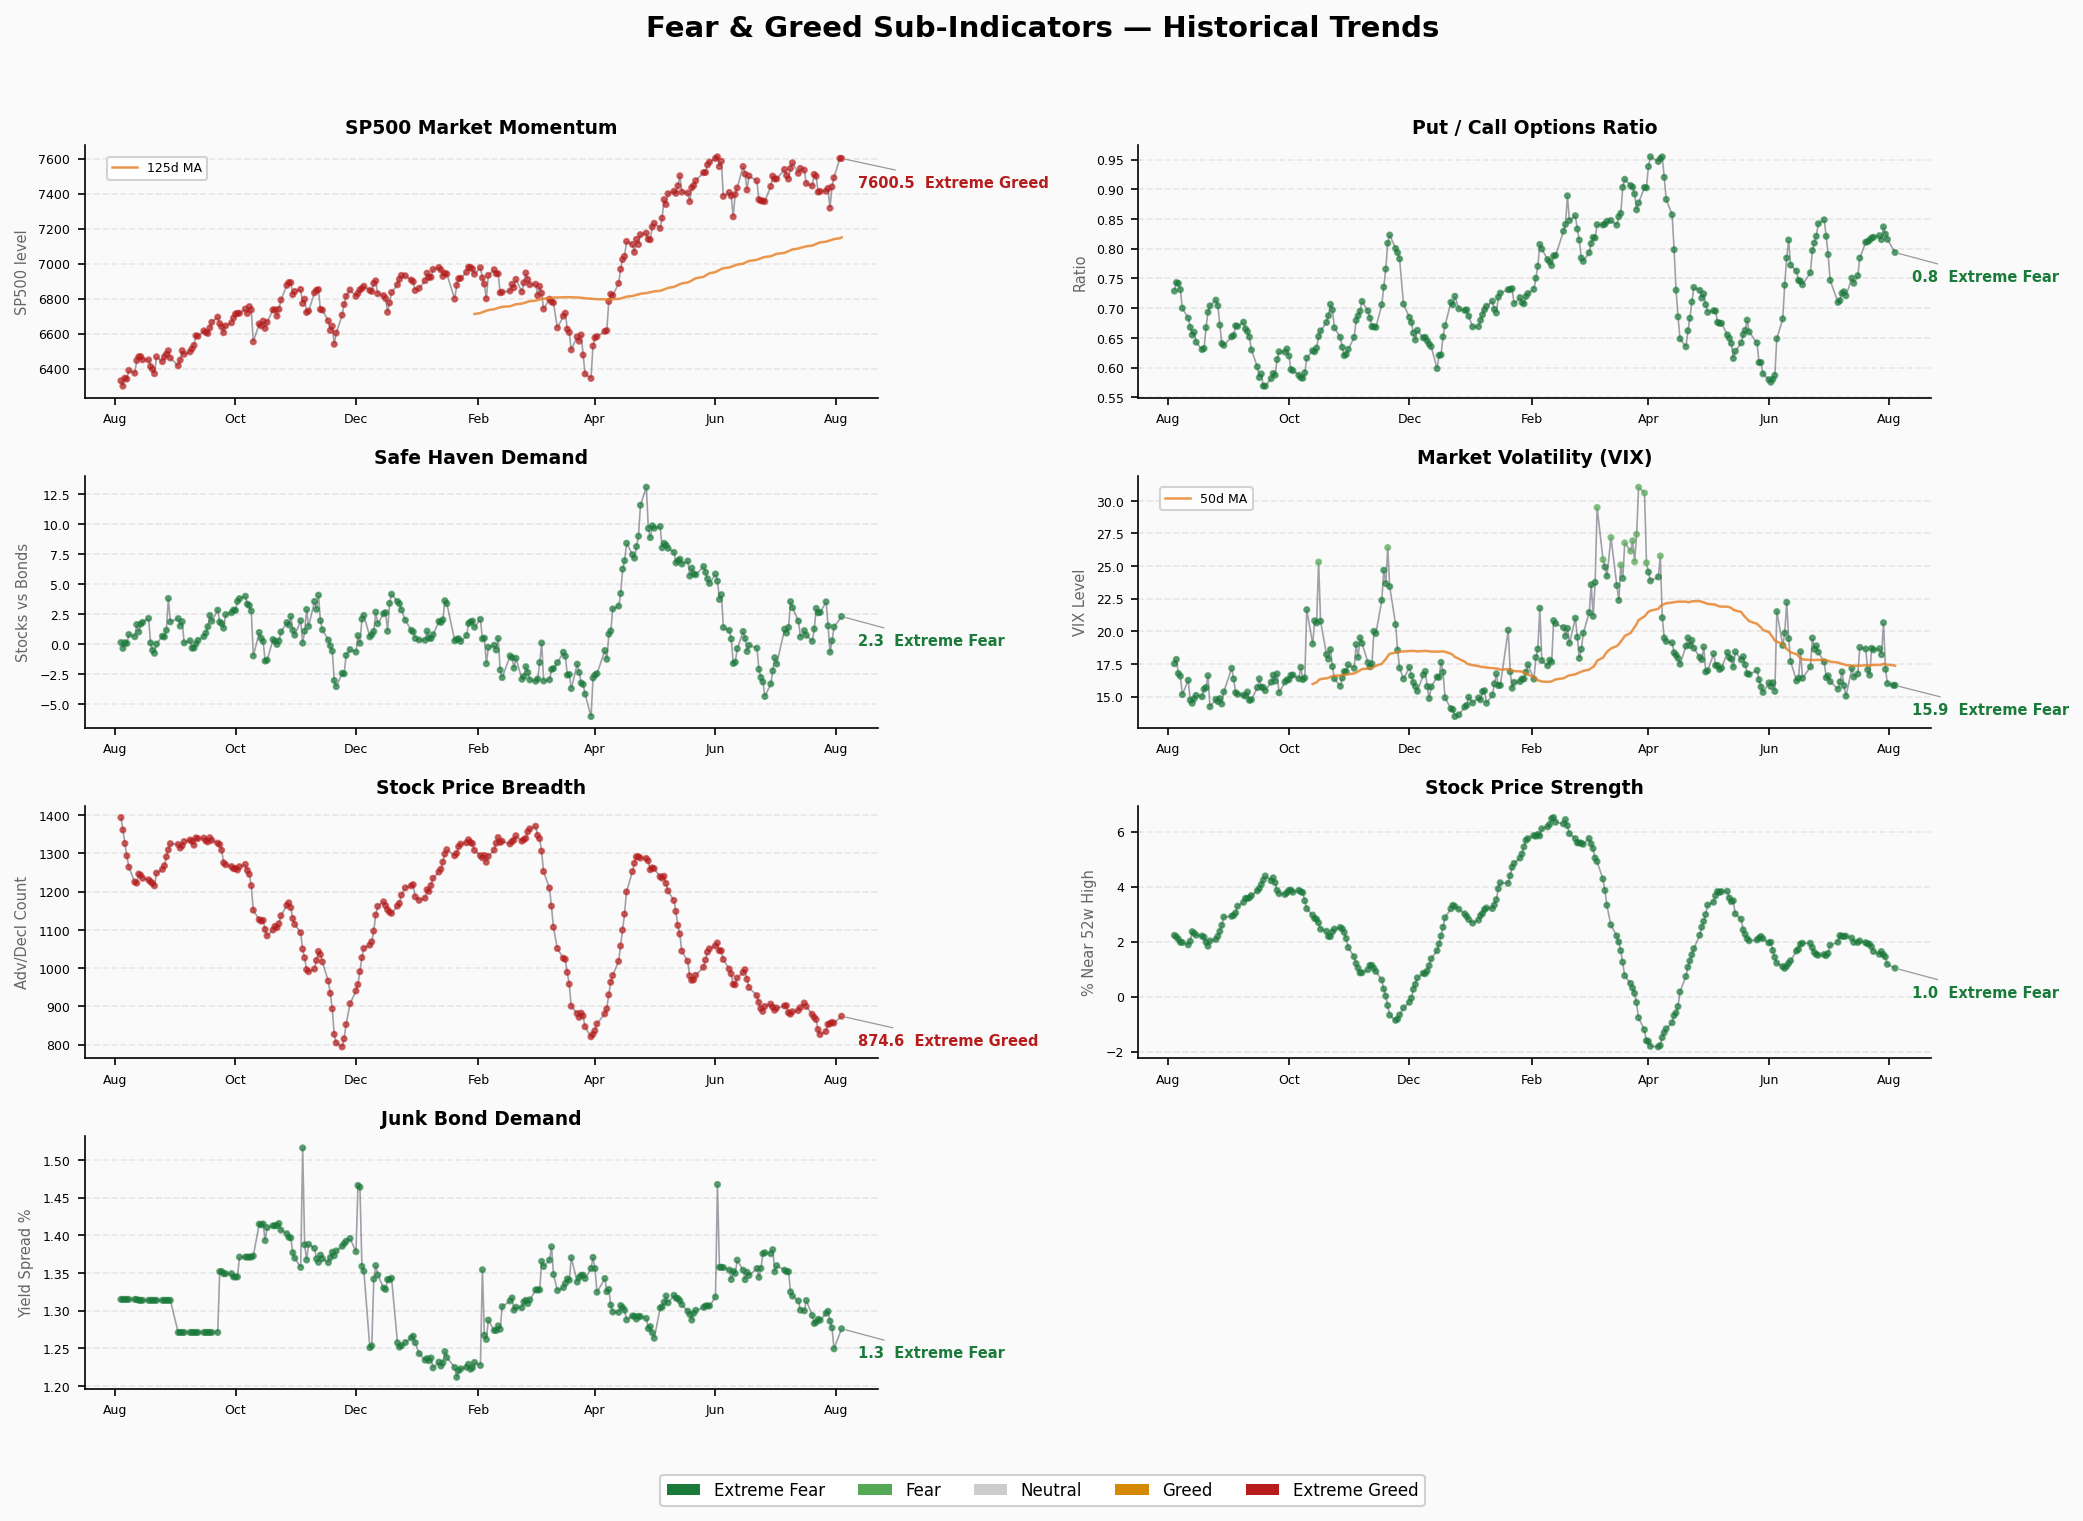
| Market Momentum (S&P 500 vs 125-day MA) | 48.8 | Neutral | 7600.5 | ↑ |
| Stock Price Strength (New Highs/Lows) | 29.2 | Fear | 1.04 | ↓ |
| Stock Price Breadth (Adv/Decl) | 26.4 | Fear | 874.59 | ↑ |
| Put/Call Options Ratio | 37.4 | Fear | 0.79 | ↓ |
| Market Volatility (VIX) | 50.0 | Neutral | 15.86 | → |
| Safe Haven Demand (Stocks vs Bonds) | 59.0 | Greed | 2.33 | ↑ |
| Junk Bond Demand (HY OAS) | 70.0 | Greed | 1.28% | ↓ |
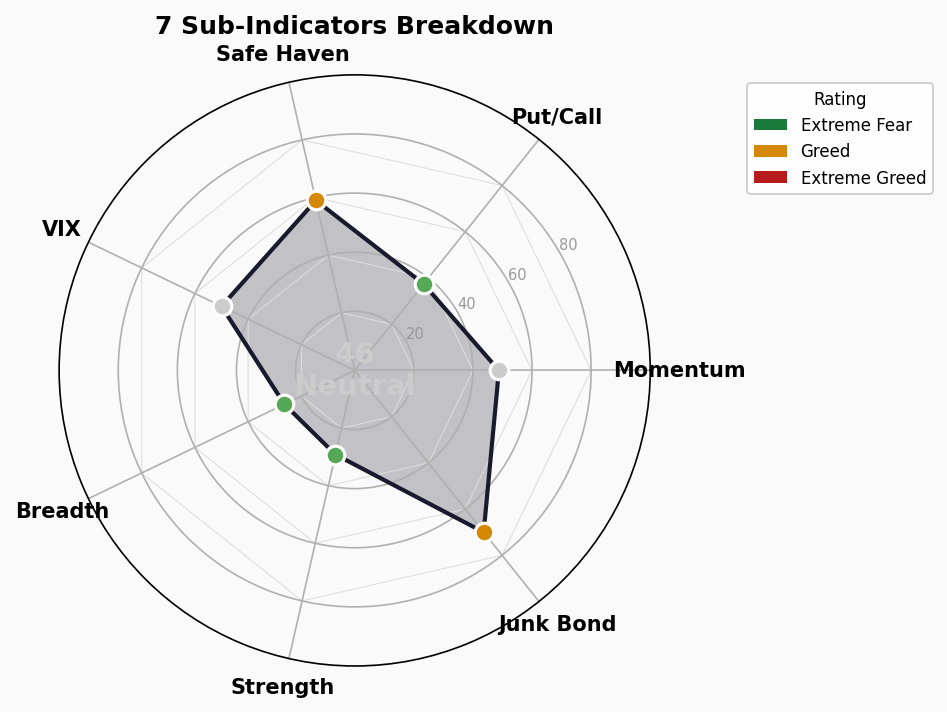
Distribution: 2 Greed / 2 Neutral / 3 Fear
Sub-Indicator Breakdown
Market Momentum (48.8, Neutral): S&P 500 at 7600.5, approximately 6.4% above its 125-day moving average. The index rebounded from a Jul 29 low of 7316 to 7600, a 3.9% three-day gain. Momentum is recovering but has not yet reached greed territory.
Stock Price Strength (29.2, Fear): New highs/new lows ratio at just 1.04 — barely above breakeven but firmly in the fear zone. Very few stocks are hitting new highs, with gains concentrated in a handful of large-cap names. The indicator deteriorated from 1.18 to 1.04, continuing its downward trend.
Stock Price Breadth (26.4, Fear): Advance/decline indicator at 874.59, improved from 856.63 the prior day but still deep in fear territory. Market participation remains narrow, with limited breadth behind the rally.
Put/Call Options (37.4, Fear): P/C ratio at 0.79, below 1.0 indicates slightly more call buying than put buying, yet CNN scores this in the fear zone. Investors remain actively hedging — options market sentiment is cautious.
Market Volatility — VIX (50.0, Neutral): VIX at 15.86, historically low. Low VIX is typically read as market complacency, but CNN rates it neutral, suggesting that relative to its historical distribution, the current VIX level is within a normal range.
Safe Haven Demand (59.0, Greed): Stock-bond return spread at 2.33, indicating capital flowing from bonds into equities. Risk appetite is rising, up from 1.44 the prior day.
Junk Bond Demand (70.0, Greed): HY OAS at 1.28%, credit spreads remain tight, reflecting strong demand for high-yield debt. Spreads widened slightly by 3bp from 1.25, worth monitoring.
Structural Contradictions
1. Breadth vs. Momentum Divergence ⚠️
Market momentum scores 48.8 (neutral) while stock price breadth (26.4) and strength (29.2) lag severely in fear territory. S&P 500 sits at 7600.5, yet very few stocks are making new highs — gains are concentrated in mega-cap names. This “strong index, weak internals” pattern typically appears late in a rally or ahead of a correction.
2. Options Caution vs. Credit Appetite Divergence
Put/Call ratio at 37.4 (fear) shows options investors actively hedging, while junk bond demand at 70 (greed) and safe haven demand at 59 (greed) show risk-on appetite in fixed income. Options market caution contrasts with credit market optimism — credit markets typically signal systemic risk first.
3. No Extreme Readings
None of the 7 sub-indicators are in extreme territory (>80 greed or <20 fear). Overall sentiment is in a “mild fear → neutral” transition. The absence of extremes means a sharp mean-reversion reversal is unlikely in the near term, but there is also no clear directional signal.
Trend Assessment
Duration in Range: FNG spent approximately two weeks in the fear zone (<40) from mid-July through end of July, bottoming at 34.66 on Jul 29 before rebounding. Currently only the 2nd trading day in neutral territory — trend reversal is not yet confirmed.
Turning Indicators:
- ✅ Three consecutive gains (Jul 30 +6.05, Jul 31 +4.52, Aug 3 +0.60), clear rebound momentum
- ✅ Fear → Neutral crossover achieved
- ⚠️ Breadth (26.4) and strength (29.2) remain in fear zone, could drag the composite lower
- ⚠️ At 45.83, the index is in the lower half of neutral, still 9 points from greed (55+)
Key Watch: If breadth and strength indicators fail to recover above 40 within the next 3-5 trading days, the composite may slip back into fear. Conversely, if breadth improves alongside sustained momentum, the rebound can continue.
🚨 Crisis Signal Dashboard
1. Credit Spreads
- High Yield OAS: 2.84% | 🟢 Normal
- Investment Grade OAS: 0.80% | 🟢 Normal
- Trend: Stable. HY OAS remains below the 3% threshold — credit markets show no stress
- Thresholds: <3% Normal | 3-5% Warning | 5-8% Panic | >8% Crisis
2. Yield Curve
- 10Y-2Y Spread: +45bp | 🟢 Normal (slightly flat)
- 10Y: 4.75% | 2Y: 4.28% | 30Y: 5.27%
- 10Y-30Y: -52bp (long-end inverted,值得关注)
- Trend: Short-end spread has normalized, but the 30Y-10Y inversion at -52bp suggests skepticism about long-term growth
3. Margin Debt
- FINRA Margin Debt: $1.502T (June 2026) | 🔴 Record High
- MoM: $1.416T (May) → $1.502T (Jun), +$86.5B (+6.1% MoM)
- YoY: +49.0% YoY (from $1.008T, Jun 2025)
- GDP Ratio: ~4.1% (50-year median: 1.5%)
- Assessment: Leverage at historic extremes. Nine consecutive monthly increases, surging growth rate. If the market turns, forced liquidations could trigger a cascading sell-off
4. IPO Market
- 2026 YTD: 93 IPOs
- Q2 2026: 48 IPOs raising $104.8B (record)
- Q1 2026: 34 IPOs raising $9.9B
- Highlight: SpaceX IPO raised $75B — more than all US IPOs in the prior two years combined
- Assessment: IPO market running extremely hot, primary market valuation bubble risk rising
5. Fund Flows
- H1 2026 ETF Net Inflows: $1 trillion (record, +86% YoY)
- Full-Year Forecast: $2.3 trillion (vs. $1.5 trillion in 2025)
- Equity ETFs: $680B | Bond ETFs: $300B | EM ETFs: $38B
- Assessment: Record-breaking inflows signal abundant liquidity, but also mean substantial capital is already positioned in the market
Overall Assessment: 2🟢 / 0🟡 / 3🔴
Credit spreads and the yield curve remain normal — no systemic credit risk signal yet. However, FINRA margin debt at a record $1.502T (+49% YoY), IPO market setting single-quarter fundraising records driven by SpaceX, and ETF inflows reaching $1 trillion in H1 — three red lights on leverage and fund flows indicate the market is in a high-risk-appetite euphoric state.
Risk logic: The credit market is the last line of defense. If HY OAS begins widening from 2.84% and breaks above 3%, combined with $1.5T in leverage, forced-deleveraging-driven declines would be far more severe than a normal pullback. The FNG composite at just 45.83 (neutral) shows sentiment is not excessively optimistic — this contrasts sharply with the extreme leverage profile. Sentiment is mild but leverage is at historic highs: this “hidden leverage” dynamic warrants close vigilance.