CNN Fear & Greed Sentiment Analysis 2026-08-03
FNG composite at 42.5 (Fear), up +3.6 from previous close. Past 10 days consistently in Fear zone. Key divergence: Junk Bond Demand (75.2, Extreme Greed) vs Stock Price Breadth (22.6, Extreme Fear) — a 52-point structural gap. Crisis signals: Credit spreads and yield curve normal, but FINRA margin debt at record $1.50T (+51.5% YoY), ETF flows at record pace.
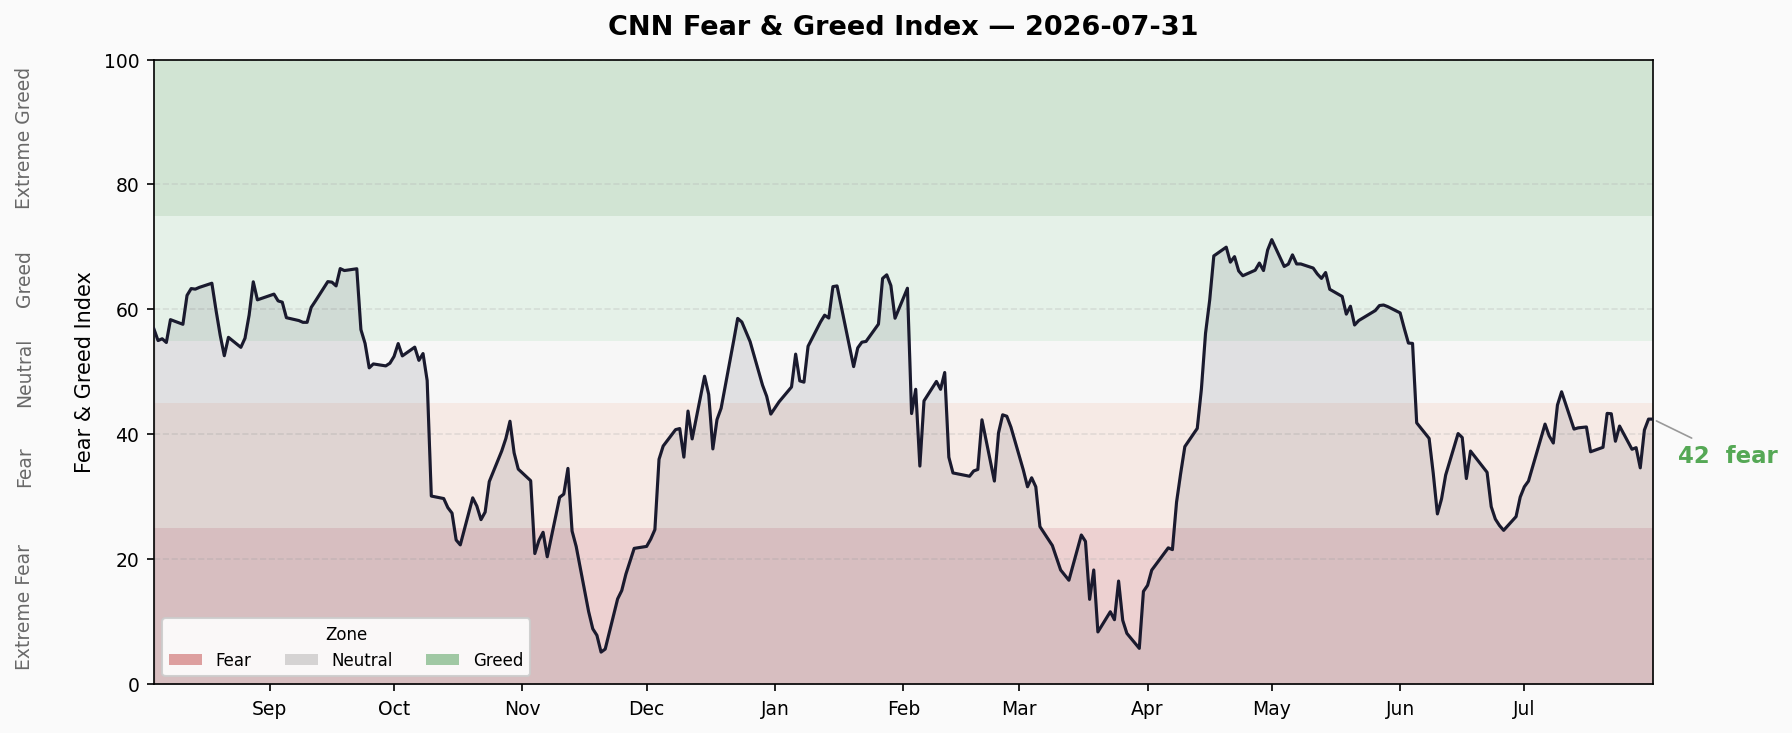
Composite Index Trend
Latest Reading: 42.5 — Fear
| Timeframe | Score | Rating | Change |
|---|---|---|---|
| Current | 42.5 | Fear | — |
| Previous Close | 38.9 | Fear | +3.6 |
| 1 Week Ago | 41.3 | Fear | +1.2 |
| 1 Month Ago | 30.0 | Fear | +12.5 |
| 1 Year Ago | 63.7 | Greed | -21.2 |
10-Day Trend:
| Date | Score | Rating |
|---|---|---|
| 7/21 | 43.4 | Fear |
| 7/22 | 43.3 | Fear |
| 7/23 | 38.9 | Fear |
| 7/24 | 41.3 | Fear |
| 7/27 | 37.6 | Fear |
| 7/28 | 37.9 | Fear |
| 7/29 | 34.7 | Fear |
| 7/30 | 40.7 | Fear |
| 7/31 | 42.5 | Fear |
Trend Direction: The composite has remained in the Fear zone for 10 consecutive trading days. A V-shaped recovery from 34.7 (Jul 29 low) to 42.5 (Jul 31) shows improving momentum. Monthly change of +12.5 points marks a significant recovery from deep fear levels, though still well below last year’s Greed territory.
Seven Sub-Indicators Scan
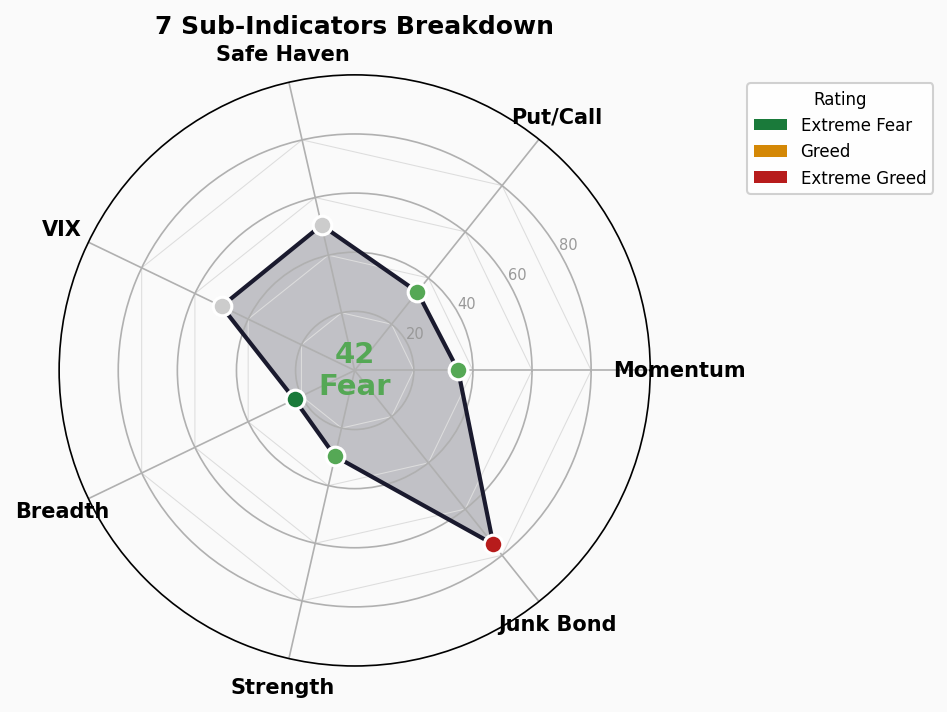
| # | Indicator | Score | Rating | Raw Value | Direction |
|---|---|---|---|---|---|
| 1 | Market Momentum (S&P 500) | 35 | 😨 Fear | S&P 7,489.72 vs 125-day MA | ↑ Recovering |
| 2 | Stock Price Strength | 29.8 | 😨 Fear | NH/NL = 1.18 | ↓ Deteriorating |
| 3 | Stock Price Breadth | 22.6 | 😱 Extreme Fear | Adv/Dec Vol ratio low | → Stable, low |
| 4 | Put/Call Options | 34 | 😨 Fear | P/C = 0.82 | ↗ Improving |
| 5 | Market Volatility (VIX) | 50 | 😐 Neutral | VIX = 16.0 | ↗ Easing |
| 6 | Junk Bond Demand | 75.2 | 🤑 Extreme Greed | HY Spread tightening | ↑ More greedy |
| 7 | Safe Haven Demand | 50.4 | 😐 Neutral | Stock/Bond ≈ 1.43 | → Neutral |
Detailed Analysis:
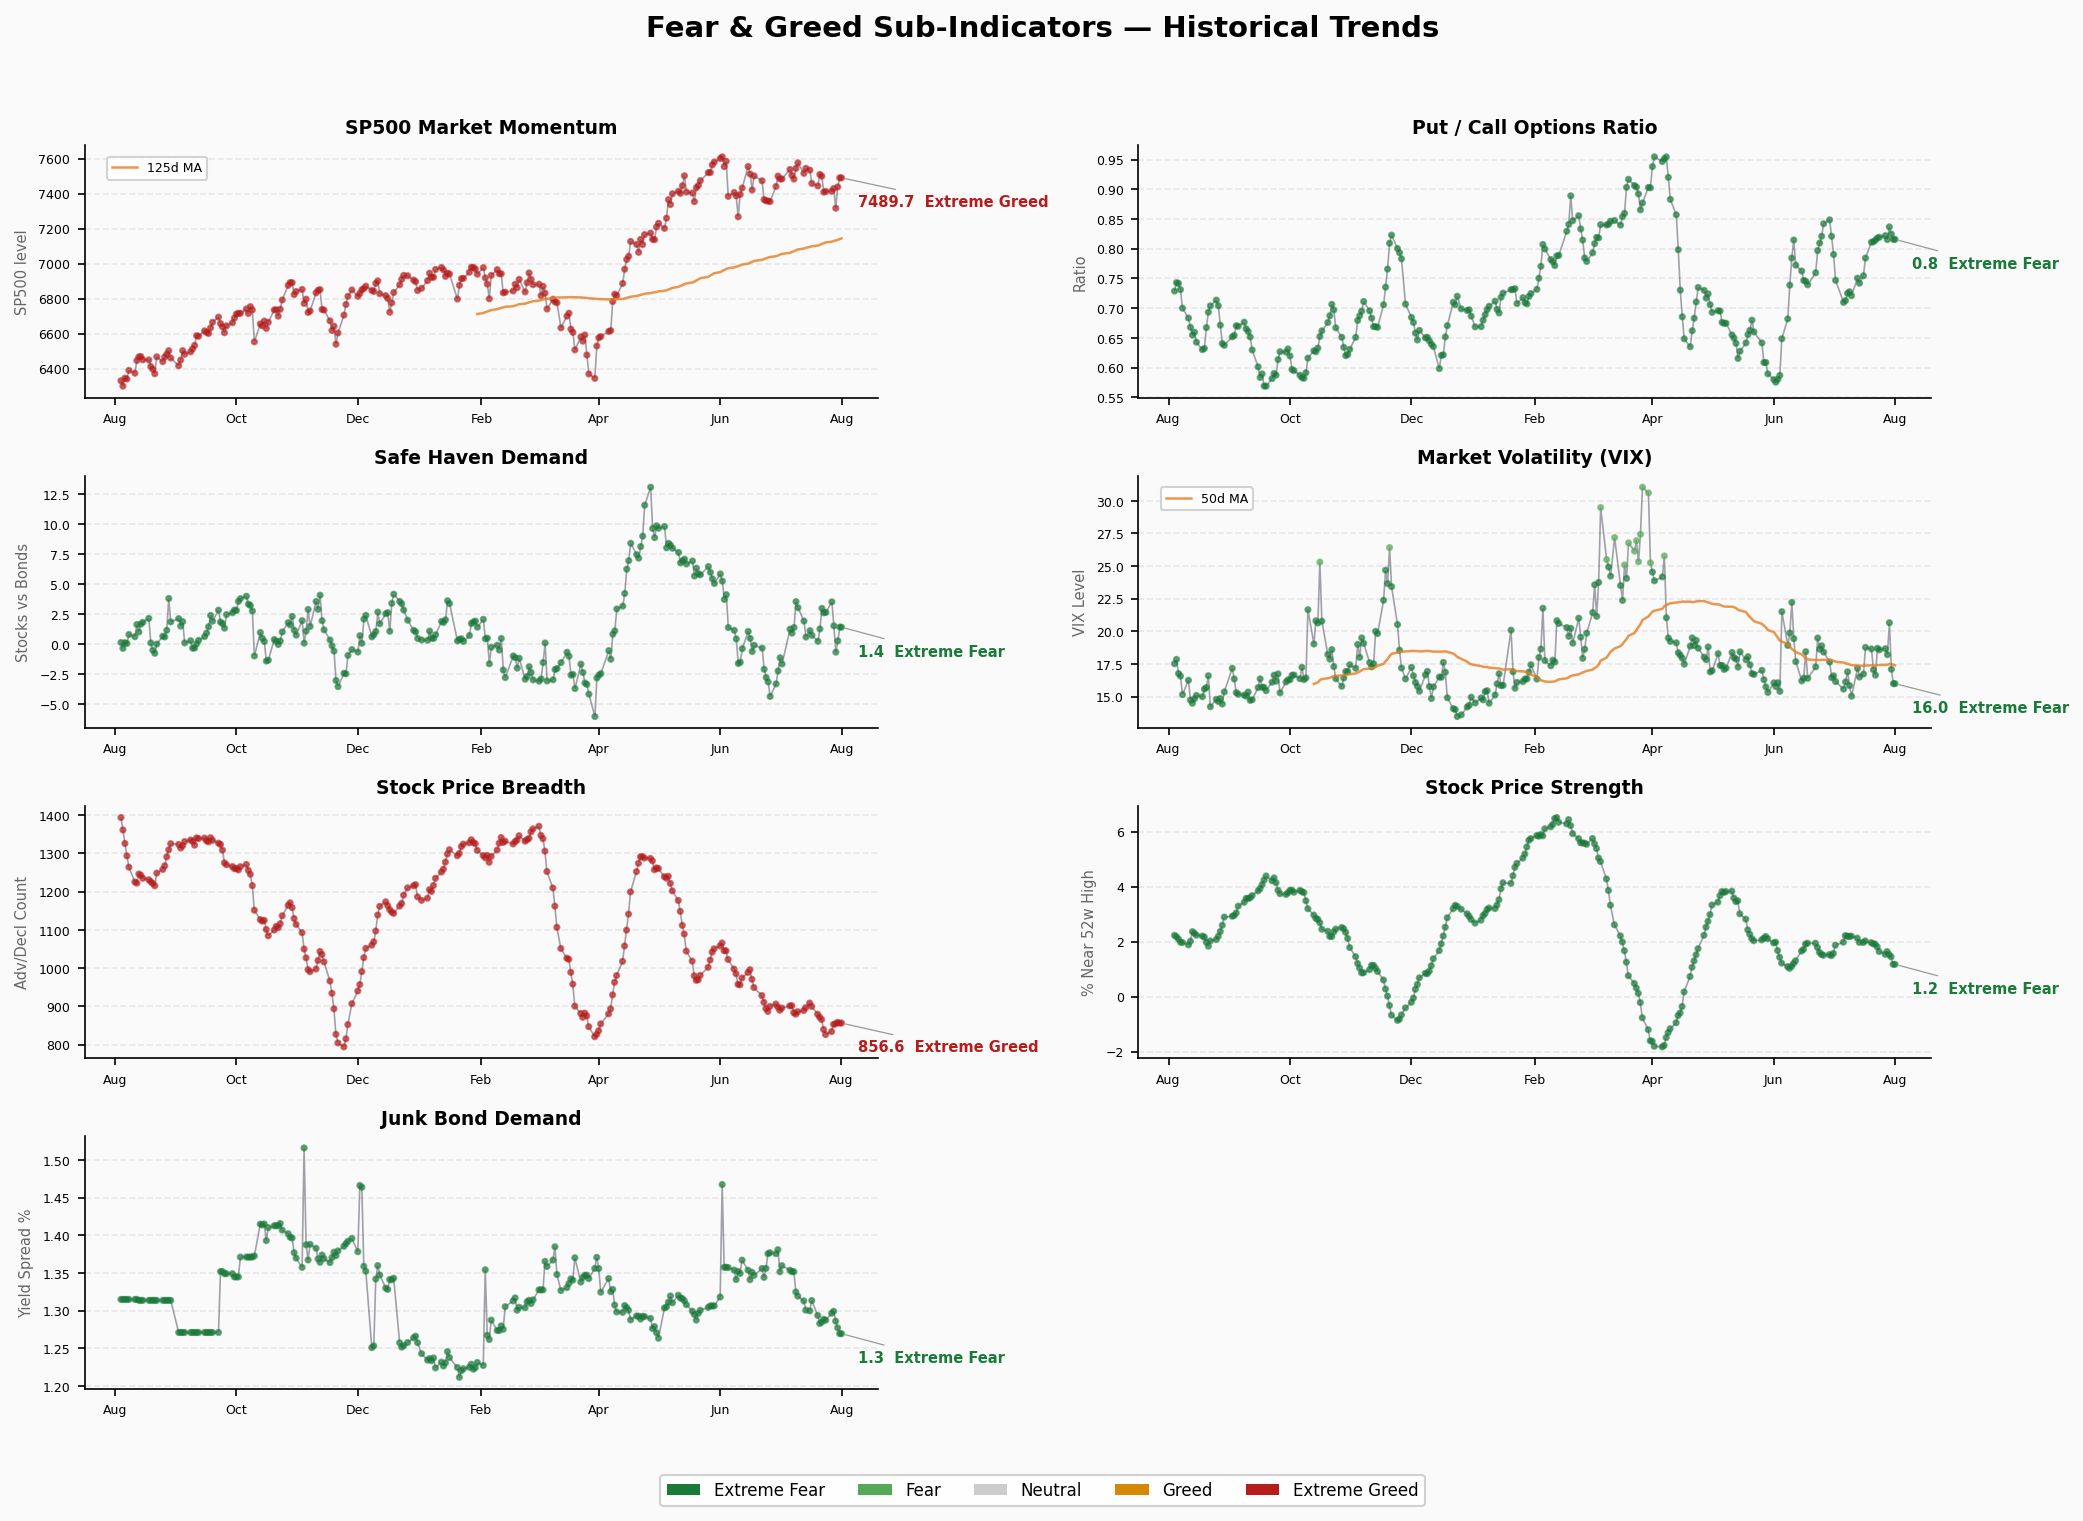
- Market Momentum — S&P 500 at 7,489.72, still above the 125-day moving average, but momentum score of 35 (Fear) indicates deceleration relative to the moving average. Trend recovering.
- Stock Price Strength — New highs/new lows ratio dropped to 1.18, deteriorating from 1.64. Fewer stocks making new highs suggests narrowing market leadership.
- Stock Price Breadth — Advance/decline volume ratio at extreme fear levels (22.6), the weakest sub-indicator. Persistent breadth weakness implies the rally is concentrated in a handful of large-cap names.
- Put/Call Options — P/C ratio at 0.82, in fear territory. Options traders are buying puts for hedging, though the ratio has declined slightly from 0.84, indicating reduced hedging demand.
- Market Volatility (VIX) — VIX at 16.0, neutral zone. Surface volatility is calm, but this masks deteriorating breadth underneath.
- Junk Bond Demand — High yield spreads continuing to tighten, score 75.2 (Extreme Greed). Investors are reaching for yield; credit markets are not pricing recession risk.
- Safe Haven Demand — Stock/bond demand ratio at 1.43, near neutral. Safe haven demand is balanced.
Structural Contradiction Analysis
Core Contradiction: Junk Bond Extreme Greed vs Stock Breadth Extreme Fear
Junk Bond Demand (75.2) and Stock Price Breadth (22.6) form a 52.6-point extreme divergence — the most pronounced structural contradiction currently:
- Credit markets are pricing a “no recession” environment with aggressive yield-seeking
- But stock market internals are severely deteriorating, with gains concentrated in mega-caps
- This divergence typically appears at market tops: the surface index stays strong while internals diverge
Secondary Contradiction: Calm VIX vs Rising Put Hedging
- VIX at 16.0 is neutral, surface volatility suppressed
- But Put/Call ratio at 0.82 (Fear) shows options traders increasing hedges
- VIX “calm” may understate tail risk
No extreme values (>80 or <20) triggered, but watch:
- Stock Price Breadth (22.6) approaching the <20 extreme fear threshold
- Junk Bond Demand (75.2) nearing the >80 extreme greed threshold
Trend Assessment
Zone Duration:
- Composite has been in the Fear zone (25-44) for 10 consecutive trading days
- Last Neutral reading was in mid-July (~50)
- 1 month ago hit 30.0 (deep fear), now recovered to 42.5
Turning Indicators:
- ✅ V-shaped recovery: Jul 29 low of 34.7 → Jul 31 at 42.5, +7.8 points in 3 days
- ✅ Monthly change +12.5 points, meaningful recovery
- ⚠️ 4 of 7 sub-indicators still in Fear, 2 Neutral, only 1 Extreme Greed
- ⚠️ Stock Price Strength continues to deteriorate, no inflection point yet
- ⚠️ Stock Price Breadth still hugging the extreme fear line
Key Levels:
- Upside: 45 (Neutral boundary) — needs +2.5 more points
- Downside: 25 (Extreme Fear boundary) — 17.5 points away
Assessment: Short-term bounce is credible but fragile. Breadth weakness and deteriorating price strength are hidden risks. If Junk Bond Demand starts declining (credit spreads widening), it could confirm a risk appetite shift. Conversely, if Breadth and Strength indicators improve in tandem, the recovery can be sustained.
🚨 Crisis Precursor Dashboard
1. Credit Spreads
- HY OAS: 2.84% | 🟢 Normal (Thresholds: <3% normal | 3-5% caution | 5-8% panic | >8% crisis)
- IG OAS: 0.80% | 🟢 Normal (Thresholds: <1% normal | 1-2% caution | >2% panic)
- Trend: Stable, data as of 2026-07-30 (FRED)
2. Yield Curve
- 10Y-2Y Spread: +47bp | 🟢 Normal/Flat
- 10Y: 4.68% | 2Y: 4.23% | 30Y: 5.21%
- 10Y-30Y: -53bp (30Y above 10Y, normal upward slope at long end)
- Trend: Curve has normalized from inversion, short end easing
3. Margin Debt
- FINRA Margin Debt: $1.502T (June 2026) | 🔴 Record High
- MoM: +$87B (+6.2% from May’s $1.416T)
- YoY: +51.5% (vs $990.96B in June 2025)
- Trend: 3 consecutive months of record highs, leverage growth extremely rapid. Historical data shows negative average S&P 500 12-month forward returns after comparable growth rates
4. IPO Market
- 2026 YTD IPOs: 86 (Renaissance Capital)
- June: 19 IPOs (most active month)
- Q2 Highlight: SpaceX historic IPO
- Trend: IPO activity recovering but not yet at bubble levels
5. Fund Flows
- 2026 H1 ETF Inflows: >$1 trillion (record)
- Q2 alone: $550 billion (record quarter)
- June alone: $191 billion (2nd highest month on record)
- Full-year projection: $2.3 trillion (vs $1.5T in 2025)
- Trend: Fund flows continuing at record pace, passive ETFs dominating
Overall Assessment: 2🟢 / 0🟡 / 2🔴
Credit spreads and yield curve remain healthy, but margin debt and fund flows are at historic extremes. The combination of record leverage and record inflows are classic late-cycle bull market signals. Credit markets are currently not pricing recession risk — once HY OAS begins to widen, it will serve as the leading indicator for risk appetite shift.