CNN Fear & Greed Sentiment Analysis 2026-08-02
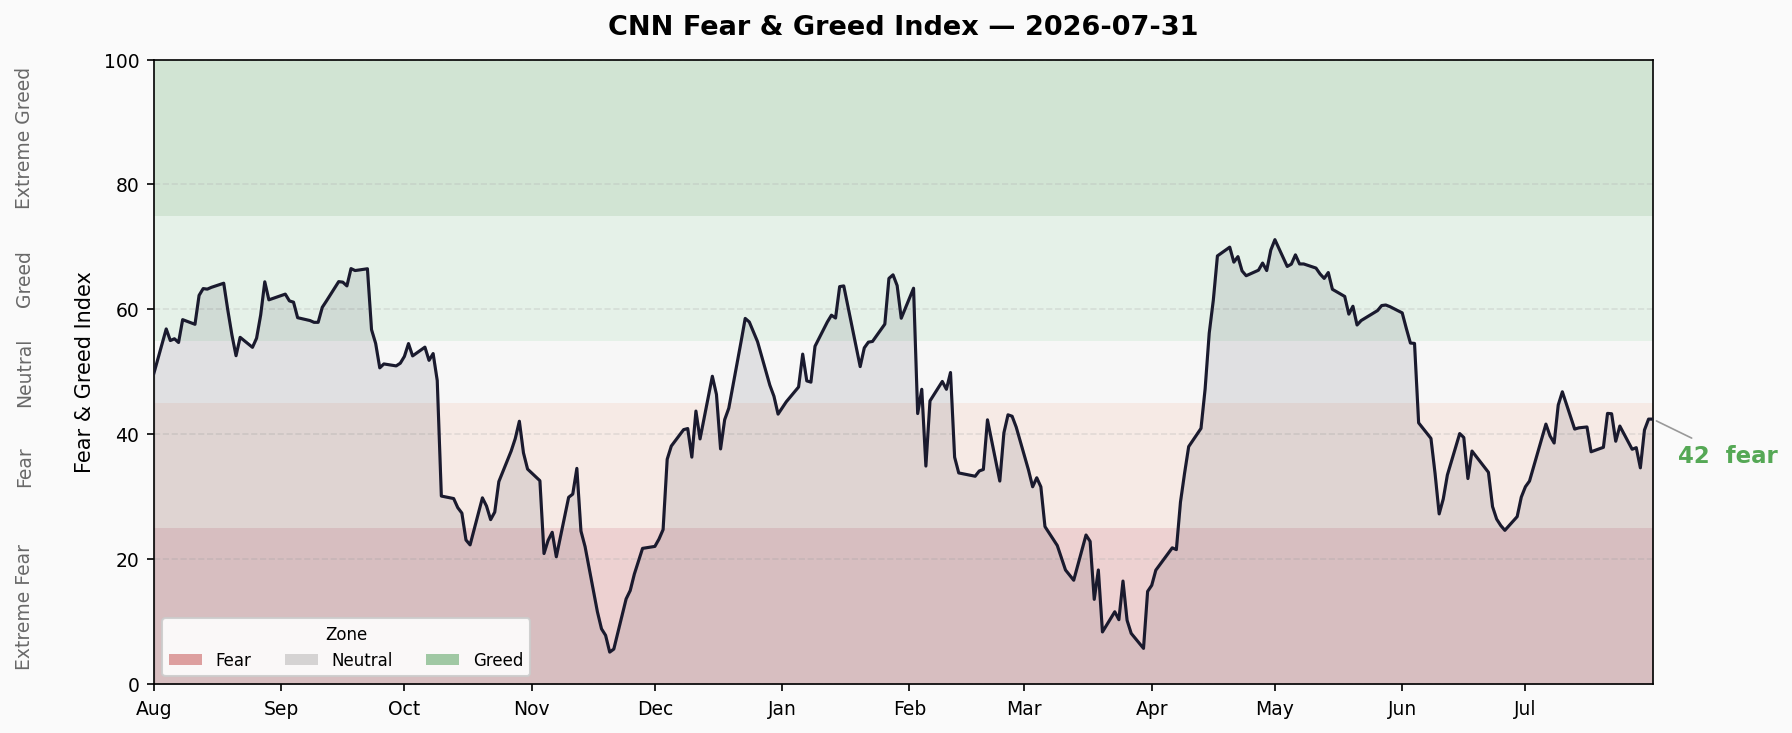
Overall index at 42.5 (Fear), stuck in fear zone for 10+ consecutive days. Severe structural divergence: Stock Price Breadth at extreme fear (22.6) while Junk Bond Demand at extreme greed (75.2). Crisis signals: FINRA margin debt hits record $1.502T, ETF inflows surpass $1T in H1 2026.
Overall Index
- Latest Score: 42.5 — Fear
- Previous Day: 42.5 (unchanged, +0.0)
- 10-Day Trend: Persistent fear zone
| Date | Score | Rating |
|---|---|---|
| 07/21 | 43.4 | Fear |
| 07/22 | 43.3 | Fear |
| 07/23 | 38.9 | Fear |
| 07/24 | 41.3 | Fear |
| 07/27 | 37.6 | Fear |
| 07/28 | 37.9 | Fear |
| 07/29 | 34.7 | Fear |
| 07/30 | 40.7 | Fear |
| 07/31 | 42.5 | Fear |
The composite index has been range-bound between 34.7 and 43.4, sitting in fear territory for 10 consecutive trading days. A trough at 34.7 on 7/29 was followed by a modest rebound to 42.5, but the recovery lacks conviction, failing to breach the 45 neutral threshold. Market sentiment remains cautious but has not entered extreme fear territory.
Seven Sub-Indicators Scan
| Indicator | Score | Rating | Raw Value | Daily Change |
|---|---|---|---|---|
| Market Momentum (S&P 500) | 35 | 😨 Fear | 7489.72 | ↑ +52.09 |
| Stock Price Strength | 29.8 | 😨 Fear | 1.18 | ↓ -0.27 |
| Stock Price Breadth | 22.6 | 😰 Extreme Fear | 856.63 | ↓ -1.86 |
| Put/Call Options | 34 | 😨 Fear | 0.82 | → Unchanged |
| Market Volatility (VIX) | 50 | 😐 Neutral | 15.99 | ↓ -1.10 |
| Junk Bond Demand | 75.2 | 🤑 Extreme Greed | 1.27% | ↓ -0.01 |
| Safe Haven Demand | 50.4 | 😐 Neutral | 1.43 | ↑ +1.13 |
Sub-Indicator Interpretation
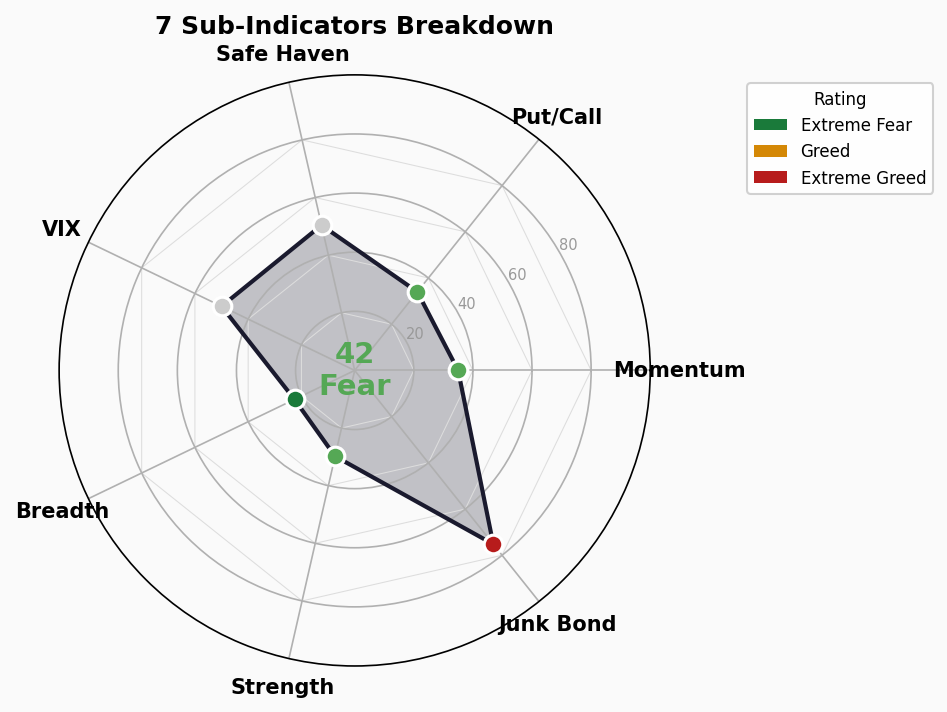
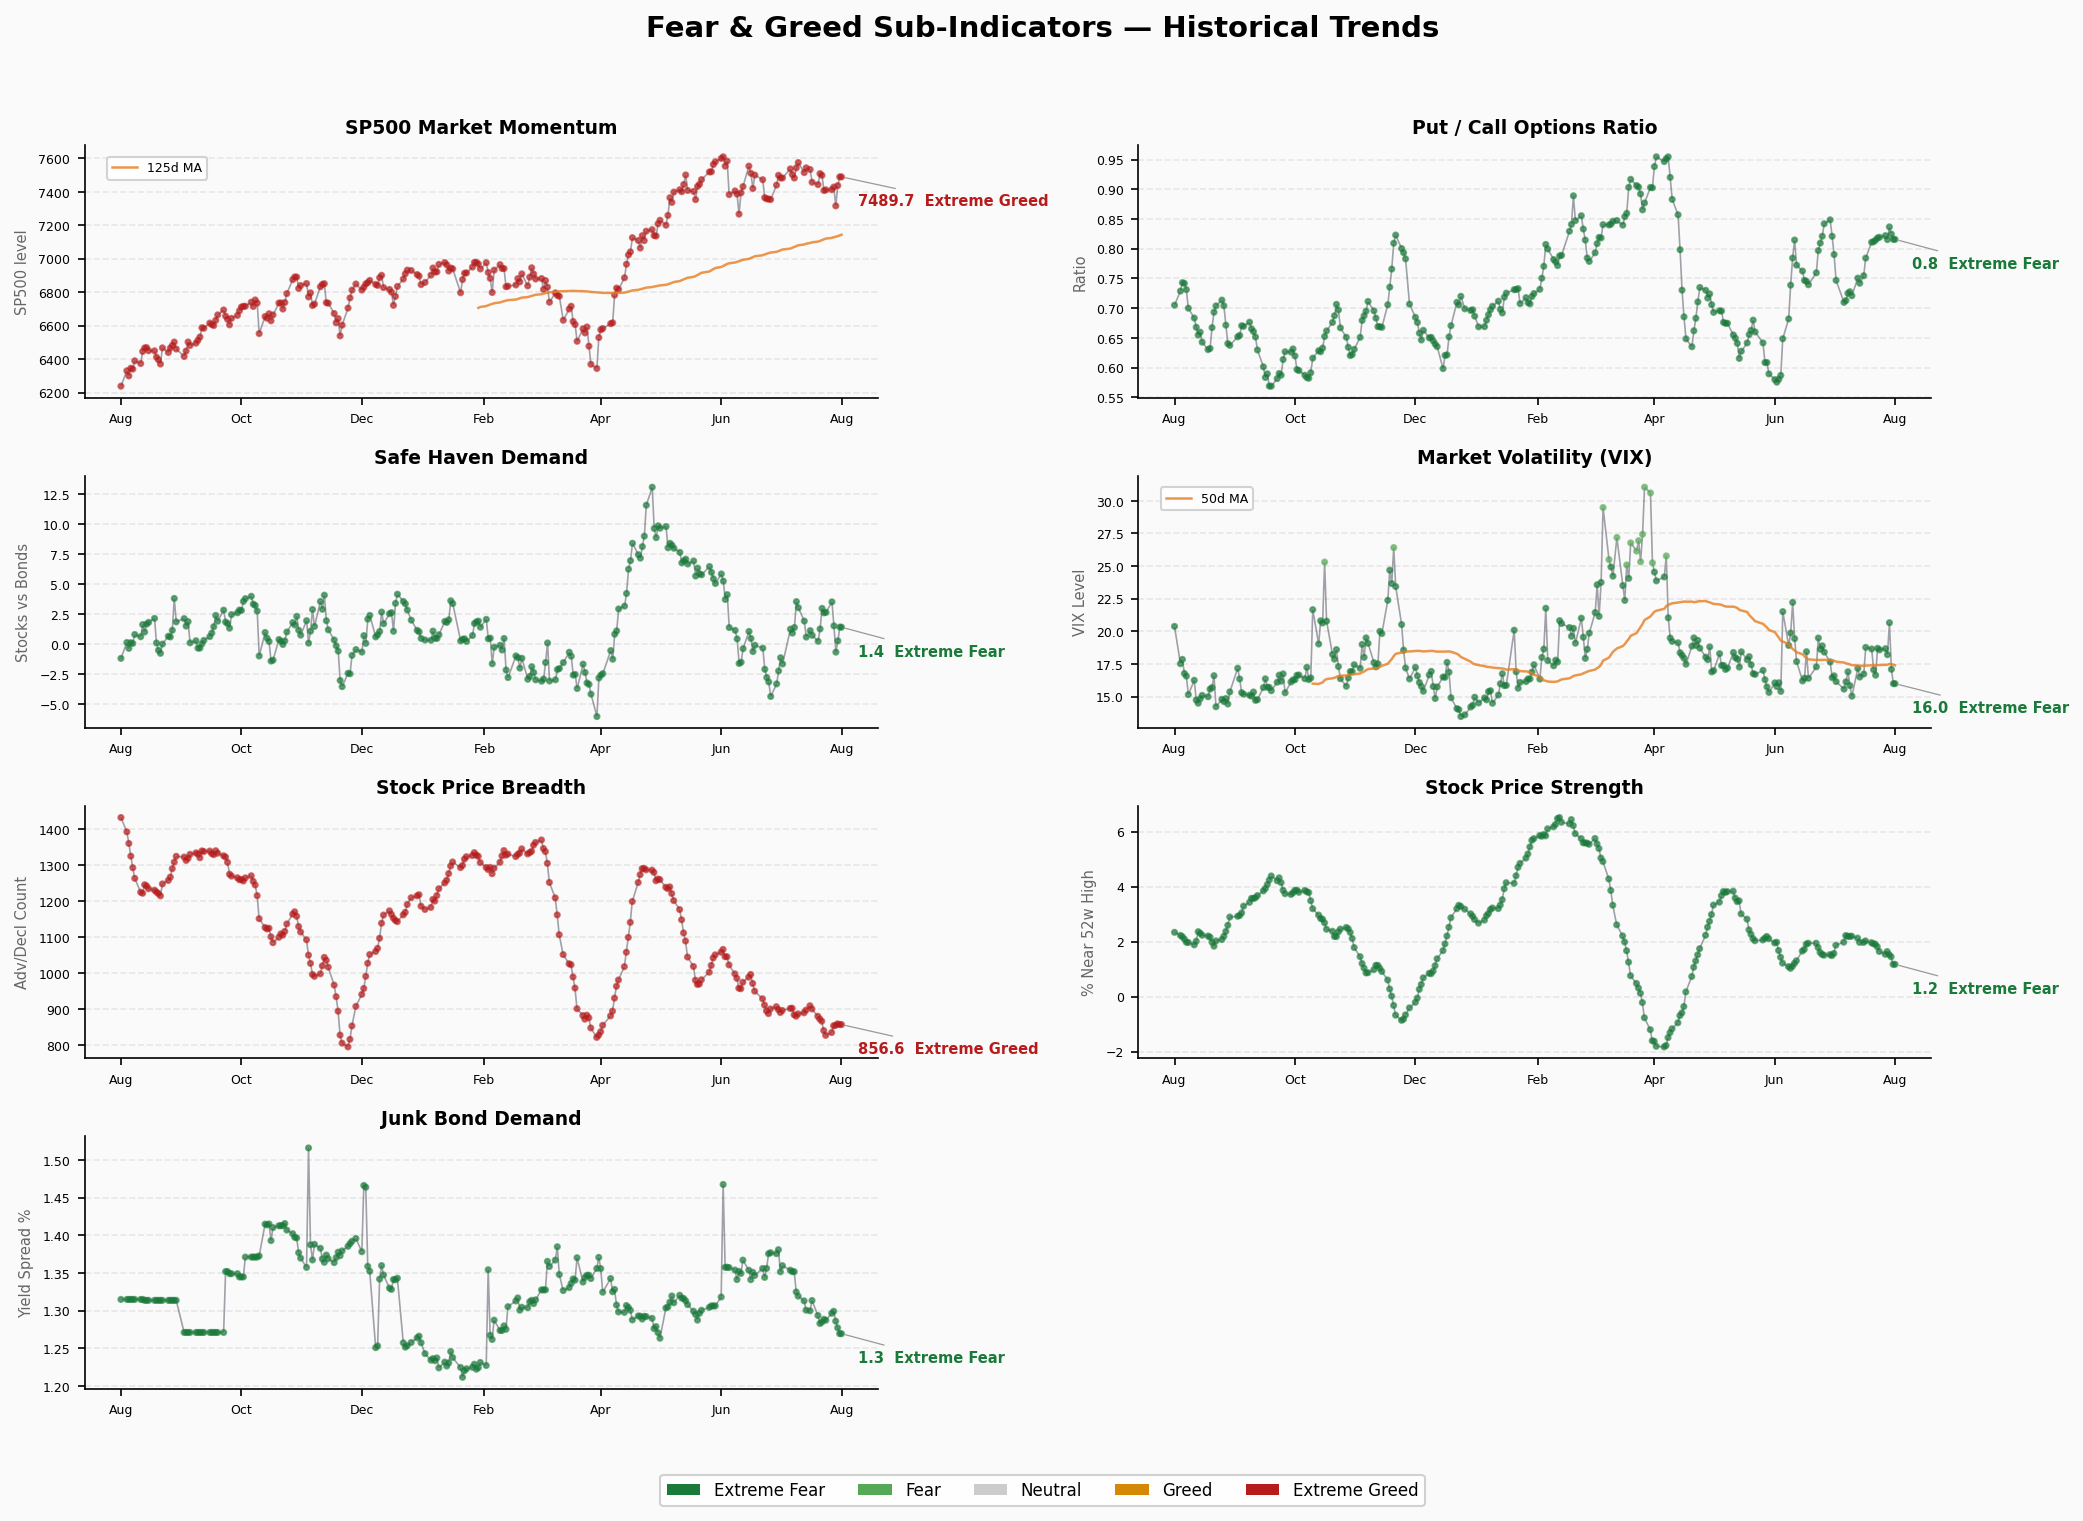
Market Momentum (S&P 500 vs 125-day MA) — S&P 500 at 7489.72, above the 125-day moving average but with insufficient momentum, scoring 35 (fear). The index holds above its medium-term average, but upside momentum is too weak to lift sentiment. Daily change +52 points shows marginal improvement.
Stock Price Strength (New Highs vs New Lows) — Score 29.8, fear zone. Only 1.18% of stocks are hitting 52-week highs, down -0.27 percentage points from the prior day. The market lacks broad-based breakout participation; most stocks remain stalled.
Stock Price Breadth (McClellan Oscillator) — Score 22.6, extreme fear. This is the weakest sub-indicator currently. McClellan Oscillator reading at 856.63, down -1.86 from the prior day. Market internal breadth continues to deteriorate. The number of advancing stocks is not expanding meaningfully, creating a severe mismatch between index performance and individual stock participation.
Put/Call Options — Score 34, fear zone. Put/Call ratio at 0.82, unchanged from the prior day. Options market participants remain defensive, with elevated demand for downside protection that shows no signs of abating.
Market Volatility (VIX) — Score 50, neutral. VIX at 15.99, down -1.10 from the prior day. Volatility is relatively low, with the market pricing in minimal near-term turbulence. The VIX calm contrasts sharply with deteriorating breadth — low volatility masking structural fragility beneath the surface.
Junk Bond Demand — Score 75.2, extreme greed. The strongest sub-indicator currently. The yield spread between junk bonds and investment-grade bonds is just 1.27%, tightening -0.01 from the prior day. Credit markets show zero pricing for risk, with spreads at rock-bottom levels and capital continuing to chase high-yield debt.
Safe Haven Demand — Score 50.4, neutral. The Treasury vs stock demand differential stands at 1.43, surging +1.13 from the prior day. Capital is beginning to trickle toward safe-haven assets, but not yet at trend-level magnitude.
Structural Contradiction Analysis
Core Contradiction: Breadth Extreme Fear vs Junk Bond Extreme Greed
The market currently exhibits a significant structural divergence:
- One end: Stock Price Breadth (22.6) in extreme fear — market participation is severely narrow, with index gains driven by a handful of mega-cap stocks
- Other end: Junk Bond Demand (75.2) in extreme greed — credit spreads extremely tight, with zero pricing for credit risk
This combination is historically uncommon. Typically, breadth deterioration transmits to credit markets first, but junk bond spreads remain extremely low, indicating that credit market “greed” has not yet been infected by equity “fear.” Once this lag closes, any adjustment could accelerate.
VIX Neutrality Illusion
VIX score at 50 (neutral) suggests surface-level calm. However, persistent breadth deterioration + low VIX = a classic “low volatility masking internal fragility” setup. When the protective bid on mega-cap stocks fades, corrections in a low-VIX environment tend to be more violent.
No Extreme Thresholds Triggered (>80 / <20)
No sub-indicator has breached >80 (extreme greed upper bound) or <20 (extreme fear lower bound). However, Stock Price Breadth at 22.6 is testing the edge. If breadth deteriorates further below 20, it could trigger a broader market panic signal.
Trend Assessment
- Duration in zone: The composite index has been in the fear zone (25-44) for 10+ consecutive days, with no effective sentiment repair
- Bottom formation: A trough at 34.7 on 7/29 was followed by two consecutive days of rebound to 42.5, showing a higher bottom, but limited recovery strength
- Reversal signals: If breadth continues deteriorating + junk bond spreads begin widening, a “credit → equity” negative feedback loop could form, accelerating the fear index downward. Conversely, if breadth improves + VIX remains low, the index could return to neutral territory
- Key watchpoints: Whether Stock Price Breadth breaks below 20 (extreme fear threshold) + whether Junk Bond Demand spreads begin widening
🚨 Crisis Precursor Dashboard
1. Credit Spreads
| Indicator | Value | Status | Thresholds |
|---|---|---|---|
| HY OAS (High Yield) | 2.84% | 🟢 Normal | <3% Normal / 3-5% Warning / 5-8% Panic / >8% Crisis |
| IG OAS (Investment Grade) | 0.80% | 🟢 Normal | <1% Normal / 1-2% Warning / >2% Panic |
- Trend: HY OAS stable at 2.84%, IG OAS at 0.80%, both in normal range
- Interpretation: Credit markets are pricing healthy conditions with no systemic risk reflected. However, note that the FNG sub-indicator Junk Bond Demand scores 75.2 (extreme greed) — the extremely low spread itself signals “overconfidence” in credit markets, which may underprice tail risks
2. Yield Curve
| Indicator | Value | Status |
|---|---|---|
| 10Y-2Y Spread | +47bp | 🟢 Normal/Flat |
| 10Y-3M Spread | — | — |
| 10Y | 4.68% | — |
| 2Y | 4.23% | — |
| 30Y | 5.21% | — |
| 10Y-30Y Spread | -53bp | 🟡 Slight Inversion |
- Interpretation: The 10Y-2Y spread at +47bp indicates the curve has normalized (no longer inverted). However, the 10Y-30Y spread shows a -53bp inversion, suggesting lingering distortions at the long end. Overall yield curve signal is neutral
3. FINRA Margin Debt
| Indicator | Value | Status |
|---|---|---|
| Latest (Jun 2026) | $1.502T | 🔴 Record High |
| Previous (May 2026) | $1.416T | 🔴 Record High |
| Month-over-Month | +6.1% | — |
| Year-over-Year | +46.9% | — |
- Interpretation: June margin debt at $1.502 trillion, surging +$86B (+6.1%) month-over-month, setting consecutive records. Year-over-year growth of 46.9% from $1.023T in June 2025. Leverage levels are at historical extremes — this is the medium-term tail risk. Once a real market correction hits, high leverage will amplify selling pressure
4. IPO Market
| Indicator | Value | Status |
|---|---|---|
| 2026 YTD IPO Count | ~73 | 🟡 Below Average |
- Interpretation: IPO volume remains subdued, reflecting continued reluctance from companies to go public. Not a crisis signal in itself
5. Fund Flows
| Indicator | Value | Status |
|---|---|---|
| 2026 H1 ETF Net Inflows | $1.01T | 🔴 Record |
| 2026 Full-Year Projection | $2.0-2.3T | 🔴 Far Exceeds 2025 Record |
| US Equity ETF Inflows | $441B (H1) | — |
| Bond ETF Inflows | $292-300B (H1) | — |
- Interpretation: Fund flows at historic records. H1 ETF inflows surpassed $1 trillion, on pace for $2-2.3 trillion for the full year, far exceeding 2025’s record $1.5 trillion. Extreme liquidity is a key market support, but also means “everyone is already positioned” — once sentiment turns, outflow pressure could be equally massive
Overall Assessment
| Green 🟢 | Yellow 🟡 | Red 🔴 |
|---|---|---|
| 2 | 1 | 2 |
- 🟢 Credit spreads normal (HY 2.84% / IG 0.80%)
- 🟢 Yield curve normal/flat (10Y-2Y +47bp)
- 🟡 IPO volume below average (not a crisis signal)
- 🔴 Margin debt at record high $1.502T (extreme leverage)
- 🔴 ETF inflows at record pace $1T+ (crowded positioning)
Key Risk: Credit spreads and yield curves — the “fundamental” indicators — remain healthy. However, margin debt and fund flows — the “behavioral” indicators — are at historical extremes. This means the market’s structural risk lies not in fundamental deterioration, but in over-positioned participants with excessive leverage. Once a trigger emerges (e.g., sudden credit spread widening), high leverage + crowded positioning will amplify any correction.
The current combination of FNG fear (42.5) alongside crisis precursor indicators reveals an interesting contradiction: equity sentiment is fearful, but credit markets and fund flows remain extremely greedy. This “equity cautious, credit greedy” dynamic either means equities are overly pessimistic and due for a bounce, or that credit market optimism is the real bubble.