CNN Fear & Greed Sentiment Analysis 2026-08-01
Composite at 42.5 (Fear), up +3.6 from prior day. Junk Bond Demand at Extreme Greed (75.2) while Stock Price Breadth sits at Extreme Fear (22.6) — a 52.6-point structural divergence. Crisis dashboard: credit spreads normal, but margin debt hits record $1.50T, ETF inflows surpass $1T H1 2026 record pace.
Composite Index
| Metric | Value | Rating |
|---|---|---|
| Latest | 42.5 | 😨 Fear |
| Previous Close | 38.9 | Fear |
| 1 Week Ago | 41.3 | Fear |
| 1 Month Ago | 30.0 | Fear |
| 1 Year Ago | 63.7 | Greed |
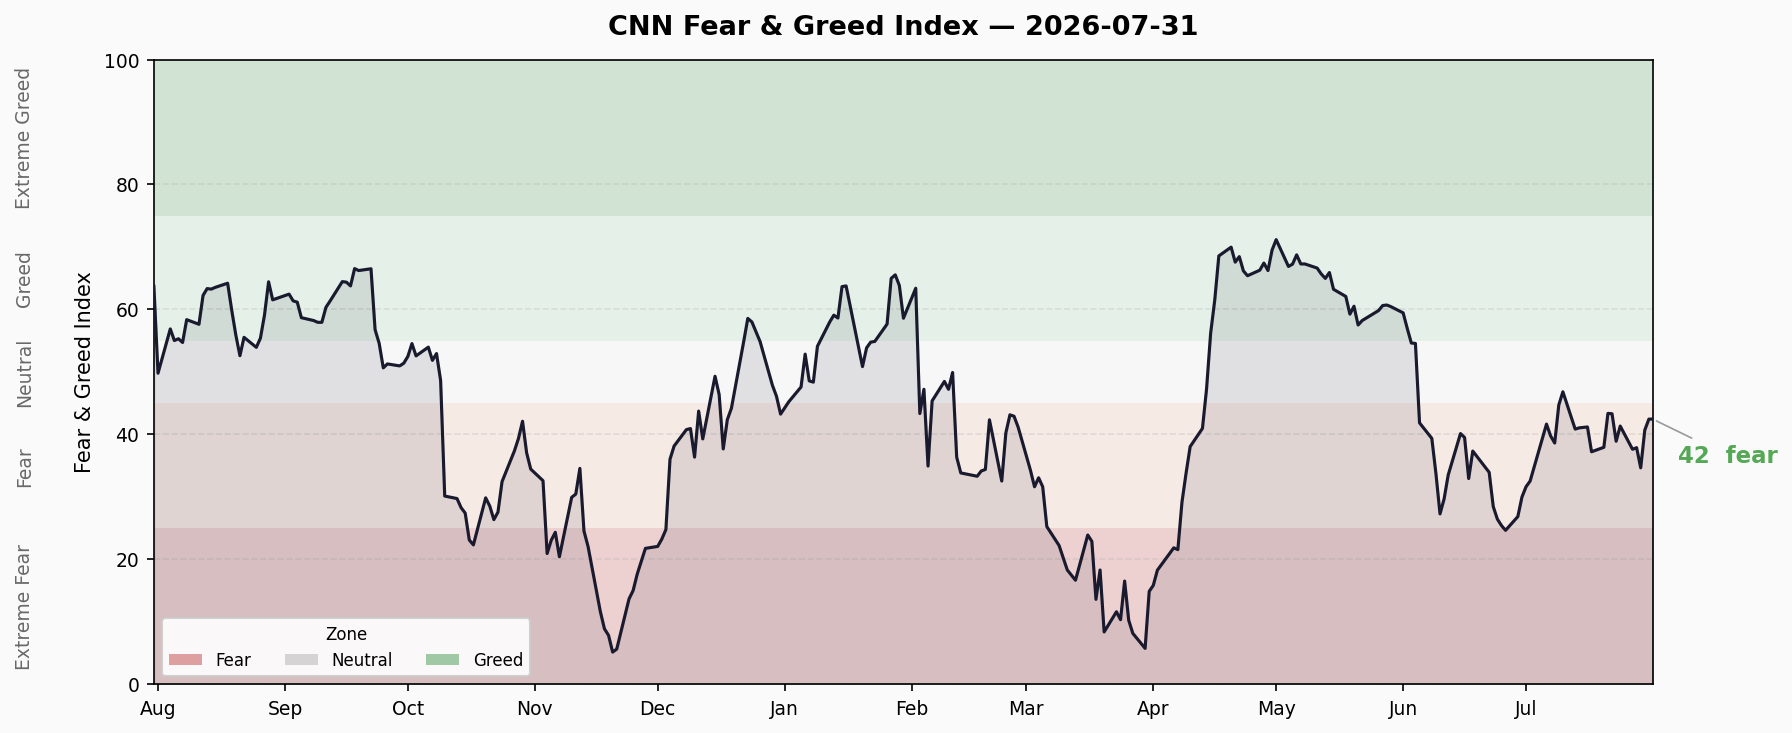
The composite index reads 42.5, in the Fear zone. Up +3.6 day-over-day, +1.2 week-over-week, +12.5 month-over-month. The index bounced from the 34.7 low on 7/29, recovering for two consecutive sessions, but remains well below the neutral 50 line. Compared to one year ago’s 63.7 (Greed), the index has dropped over 21 points.
Last 10 Trading Days
| Date | Score | Rating |
|---|---|---|
| 07/21 | 43.4 | Fear |
| 07/22 | 43.3 | Fear |
| 07/23 | 38.9 | Fear |
| 07/24 | 41.3 | Fear |
| 07/27 | 37.6 | Fear |
| 07/28 | 37.9 | Fear |
| 07/29 | 34.7 | Fear (recent low) |
| 07/30 | 40.7 | Fear |
| 07/31 | 42.5 | Fear |
Trend: 10 consecutive trading days in the Fear zone, range 34.7–43.4. Bottomed at 34.7 on 7/29, now bouncing toward the upper end of the range. A breakout above 43.4 toward 50 would signal potential exit from Fear; failure at 43–44 with a pullback would extend the Fear regime.
Seven Sub-Indicators Scan
| # | Sub-Indicator | FNG Score | Rating | Raw Value | Direction |
|---|---|---|---|---|---|
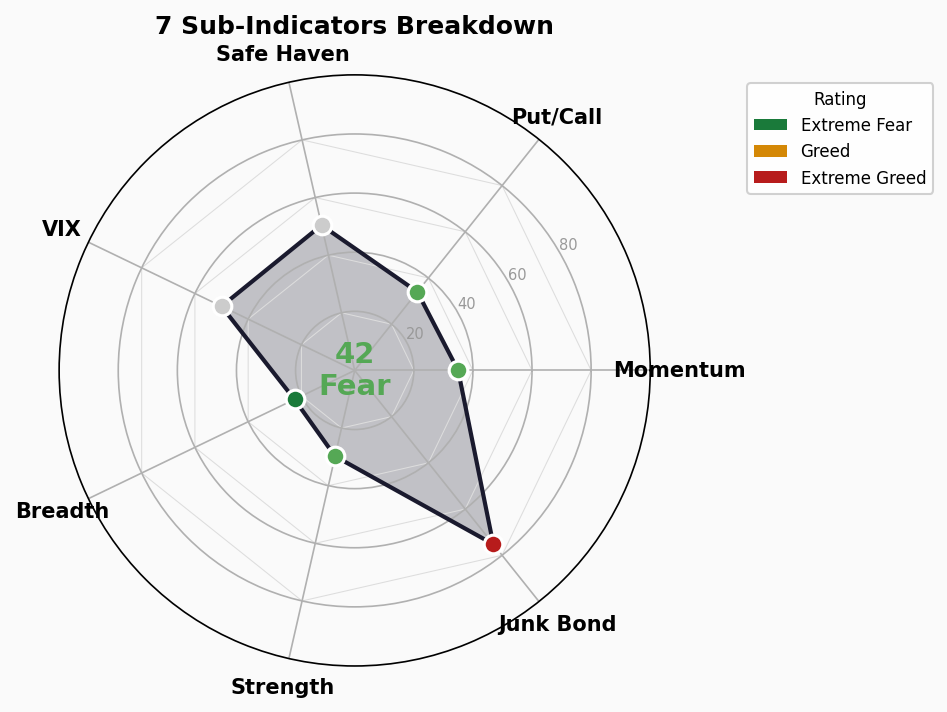
| 1 | Junk Bond Demand | 75.2 | 🔥 Extreme Greed | Spread 1.269% | ↑ Tightening (risk-on) |
| 2 | Safe Haven Demand | 50.4 | Neutral | 1.433 | ↑ Stocks outperforming bonds |
| 3 | Market Volatility (VIX) | 50.0 | Neutral | VIX 15.99 | ↓ Volatility declining |
| 4 | Market Momentum (S&P 500 vs 125-day MA) | 35.0 | 😨 Fear | 7,490 pts | → Above MA but momentum fading |
| 5 | Put/Call Options | 34.0 | 😨 Fear | 0.816 | ↓ P/C declining (bullish lean) |
| 6 | Stock Price Strength (New Highs vs Lows) | 29.8 | 😨 Fear | Ratio 1.178 | ↓ More new lows than highs |
| 7 | Stock Price Breadth (McClellan Osc.) | 22.6 | 💀 Extreme Fear | 856.6 | → Breadth deteriorating |
Sub-Indicator Interpretation
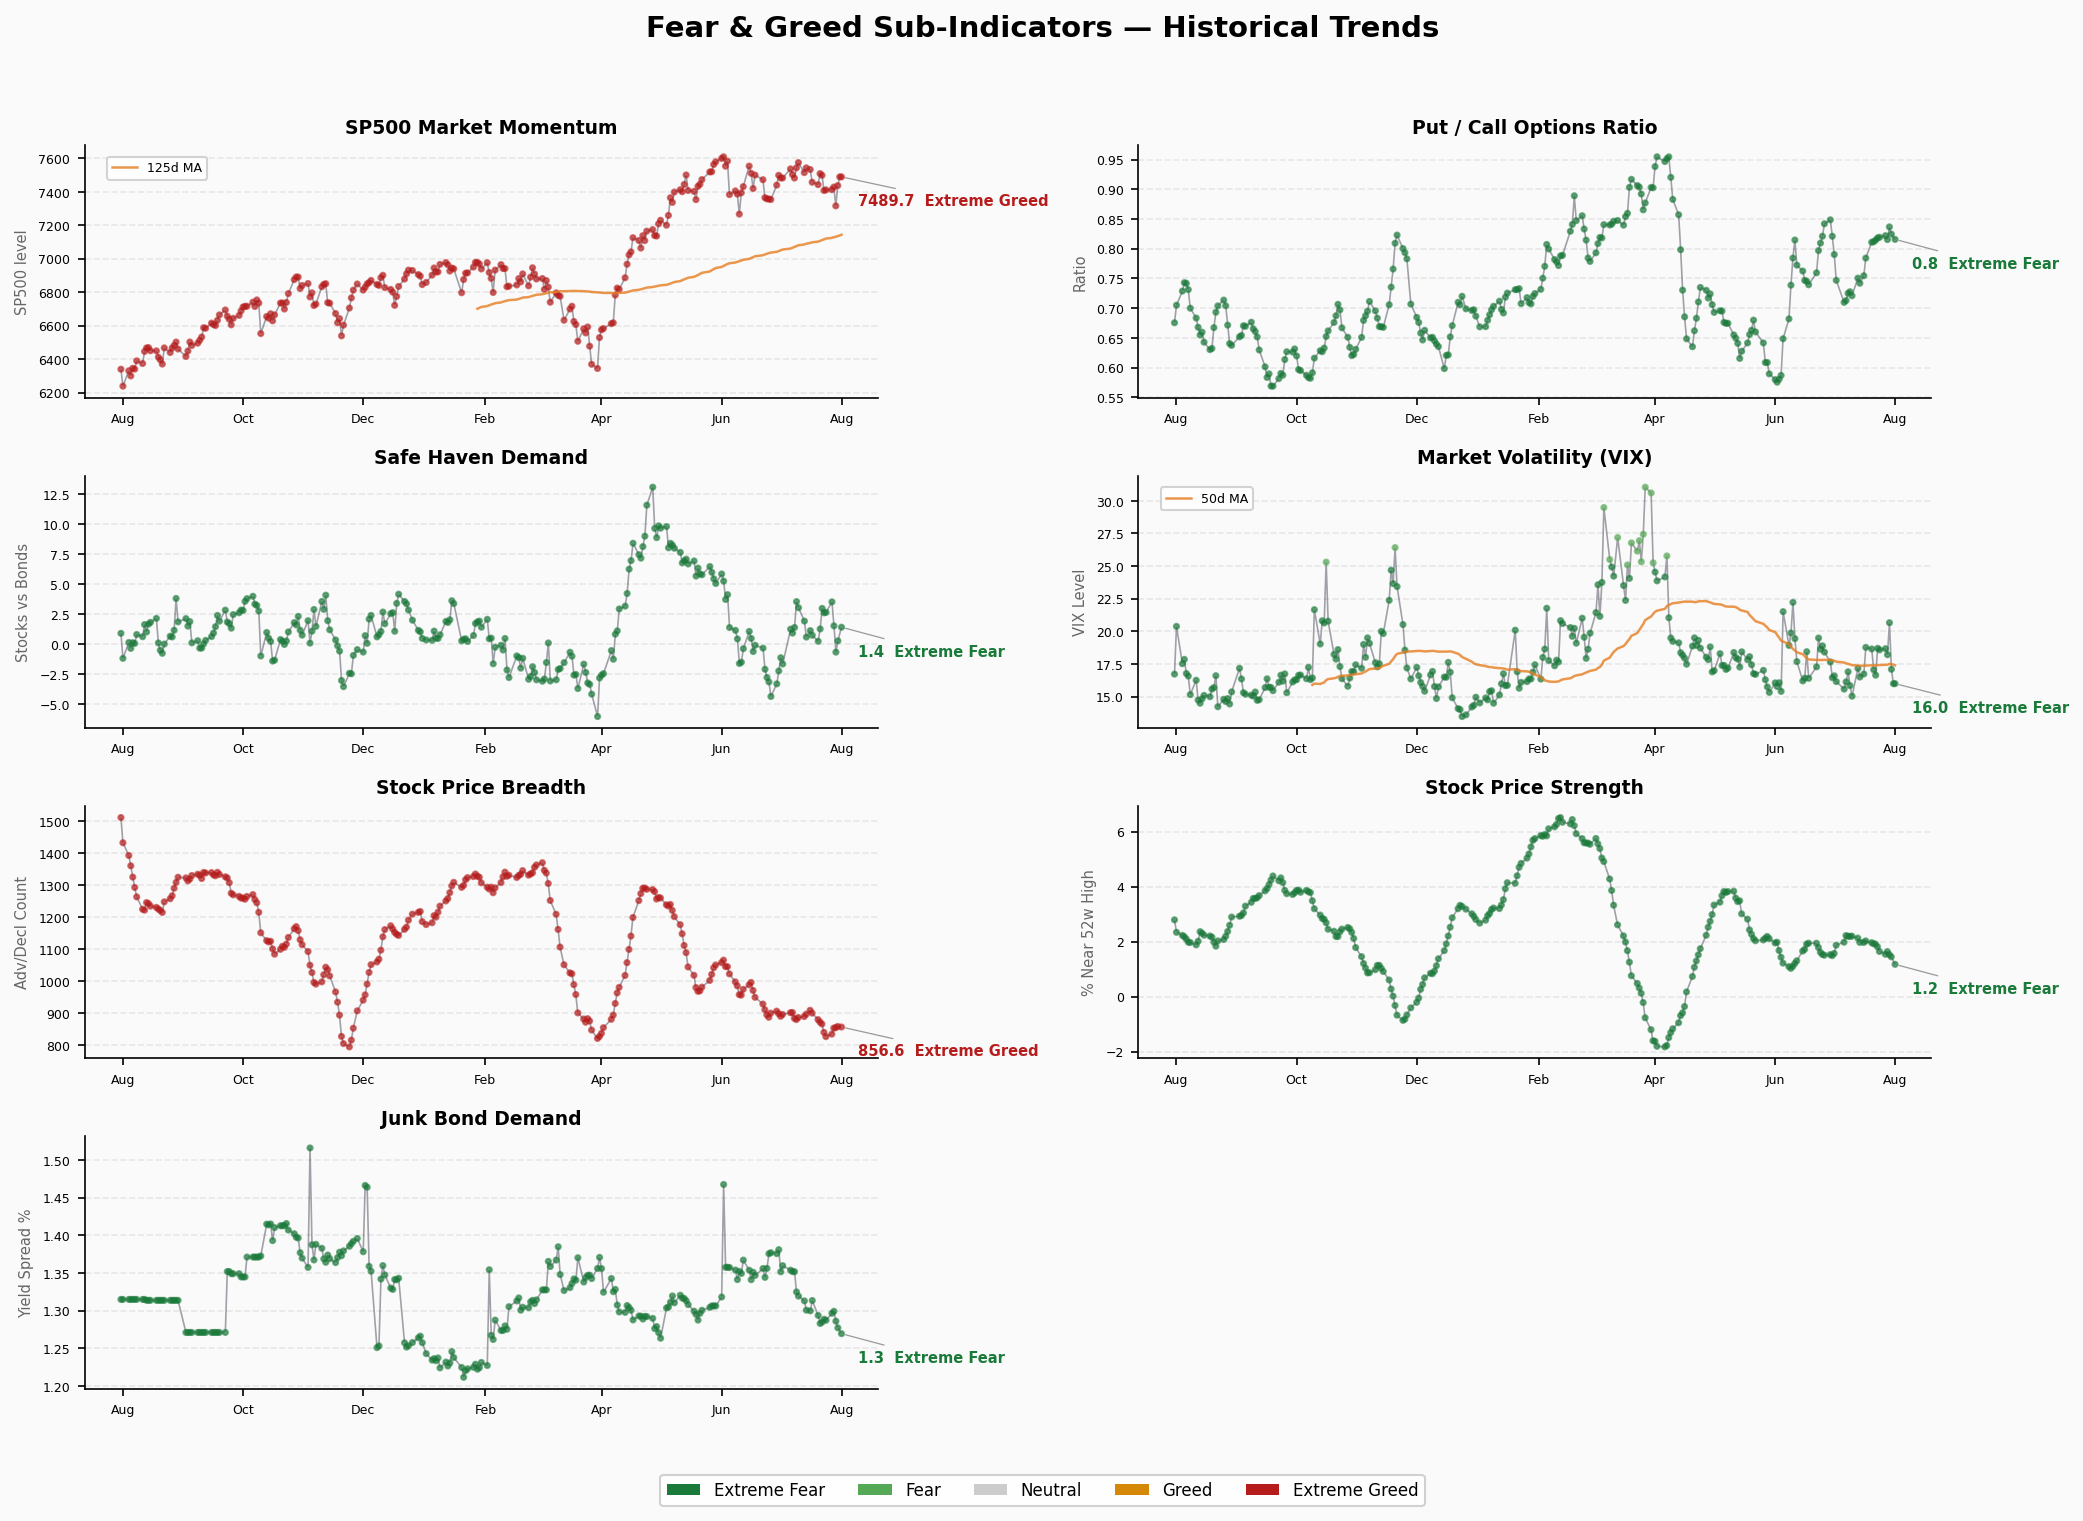
Junk Bond Demand (75.2 — Extreme Greed): High-yield spreads tightened to 1.269%, with capital flooding into credit. Bond investors are pricing in a flawless macro picture — a stark contrast to the composite FNG at 42.5.
Safe Haven Demand (50.4 — Neutral): Stocks slightly outperforming bonds recently, but no clear risk-on/risk-off tilt.
Market Volatility VIX (50.0 — Neutral): VIX at 15.99, persistently low. Given deteriorating market internals, this reads more as complacency than genuine stability.
Market Momentum (35.0 — Fear): S&P 500 at 7,490, still above its 125-day MA (raw metric shows extreme greed), but the FNG momentum score is only 35. Price remains elevated but the rate of ascent has clearly decelerated.
Put/Call Options (34.0 — Fear): P/C ratio at 0.816, call options dominating. Combined with deteriorating breadth, this suggests under-hedging rather than genuine bullish conviction.
Stock Price Strength (29.8 — Fear): New-high/new-low ratio at 1.178, with more stocks making new lows than new highs. Market participation is narrowing.
Stock Price Breadth (22.6 — Extreme Fear): McClellan Oscillator at 856.6 (raw metric in extreme greed territory), yet the FNG score is the lowest of all seven indicators. Advance/decline imbalance is severe — index-level stability masks broad-based weakness underneath.
Structural Divergence Analysis
Divergence 1: Junk Bond Extreme Greed vs. Breadth Extreme Fear
Junk Bond Demand at 75.2 (Extreme Greed) versus Stock Price Breadth at 22.6 (Extreme Fear) creates a 52.6-point chasm. Credit markets price perfection while equity internals flash red. This divergence typically appears when liquidity is still abundant at the index level but is draining at the micro level — credit is a lagging indicator that has yet to catch up with equity breadth deterioration.
Divergence 2: Low VIX Complacency vs. Breadth Collapse
VIX at 15.99 looks calm, yet breadth is at extreme fear. Low volatility + weak breadth = a narrow market: a handful of mega-cap stocks are holding up the index while the majority of names are already in correction territory. If the leaders roll over, VIX could spike rapidly.
Divergence 3: Price Above MA vs. Internal Indicators in Fear
S&P 500 price remains above the 125-day MA, but 5 of 7 sub-indicators are in Fear or Extreme Fear. The index-level strength contradicts the internal structural weakness — a classic bearish divergence setup.
Trend Assessment
- Duration in Fear zone: 3+ consecutive weeks (all of July 2026 through 7/31)
- Bounce signal: Bottomed at 34.7 on 7/29, recovered +7.8 points over two sessions
- Key levels: Upside resistance at 43–45 (upper end of 10-day range); support at 35 (recent low)
- Reversal indicators: If Junk Bond Demand retreats from extreme greed while breadth remains depressed → risk of further FNG downside. Conversely, if breadth improves while VIX stays low → potential recovery toward neutral.
🚨 Crisis Precursor Dashboard
1. Credit Spreads
| Indicator | Value | Date | Status |
|---|---|---|---|
| High Yield OAS (HY OAS) | 2.84% | 07/30 | 🟢 Normal |
| Investment Grade OAS (IG OAS) | 0.80% | 07/30 | 🟢 Normal |
- Thresholds: HY <3% normal | 3-5% warning | 5-8% panic | >8% crisis
- Trend: HY OAS stable at 2.8-2.9%. Credit markets have not priced in risk yet. However, the Junk Bond Demand FNG sub-indicator sits at extreme greed with spreads near historical tights — the room for deterioration is larger than for improvement.
2. Yield Curve
| Indicator | Value | Status |
|---|---|---|
| 10Y-2Y Spread | +47bp | 🟢 Normal (slightly flat) |
| 10Y-30Y Spread | -53bp | 🟡 Inverted |
| 10Y Yield | 4.68% | |
| 2Y Yield | 4.23% | |
| 30Y Yield | 5.21% |
- Trend: The 10Y-2Y curve has normalized to +47bp (no longer inverted). However, the 10Y-30Y remains inverted at -53bp, an abnormal long-end shape. Overall rates remain elevated, sustaining valuation pressure.
3. Margin Debt
| Indicator | Value | Date | Status |
|---|---|---|---|
| FINRA Margin Debt | $1.502T | 2026/06 | 🔴 Record High |
- Trend: June margin debt at $1.502 trillion, up $86.6B (+6.1%) from May’s $1.416T, and up a staggering +15.2% from April’s $1.304T. Nearly $200B added in two months — leverage is accelerating rapidly.
- YoY: Up +49% from June 2025’s $1.008T, far exceeding normal annual growth rates.
- Warning: Margin debt surging + FNG in Fear + breadth at extreme fear = leveraged capital chasing a narrowing market while internals deteriorate. Any drawdown risks forced-deleveraging cascades.
4. IPO Activity & Fund Flows
| Indicator | Value | Status |
|---|---|---|
| 2026 YTD IPOs | ~73 (Renaissance Capital) | 🟡 Low |
| 2026 H1 ETF Net Inflows | $1 trillion | 🔴 Record |
| Full-year pace | $2T+ (would surpass 2025’s $1.5T record) | 🔴 |
- Trend: ETF inflow velocity is unprecedented — $1T in H1 alone, with equity ETFs capturing $680B and bond ETFs $292B. Passive capital is concentrated at the index level, consistent with the breadth deterioration pattern — funds flow into index-weighted mega-caps rather than broad stock selection.
- ICI weekly data (week ended 7/22): Equity funds saw net outflows of $16.6B, while bond funds took in $11.9B. This marginal reversal is worth monitoring.
Overall Assessment
| Category | Indicators | 🟢 | 🟡 | 🔴 |
|---|---|---|---|---|
| Credit Spreads | 2 | 2 | 0 | 0 |
| Yield Curve | 2 | 1 | 1 | 0 |
| Leverage / Flows | 2 | 0 | 0 | 2 |
| Total | 6 | 3 | 1 | 2 |
Overall: Credit markets and the yield curve have not issued crisis signals, but margin debt at record highs with accelerating growth + record-breaking ETF inflows keep two red flags flashing. The market is in an unstable regime of “stable credit + excessive leverage + fragile internals.” The FNG composite sits in Fear while credit spreads remain tight — a classic “equity adjusting but credit not following” phase. If HY OAS begins to widen (breaking above 3%), heightened vigilance is warranted.