CNN Fear & Greed Analysis 2026-07-31
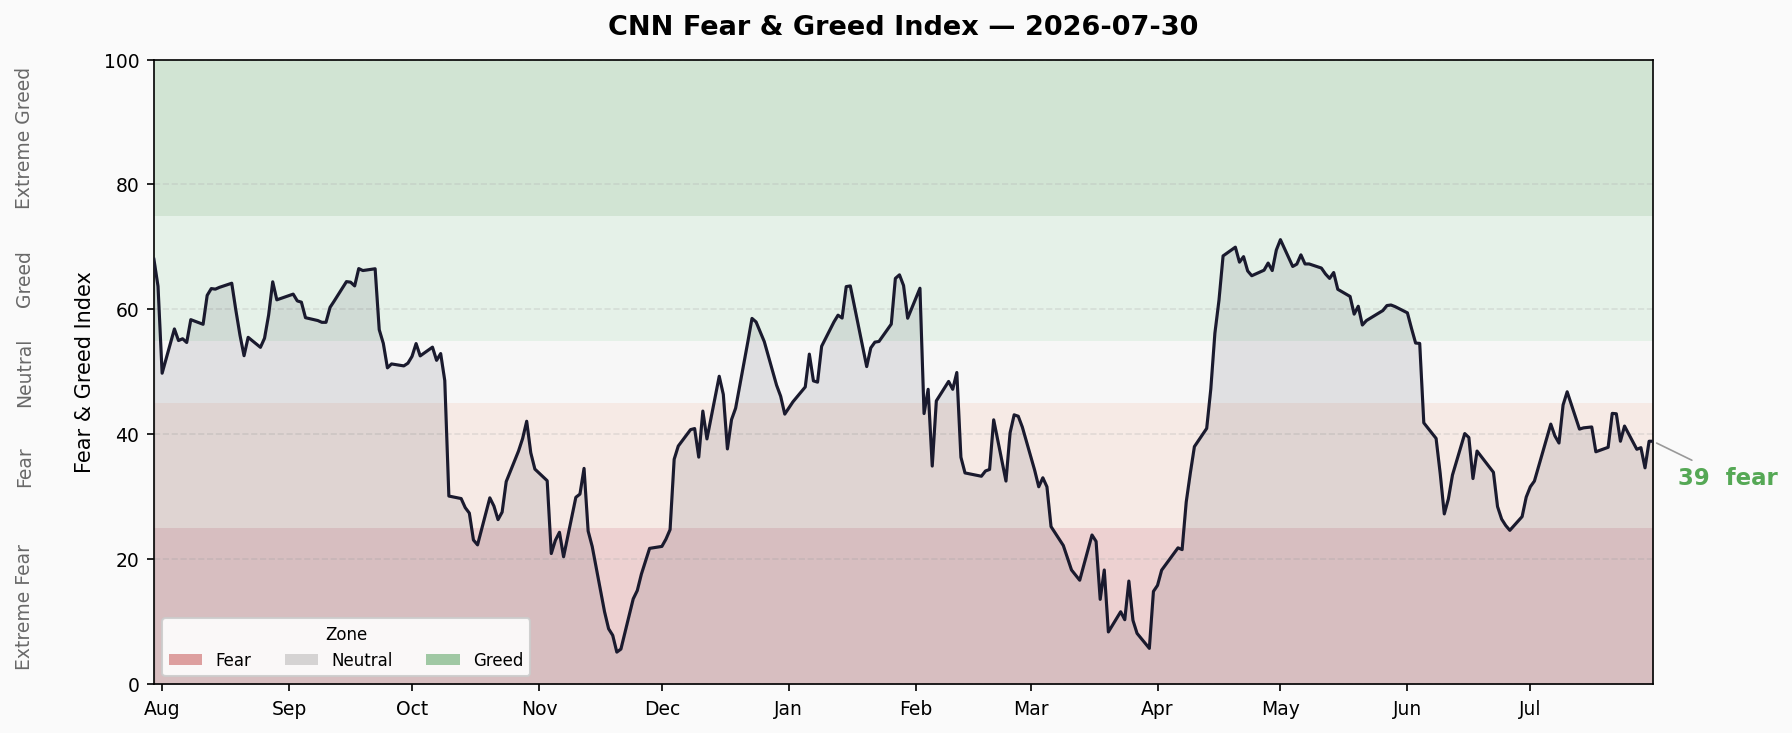
Composite score 38.91 (Fear). Structural divergence between SPX momentum and junk bond demand: five of seven sub-indicators in Fear or Extreme Fear, only Junk Bond Demand holding Greed. VIX retreated to 17.09 but sentiment recovery remains sluggish—Fear zone has persisted for 12 consecutive sessions.
Composite Index
| Metric | Value |
|---|---|
| Latest Score | 38.91 |
| Rating | 😨 Fear |
| Previous Close | 32.25 (+6.66) |
| 1 Week Ago | 38.91 (unchanged) |
| 1 Month Ago | 29.97 (+8.94) |
| 1 Year Ago | 68.03 (Greed → now -29.12) |
Trend Assessment
Over the past 10 trading sessions, Fear & Greed has oscillated narrowly between 34.7 and 43.4, consistently within the Fear zone. Since emerging from Extreme Fear on July 17, the index has spent 12 consecutive sessions in Fear territory without touching the Neutral threshold (45). This indicates sluggish sentiment recovery—no longer panicked, but far from confident.
Notably, July 29 saw a brief dip to 34.7, followed by a two-day bounce back to 38.9—a minor V-shaped recovery. However, the rebound lacks conviction; a break above 40 remains the key level to watch.
Seven Sub-Indicator Scan
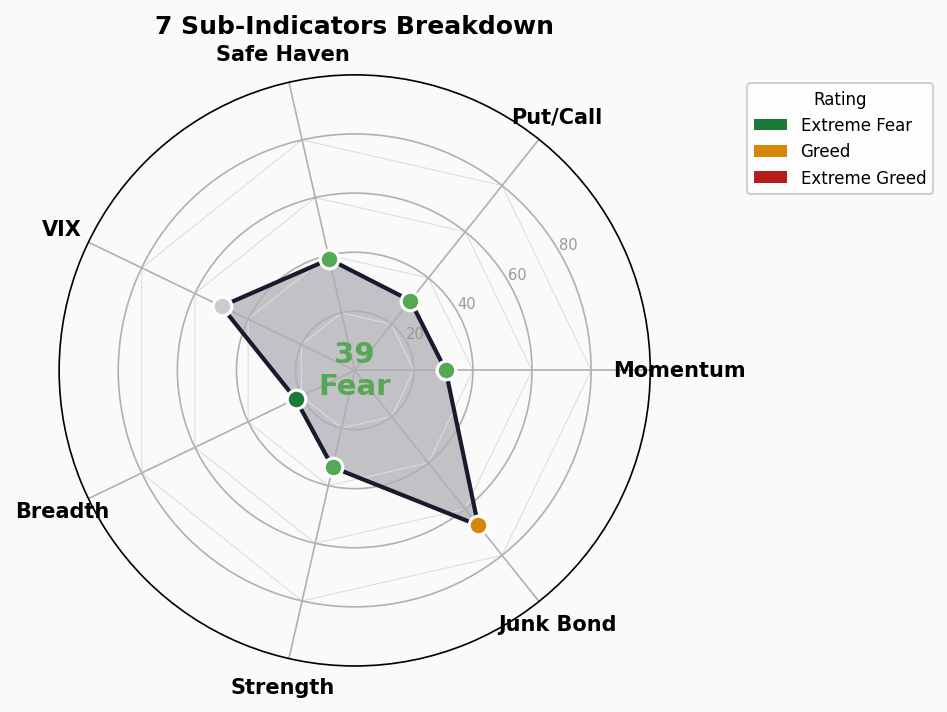
1. Market Momentum — 30.8 😨 Fear
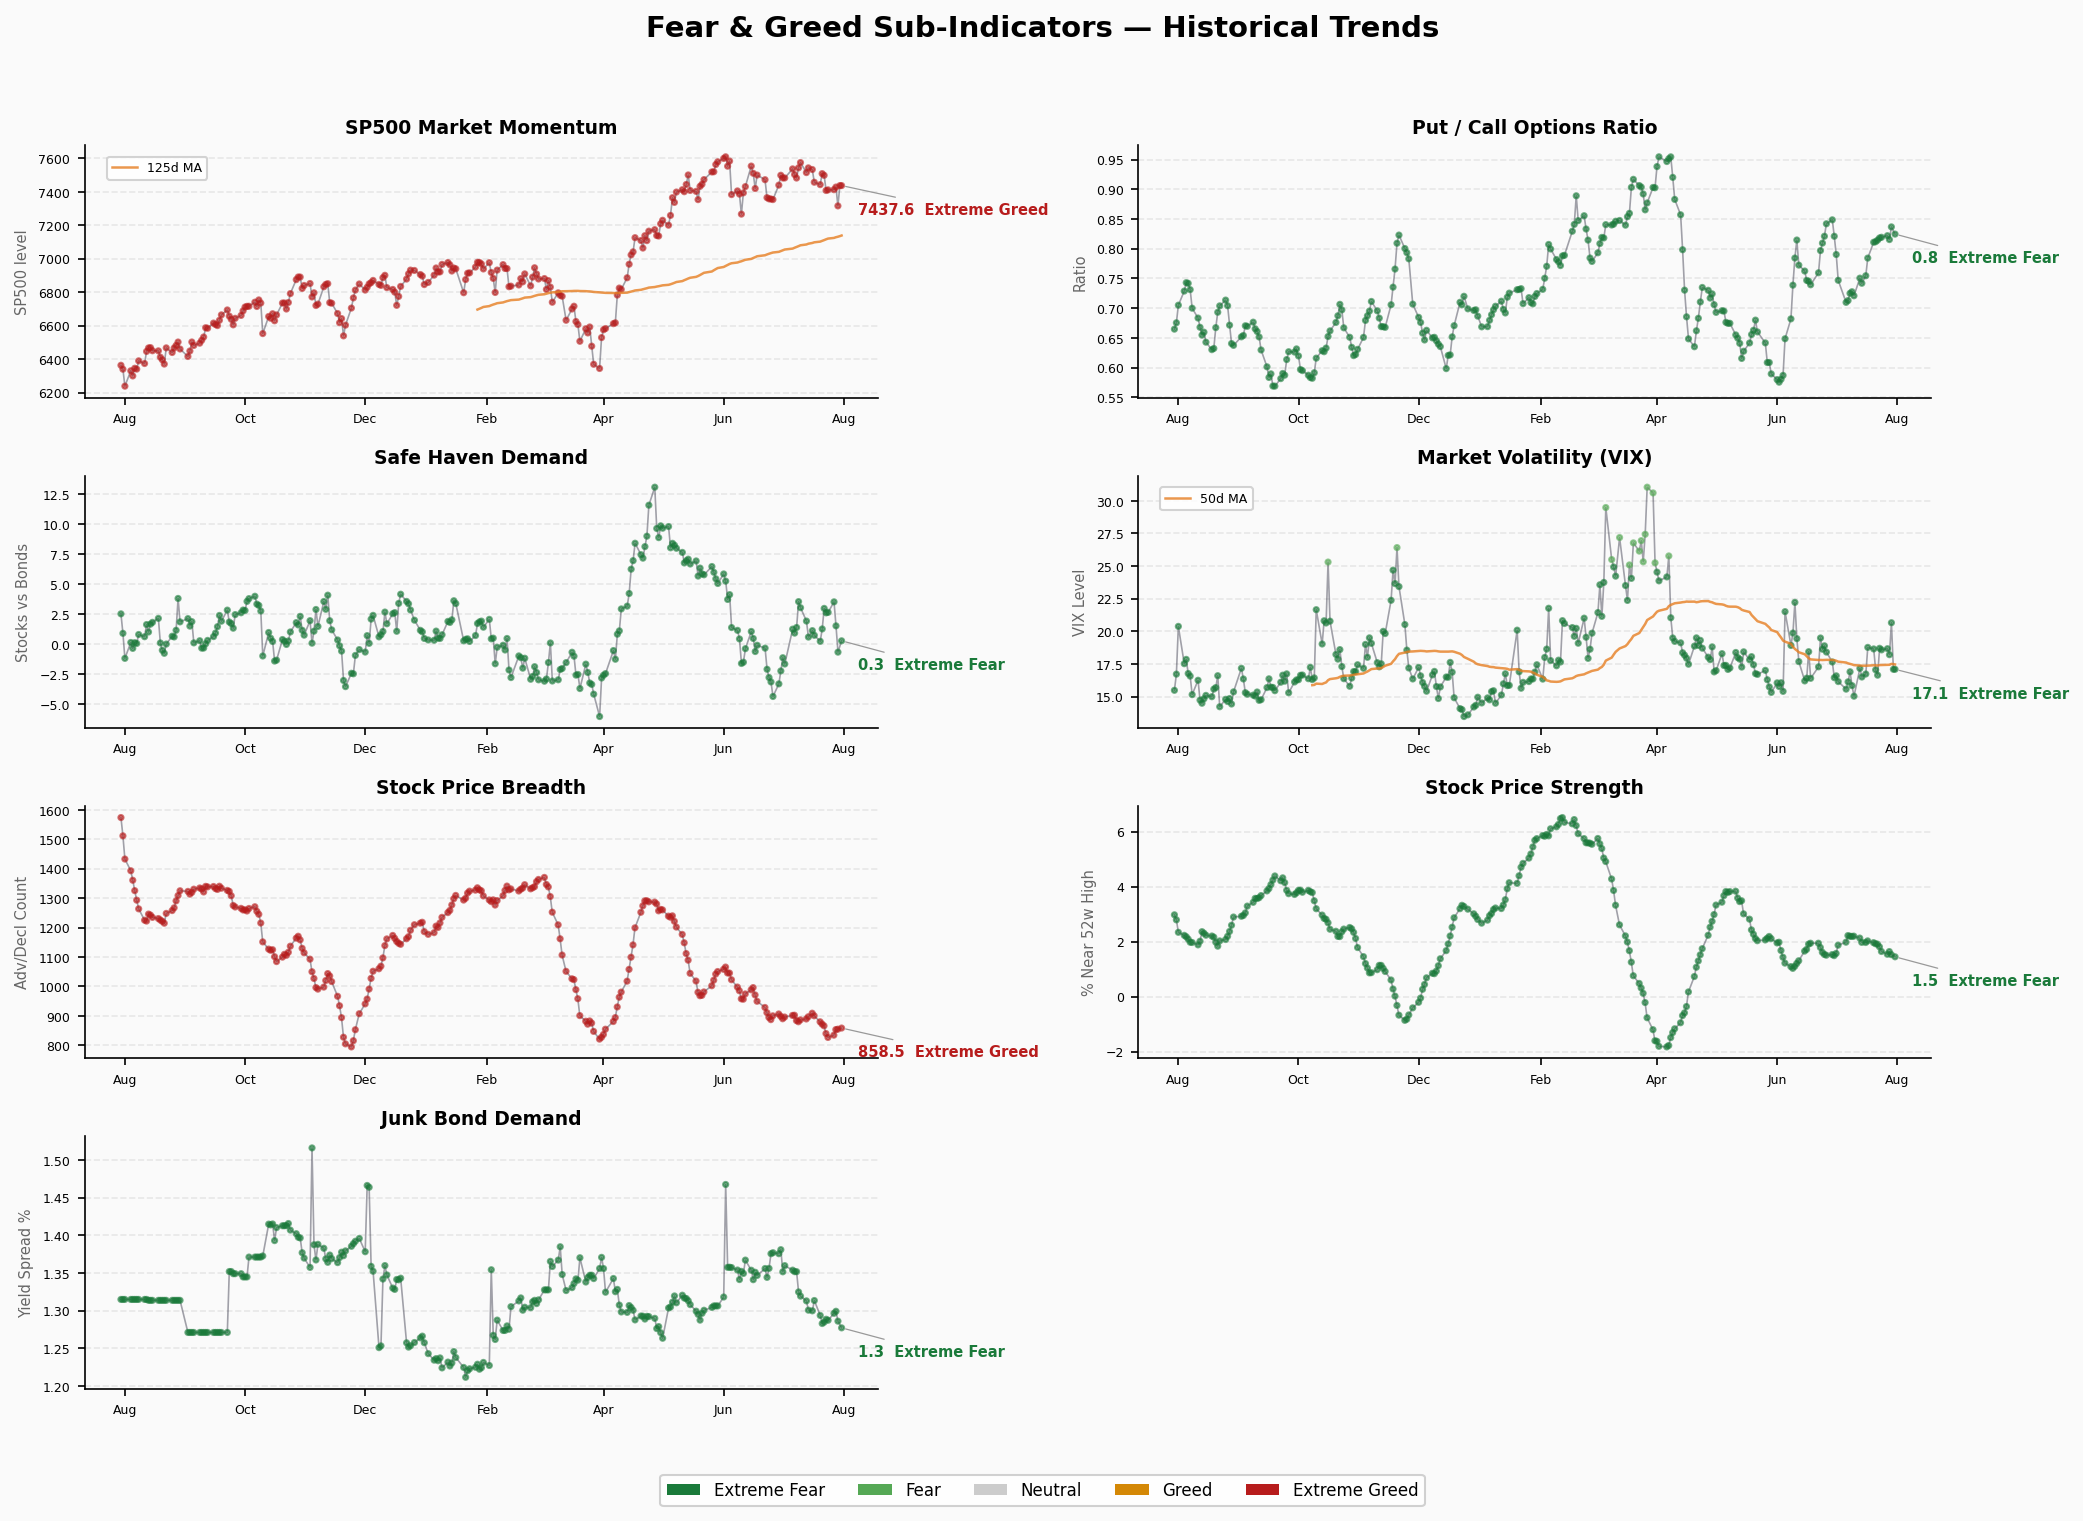
S&P 500 vs 125-day moving average. Raw value: SPX 7,437.63, well above the 125-DMA of 7,135.35. The raw data sits in Extreme Greed territory, yet the score is only 30.8. This reflects CNN’s lag effect—the index remains elevated, but decelerating near-term gains drag down the momentum score.
2. Stock Price Strength — 33.6 😨 Fear
52-week high/low ratio: 1.45. Declining for three consecutive sessions (1.64 → 1.53 → 1.45), indicating a shrinking universe of stocks making new highs. This signals deteriorating market breadth beneath the surface.
3. Stock Price Breadth — 22.2 🚨 Extreme Fear
McClellan Volume Summation Index: 858.49. The raw value is in Extreme Greed territory, but CNN’s scoring maps it to Extreme Fear (22.2). This reflects the rate of decline in breadth momentum—the index is high but losing steam.
4. Put/Call Options — 30.2 😨 Fear
Put/Call ratio: 0.82. Held steady in the 0.81–0.84 range over the past three sessions. Options market leans bearish but hasn’t reached extreme panic levels.
5. Market Volatility — 50.0 😐 Neutral
VIX latest: 17.09 (previous 20.66 → sharp drop of -3.57). VIX 50-day moving average: 17.48. Current VIX sits slightly below its 50-DMA, indicating neutral-to-low volatility. The sharp retreat from 20.66 suggests short-term fear has dissipated.
6. Junk Bond Demand — 67.0 😎 Greed
Junk bond yield spread vs Treasuries: 1.28%. This is the only sub-indicator in Greed territory. The credit market remains optimistic about the economic outlook, standing in stark contrast to equity market anxiety.
7. Safe Haven Demand — 38.6 😨 Fear
Stock excess return vs Treasuries: +0.30%. Wild swings over the past three sessions (1.54 → -0.64 → 0.30), reflecting rapid capital rotation between stocks and bonds with no clear direction.
Structural Divergence Analysis
Two significant structural contradictions are present:
Divergence 1: Junk Bond Greed vs Equity Fear
- Junk Bond Demand 67.0 (Greed) — the only positive sub-indicator
- All six other indicators in Fear or Extreme Fear
- The credit market says “no problem”; the equity market says “I’m scared”
- Historical precedent: such divergences typically resolve with equities catching up to credit, but if credit spreads suddenly widen, a double-hit scenario becomes possible
Divergence 2: SPX Near Highs vs Depressed Sentiment
- S&P 500 at 7,437, just 2.3% below the all-time high of 7,610
- Yet Fear & Greed sits at only 38.91—the market is “rising reluctantly”
- The momentum score of 30.8 reflects “high-level stagnation” concerns
- This “index not falling, sentiment not rising” pattern often indicates the market is waiting for a catalyst
Extreme Value Distribution:
- Extreme Greed (>80): None
- Greed (55–80): Junk Bond Demand 67.0
- Neutral (45–55): VIX 50.0
- Fear (25–45): 5 indicators
- Extreme Fear (20–25): Stock Price Breadth 22.2
- Extreme Fear (<20): None
🚨 Crisis Precursor Dashboard
1. Credit Spreads
- HY OAS: 2.87% (2026-07-29) | 🟢 Normal
- IG OAS: 0.81% (2026-07-29) | 🟢 Normal
- Trend: Hovering at historical lows; no stress signals from credit markets
2. Yield Curve
- 10Y-2Y Spread: +45bp | 🟢 Normal (mildly flat)
- 2Y: 4.22% | 30Y: 5.20% | 10Y: Data unavailable (FRED 502)
- Trend: Curve positively sloped but moderately flat, reflecting subdued long-term growth confidence
3. Margin Debt
- Latest: $1.502T (June 2026, FINRA)
- MoM: May $1.416T → June +$86B (+6.1%)
- YoY: June 2025 $1.008T → +$494B (+49.0%)
- Status: 🔴 All-time high territory
- Risk Note: Margin debt surging nearly 50% YoY, far outpacing GDP and earnings growth. Forced liquidation cascade risk is non-trivial in a market pullback.
4. IPO Market
- H1 2026: 65 traditional IPOs, $114.2B raised (strongest H1 since 2021)
- Pricing: Nearly half of IPOs priced at or above the top end of marketed ranges
- First-day performance: ~97% opened above offer price
- Status: 🔴 IPO window wide open—signs of froth
- Historical context: 2021’s IPO boom preceded the 2022 bear market
5. Fund Flows
- ETF Net Inflows: $1T in H1 2026 (all-time record, roughly double YoY)
- Equity ETFs: $680B (more than double YoY)
- Latest week (through 7/22): Total outflows -$3.17B, but ETF net issuance +$31.78B
- Status: 🔴 Record inflows, strong chase-the-rally sentiment
- Risk Note: Simultaneous retail and institutional inflows historically cluster in late-cycle phases
Composite Assessment
| Indicator | Status |
|---|---|
| Credit Spreads (HY OAS) | 🟢 Normal |
| Credit Spreads (IG OAS) | 🟢 Normal |
| Yield Curve (10Y-2Y) | 🟢 Normal / Mildly Flat |
| Margin Debt | 🔴 Record High |
| IPO Market | 🔴 Frothy |
| Fund Flows | 🔴 Record Inflows |
2 🟢 / 0 🟡 / 4 🔴 (margin debt, IPO, and fund flows counted as three separate red flags)
⚠️ All credit-based indicators (HY OAS, IG OAS, yield curve) remain in normal territory, but every capital-flow indicator (margin debt, IPO activity, ETF inflows) is flashing red. This is not an imminent crash signal, but it reflects extreme risk appetite among market participants. Historically, similar combinations—low volatility + high leverage + heavy IPO activity—have appeared in late-cycle bull markets. Current crash probability assessment: low in the near term (1–3 months), moderate-to-high in the medium term (6–12 months).