CNN Fear & Greed Index Analysis 2026-07-30
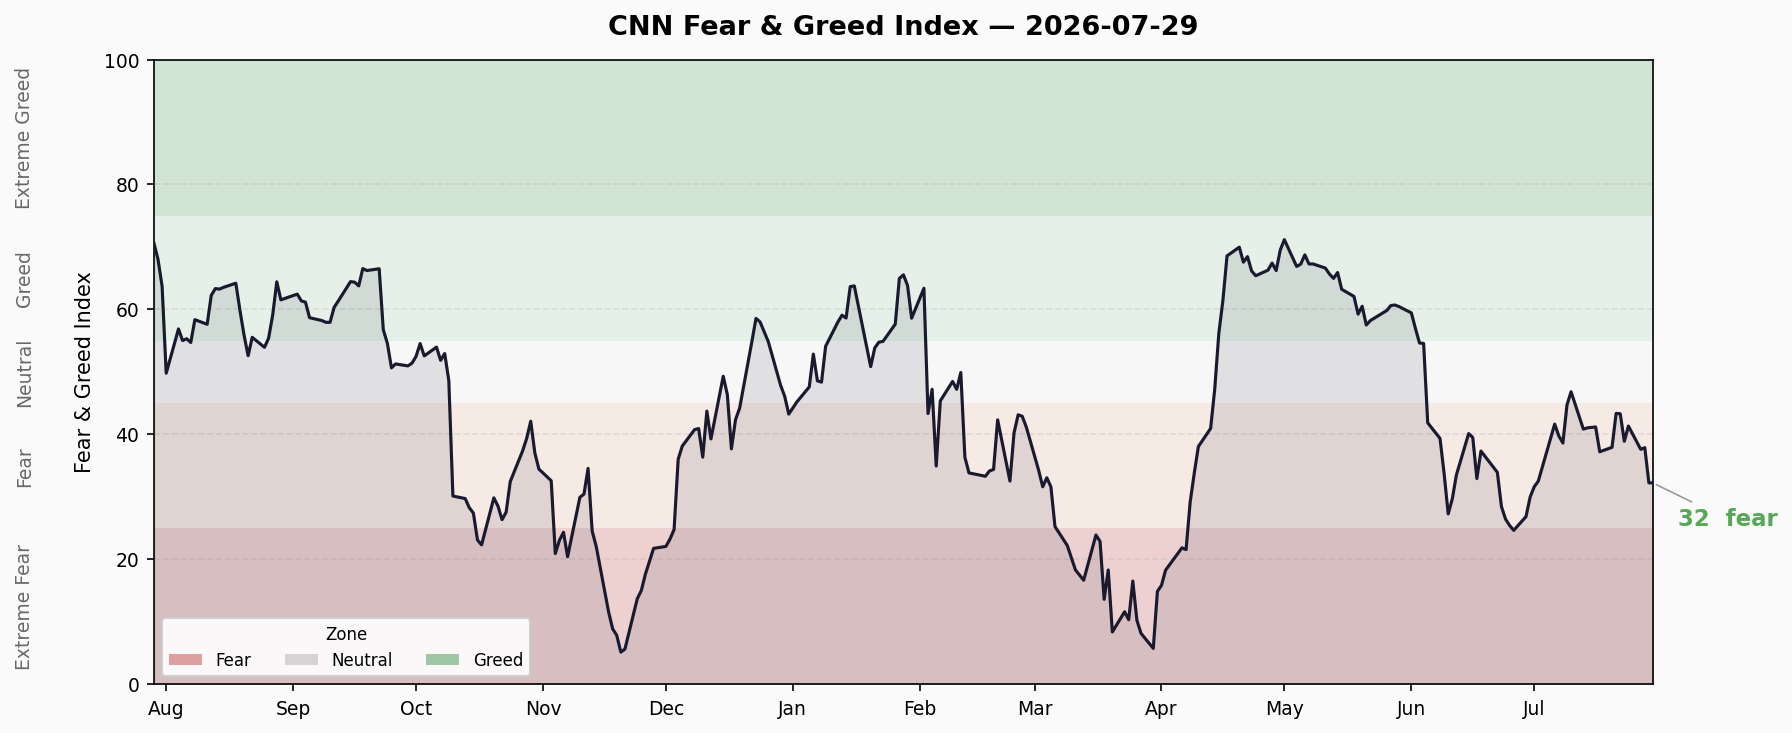
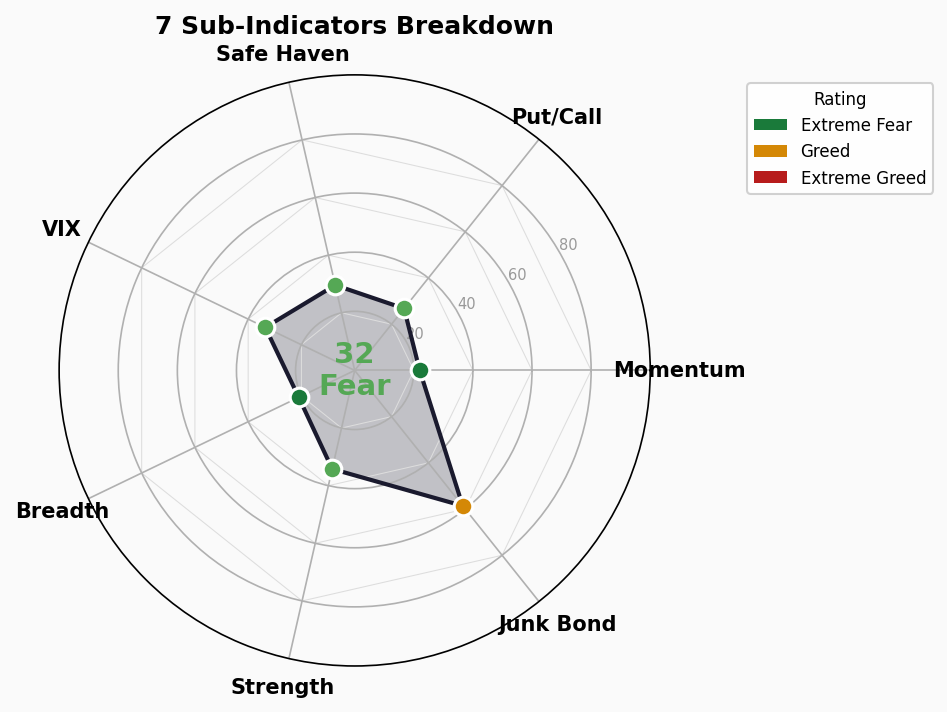
CNN Fear & Greed Index drops to 32.3 (Fear), down 5.6 points from prior close. S&P 500 falls to 7,316, a 1.5% daily decline. Market Breadth plunges into Extreme Fear (21), while Junk Bond Demand remains the sole Greed signal (58.6). Crisis indicators: FINRA margin debt hits all-time high of $1.502T, ETF H1 inflows surpass $1T for the first time.
Composite Index
| Metric | Value |
|---|---|
| Composite Score | 32.3 / 100 |
| Rating | 😨 Fear |
| Prior Close | 37.9 |
| Daily Change | -5.6 ▼ |
| 1 Week Ago | 43.3 |
| 1 Month Ago | 26.9 |
| 1 Year Ago | 70.6 |
Trend Assessment: The composite index has fallen sharply from 43.3 (mid-Fear) a week ago to 32.3, with a single-day plunge of 5.6 points — now approaching the Extreme Fear threshold at 30. Over the past 10 trading days, the index has trended down from a peak of 43.4. The index has been in Fear territory for approximately two weeks. The S&P 500 closed at 7,316 on July 29, dropping 113 points (-1.5%) in a single session, marking two consecutive down days.
Sub-Indicator Breakdown
1. Stock Price Strength — 34.2 | 😨 Fear
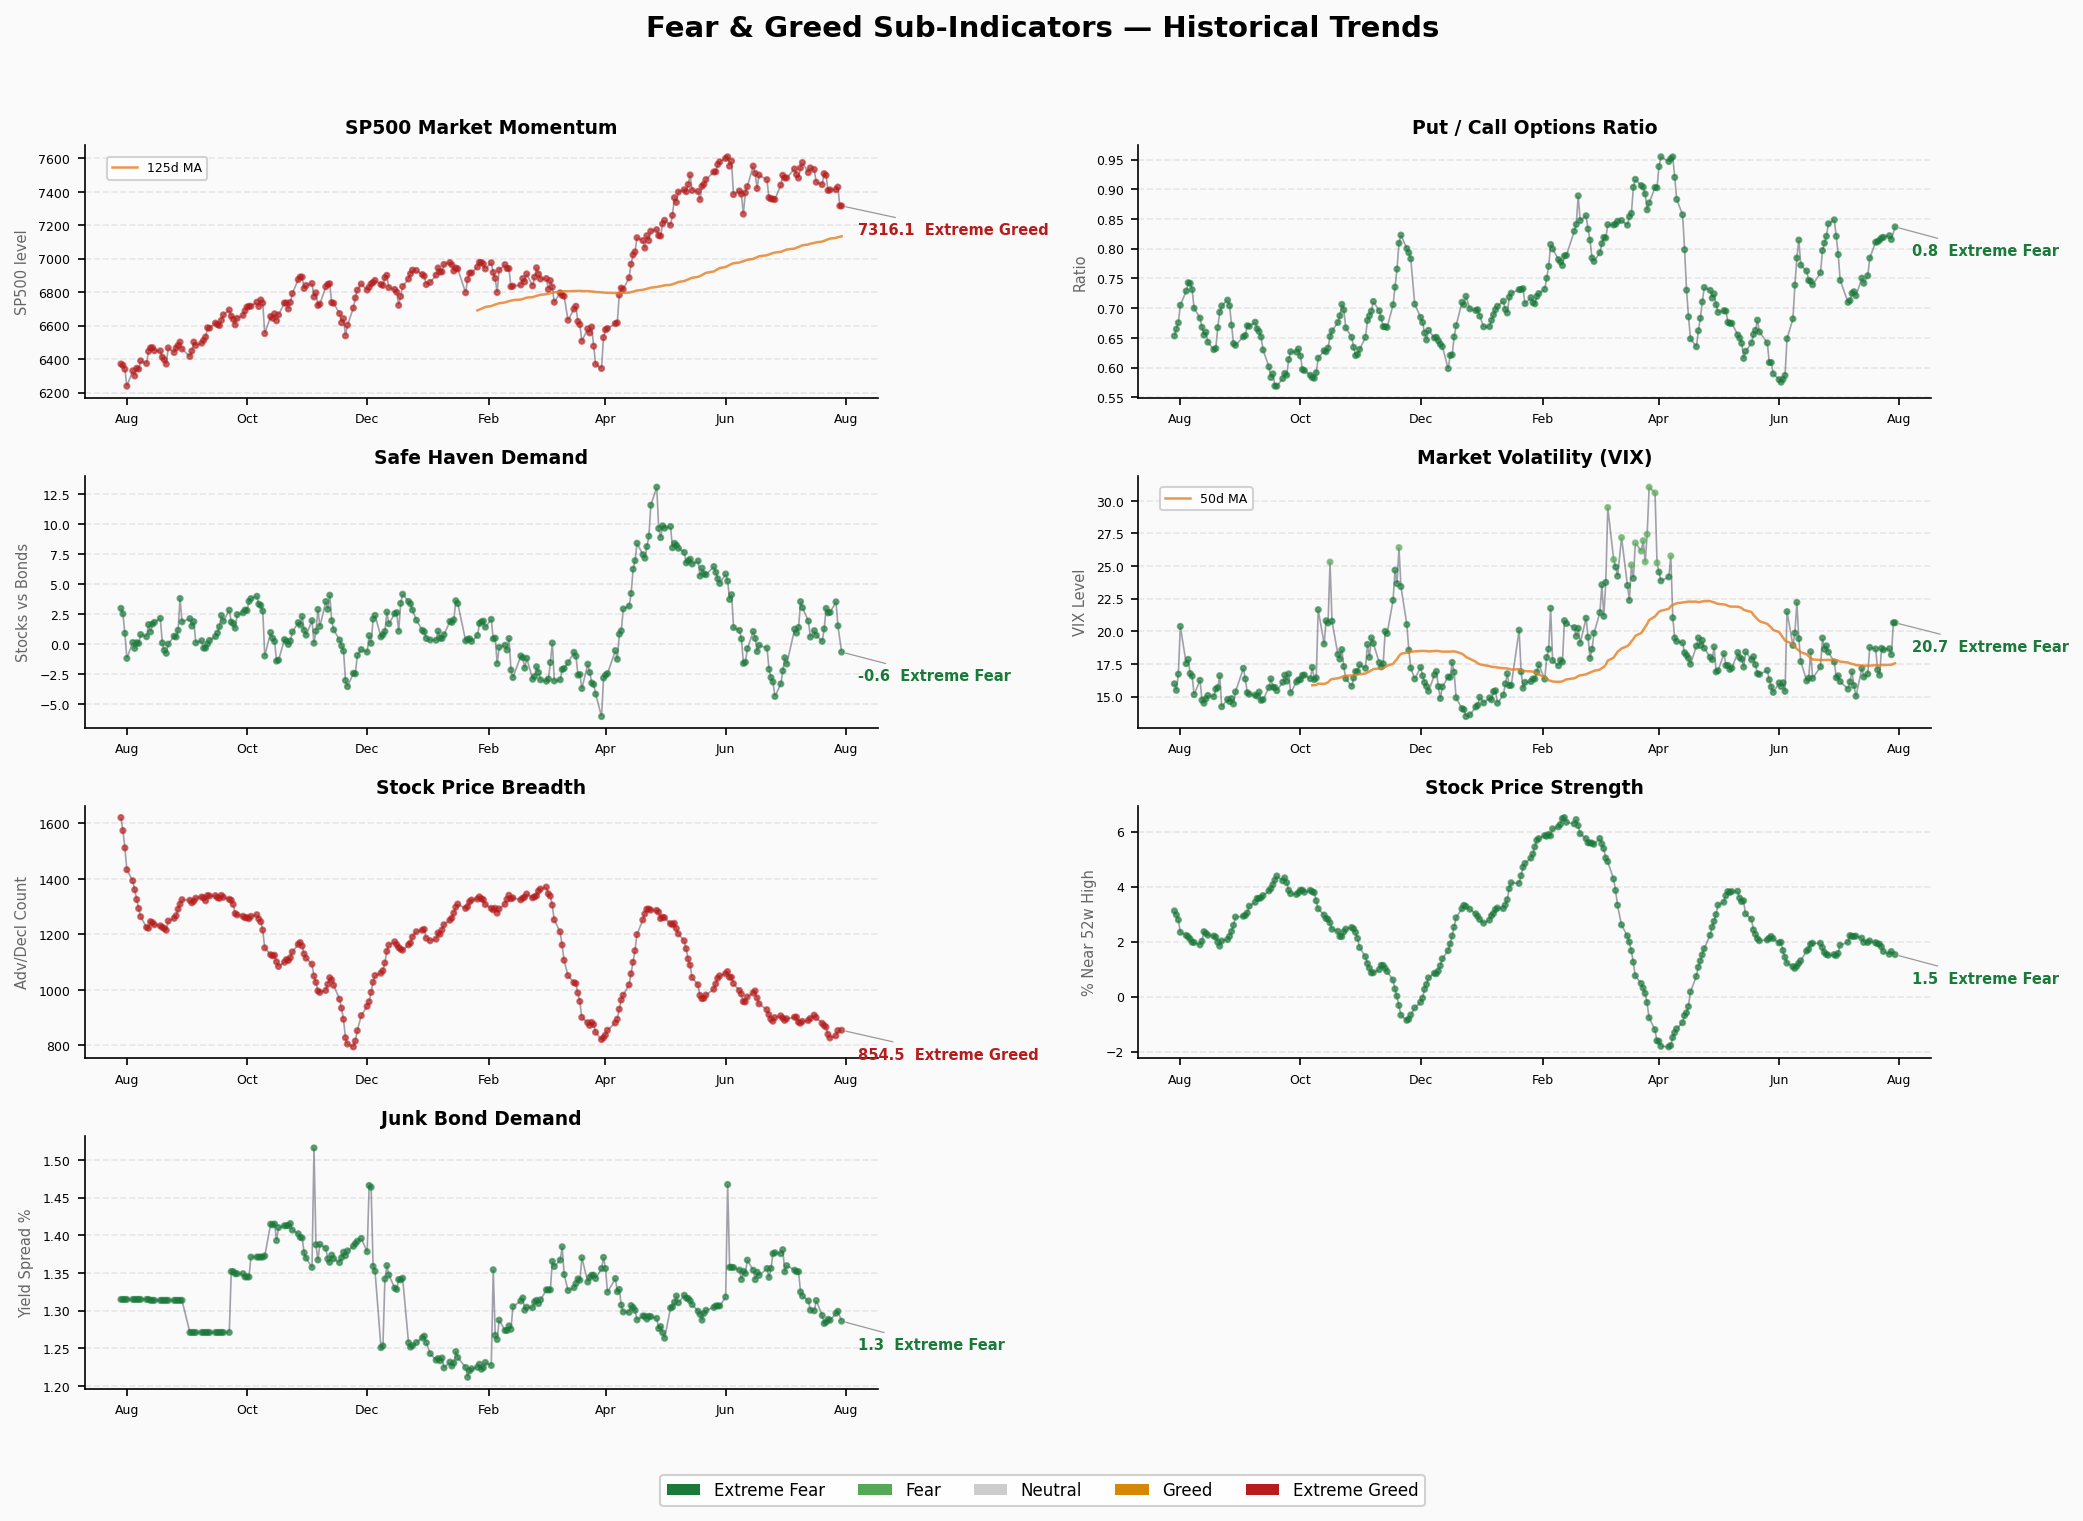
- Raw Value: S&P 500 vs 125-day MA: +1.53%
- Direction: Narrowing from prior +1.64% ▼
- Interpretation: The distance between the S&P 500 and its 125-day moving average is compressing rapidly. Momentum has been steadily deteriorating since the ~5% spread in June.
2. Stock Price Breadth — 21.0 | 🚨 Extreme Fear
- Raw Value: McClellan Volume Summation Index: 854.5
- Direction: Slight uptick from 853.3 →
- Interpretation: The only sub-indicator in Extreme Fear territory. While the raw McClellan reading is not at crisis levels, CNN’s scoring model is flagging deteriorating participation breadth — fewer stocks are driving the market higher.
3. Put/Call Options — 26.8 | 😨 Fear
- Raw Value: Put/Call Ratio: 0.837
- Direction: Rising from 0.815 ▲ (more bearish)
- Interpretation: Options market sentiment is turning increasingly defensive. The put/call ratio has been climbing, indicating traders are actively adding hedges.
4. Market Volatility (VIX) — 33.6 | 😨 Fear
- Raw Value: VIX = 20.66
- Direction: Unchanged →
- Interpretation: VIX remains above 20, firmly in Fear territory. No panic spike (>25) yet, but sustained above-20 readings signal elevated downside risk pricing.
5. Market Volatility 50-day MA — 33.6 | 😨 Fear
- Raw Value: VIX 50-day MA = 17.51
- Direction: Unchanged →
- Interpretation: The 50-day moving average continues to grind higher, confirming a regime shift from low-volatility to a moderate-to-high volatility environment.
6. Junk Bond Demand — 58.6 | 🟢 Greed
- Raw Value: Junk vs Investment-Grade Bond Spread: 1.286%
- Direction: Narrowing slightly from 1.299% ▼ (spread tightening = greed)
- Interpretation: The sole Greed signal among the seven. Credit markets continue to price risk benignly, creating a stark divergence from equity market fear. This suggests the current sell-off has not yet spilled into credit markets.
7. Safe Haven Demand — 29.6 | 😨 Fear
- Raw Value: Stock vs Treasury Relative Return: -0.637%
- Direction: Sharp reversal from +1.544% ▼▼ (stocks flipped from outperforming to underperforming)
- Interpretation: This is the most dramatic single-day move in this report. The indicator swung from +1.54% to -0.64% — a 218bp reversal — signaling that capital is rotating aggressively from equities into Treasuries.
Structural Contradiction Analysis
Core Divergence: Credit Markets vs Equity Sentiment
| Dimension | Signal | Implication |
|---|---|---|
| Junk Bond Demand | 🟢 Greed 58.6 | Credit markets see no crisis |
| Stock Price Breadth | 🚨 Extreme Fear 21.0 | Participation breadth collapsing |
| Safe Haven Demand | 😨 Fear 29.6 | Capital rotating to Treasuries |
| VIX | 😨 Fear 33.6 | Elevated vol pricing |
Extreme Values:
- Stock Price Breadth (21.0) is the only sub-indicator in Extreme Fear, having dropped sharply from the ~40 zone just last week.
- Junk Bond Demand (58.6) stands alone in Greed territory — credit spreads have not yet reflected equity market panic.
Divergence Signal: The junk bond vs. equity divergence is the most significant structural contradiction to monitor. Historically, credit spreads widening tends to lead equity bottoms. The current narrow spreads suggest either: (a) the equity fear is transitory (credit markets are correct), or (b) credit markets are about to catch down (equity fear is leading).
Trend Evolution: Over the past 10 days, the Fear & Greed Index has fallen from 43.4 to 32.3, a decline of 11.1 points. The index has been in Fear territory for approximately two weeks. If it breaks below 30 into Extreme Fear, history suggests this often marks a zone of tactical bottoms.
🚨 Crisis Precursor Dashboard
1. Credit Spreads
- HY OAS: 2.84% | 🟢 Normal/Greed
- IG OAS: N/A (FRED 502 error, data unavailable)
- Trend: Spreads at historical lows, credit markets pricing healthily
- Thresholds: <3% Normal | 3-5% Caution | 5-8% Panic | >8% Crisis
2. Yield Curve
- 10Y-2Y Spread: +45bp | 🟢 Normal (flattish)
- 10Y: 4.61% | 2Y: 4.26% | 30Y: 5.09%
- 10Y-30Y Spread: -48bp (30Y yields above 10Y, long-end steepening)
- Interpretation: Curve is not inverted but the slope is modest. The 45bp 10Y-2Y spread sits at the low end of normal. Near-term recession risk is not being priced significantly.
3. Margin Debt (FINRA)
- Latest: $1.502T (June 2026) | 🔴 All-Time High
- Prior Month: $1.416T (May) | MoM +6.1%
- YoY: +53.7% (June 2025: $978B)
- Consecutive Monthly Gains: 11 months
- Relative Metrics: Margin Debt / M2 = 5.72%, exceeding the July 2007 peak of 5.69%, approaching the March 2000 extreme of 6.42%
- Interpretation: Leverage has entered the historical danger zone. While absolute numbers are at records, the market-cap ratio (1.88%) remains near the 50-year median. The key risk: if markets continue to decline, forced margin liquidations could trigger cascading sell-offs.
4. IPO Market
- 2026 YTD: ~73 IPOs (Renaissance Capital estimate)
- Trend: Active but not yet at 2021 frenzy levels
- Interpretation: IPO count alone is not extreme, but combined with elevated valuations, risk premiums are compressed.
5. Fund Flows (ETF)
- ETF Net Inflows: 2026 H1 surpassed $1T (fastest pace ever) | 🔴 Record
- Full-Year Forecast: $2.3T (State Street), far exceeding 2025’s record $1.5T
- US Equity ETFs: H1 +$441B
- Interpretation: Retail and institutional capital continues to pour in at a record pace — FOMO is not yet exhausted. However, historical patterns show record inflows often coincide with market tops.
Composite Assessment
| Indicator | Status |
|---|---|
| Credit Spreads (HY OAS) | 🟢 Normal |
| Yield Curve (10Y-2Y) | 🟢 Normal |
| Margin Debt | 🔴 All-Time High |
| ETF Fund Flows | 🔴 Record |
| Market Sentiment (FNG) | 🟡 Fear |
2 🟢 / 1 🟡 / 2 🔴
Summary: Credit markets and the yield curve have not yet sounded alarms, but leverage levels (margin debt) and retail participation (ETF flows) are at historic extremes. Combined with the FNG sentiment index rapidly sliding from Greed to Fear, the market is in a dangerous configuration of “high leverage + deteriorating sentiment.” If the S&P 500 continues to decline and triggers margin call cascades, H2 2026 could face a more severe deleveraging process than 2022.