CNN Fear & Greed Index Analysis 2026-07-29
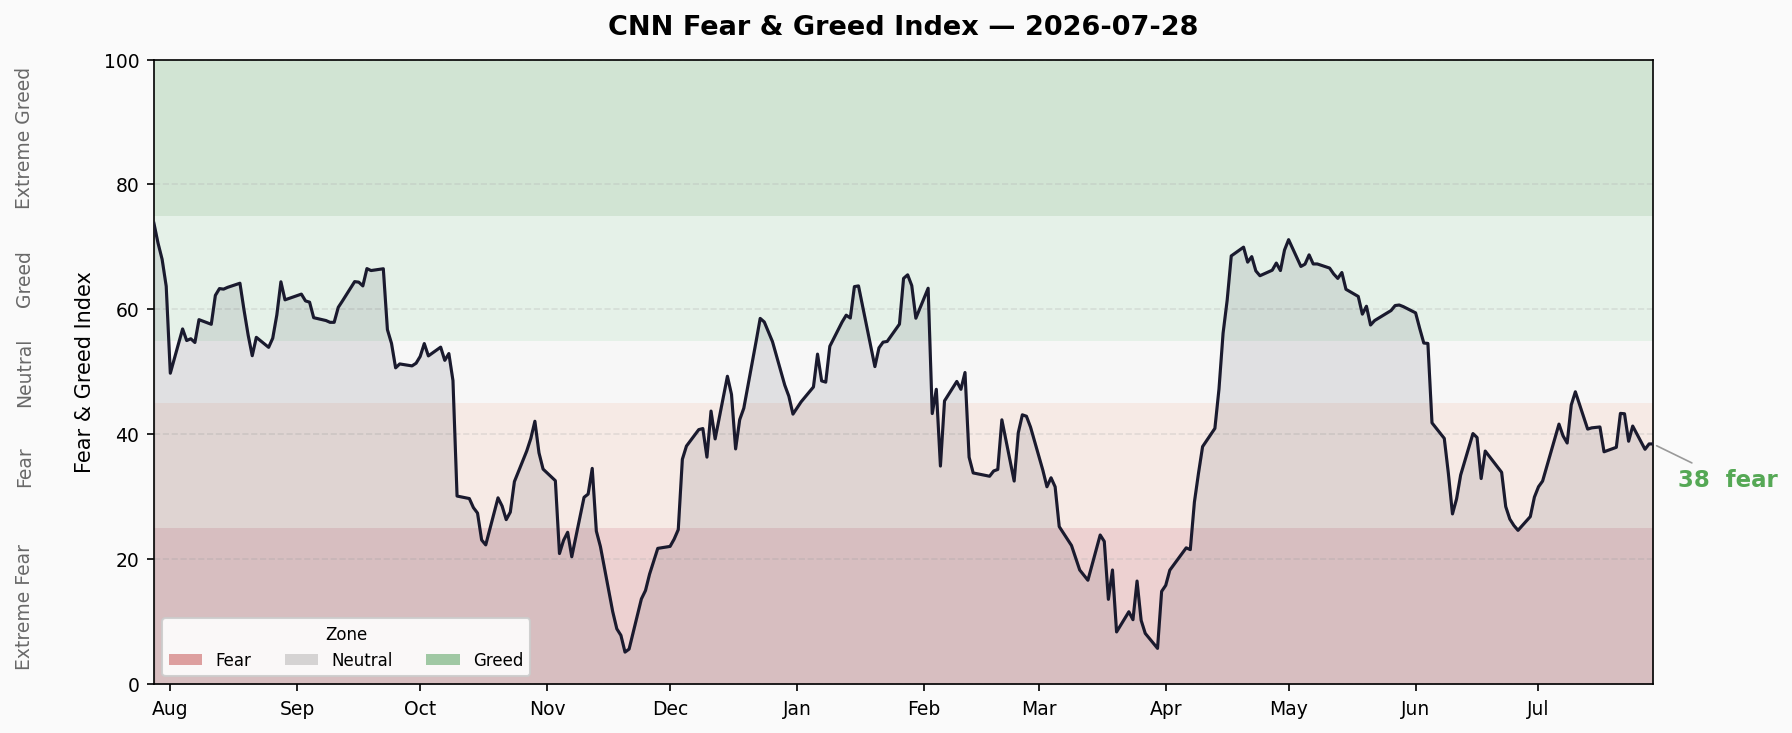
CNN Fear & Greed Composite at 38.49 (Fear), down from 39.94 previous close. 4 of 7 sub-indicators in Fear/Extreme Fear territory, 3 Neutral, zero Greed. Crisis Precursors: 3 🟢 / 0 🟡 / 3 🔴 — record margin debt and fund inflows, but credit spreads and yield curve remain normal.
CNN Fear & Greed Composite
| Metric | Value |
|---|---|
| Latest Composite | 38.49 — Fear |
| Previous Close | 39.94 — Fear |
| Daily Change | -1.46 |
| 1 Week Ago | 43.37 |
| 1 Month Ago | 24.66 |
| 1 Year Ago | 73.80 — Greed |
The composite has declined from 43.37 a week ago to 38.49, spending 7 consecutive sessions in Fear territory. A month ago the index was at 24.66 (near Extreme Fear), rebounded to ~43, and is now weakening again — a classic “failed bounce” pattern.
Sub-Indicator Scan
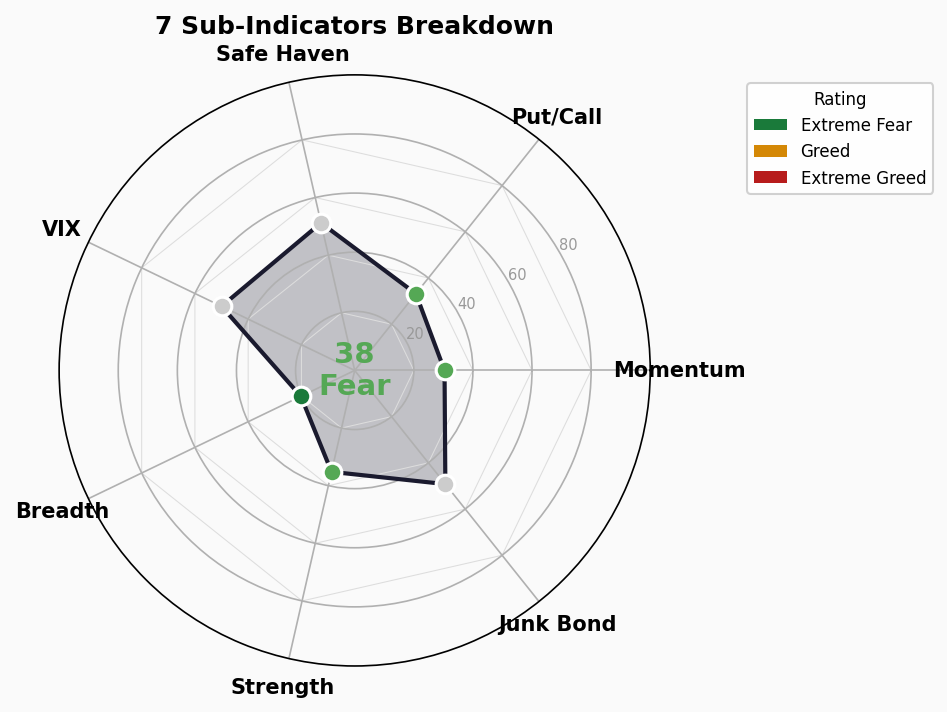
1. Market Momentum — 30.4 Fear
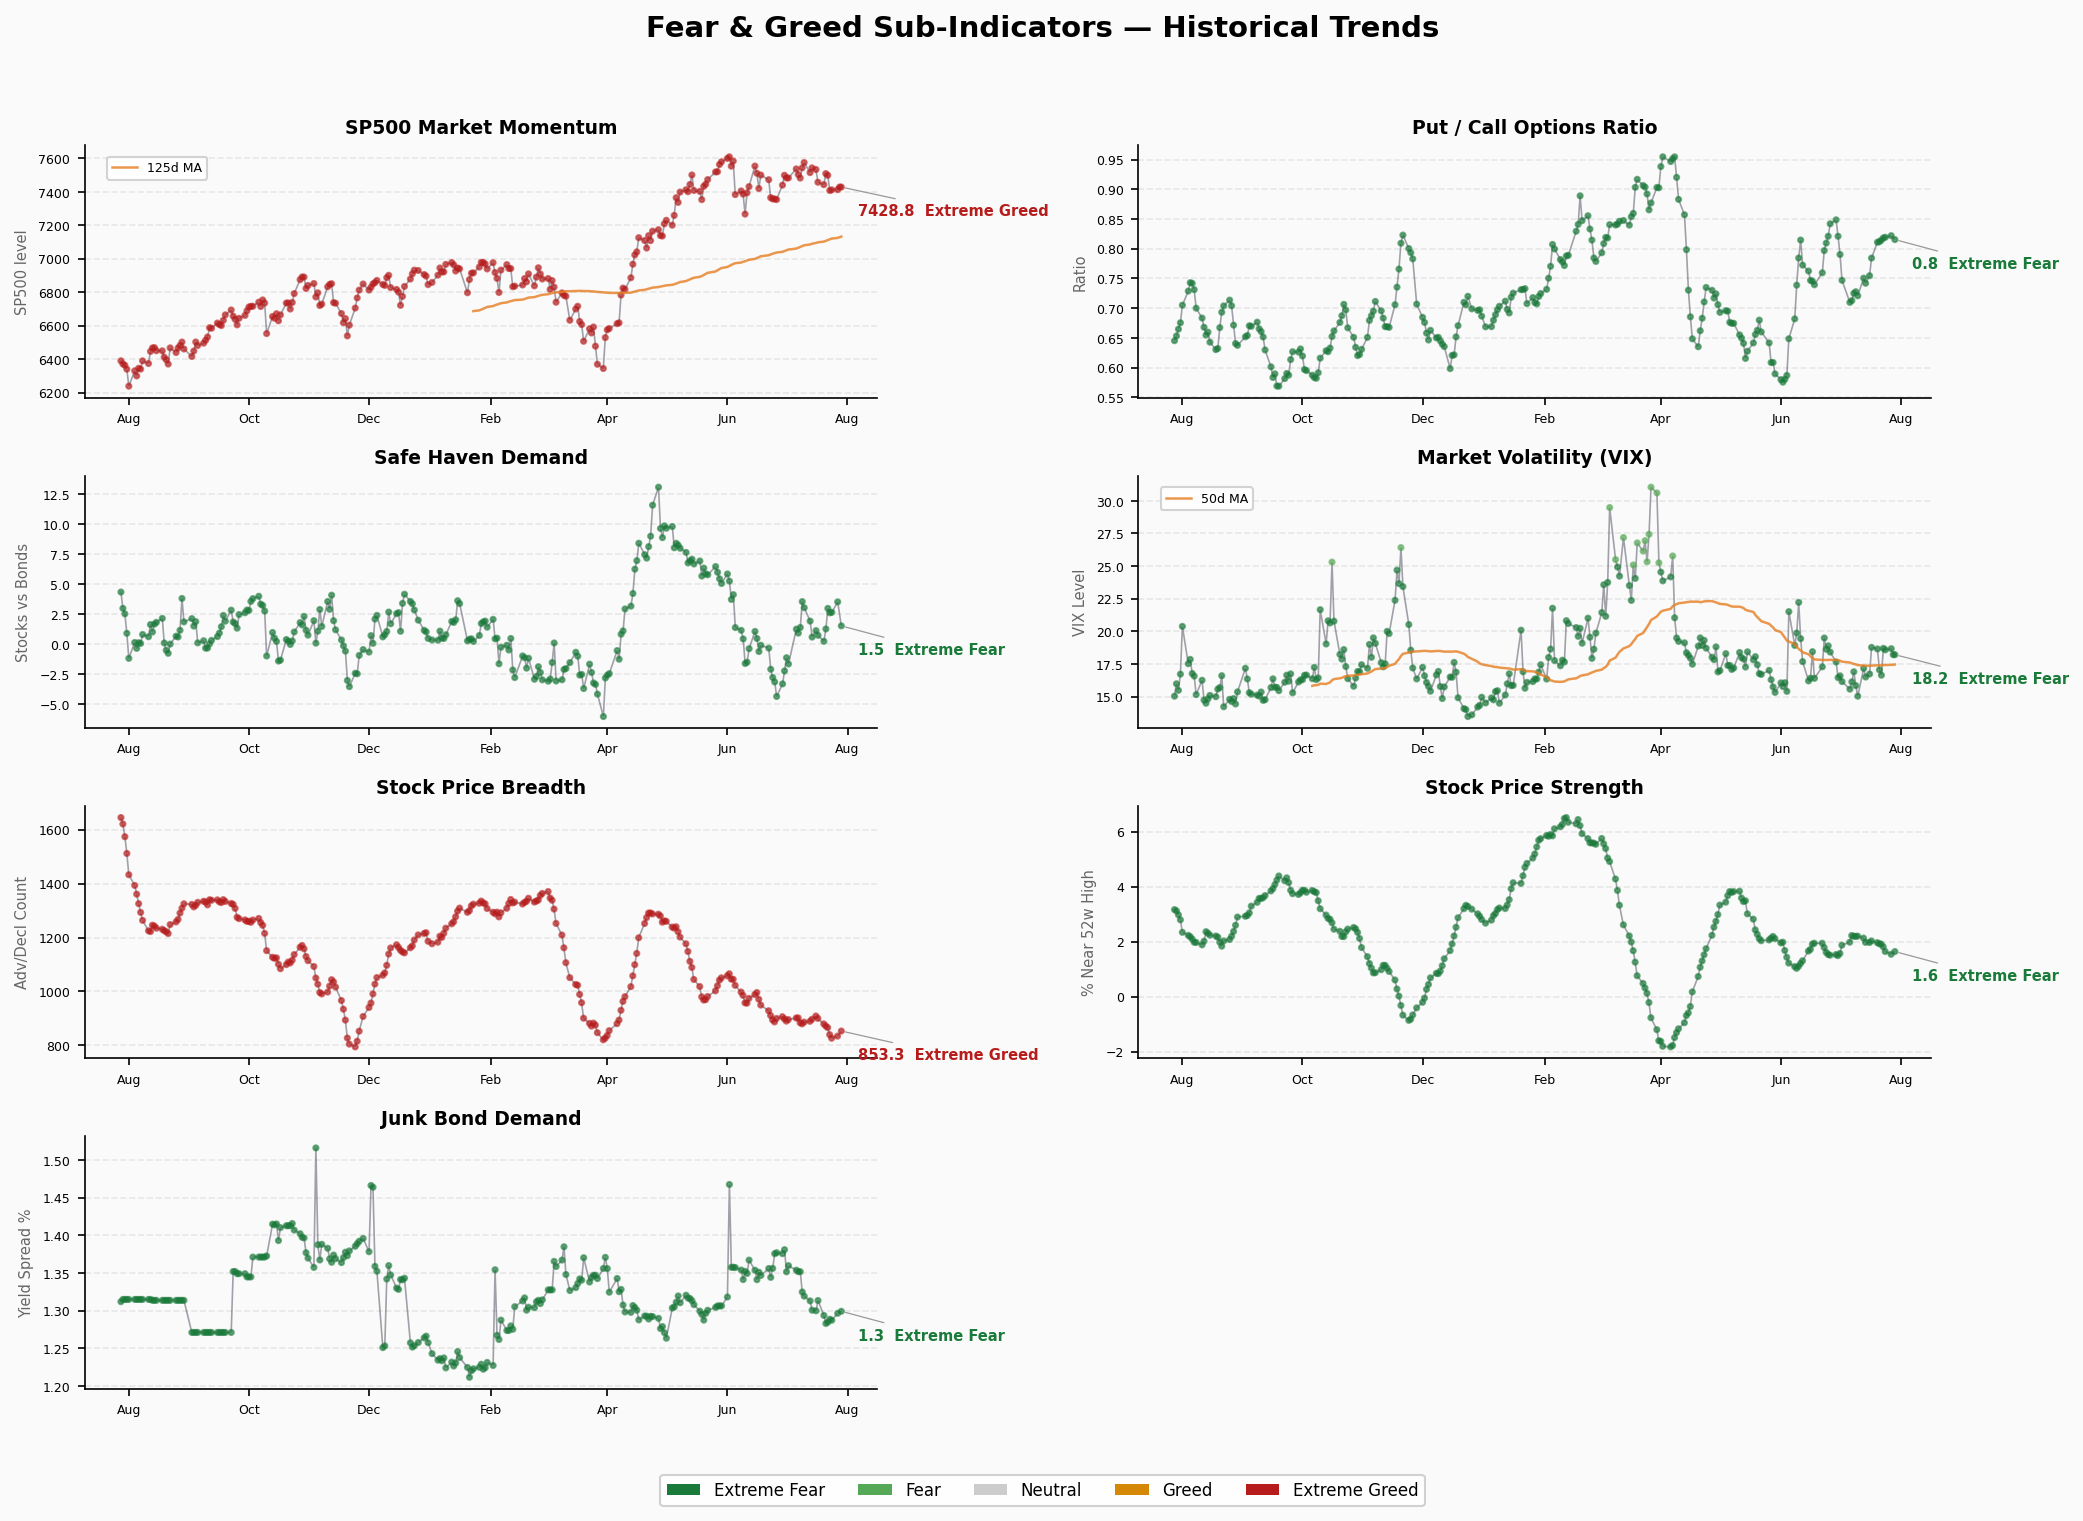
S&P 500 at 7,428.78, still above its 125-day moving average (raw reading: Extreme Greed), but momentum score has fallen to Fear. The index remains elevated but upward momentum is clearly decelerating.
2. Stock Price Strength — 35.2 Fear
52-week high/low ratio at 1.64, in Extreme Fear raw territory. Last three sessions: 1.65 → 1.54 → 1.64, stuck at the bottom. New lows far outnumber new highs.
3. Stock Price Breadth — 20.2 Extreme Fear ⚠️
McClellan Volume Summation Index at 853.31 (raw: Extreme Greed), yet CNN scores it at only 20.2 (Extreme Fear). This is the most bearish sub-indicator — gains are concentrated in a handful of mega-caps while market participation is dangerously narrow.
4. Put/Call Options — 33.2 Fear
Put/Call ratio at 0.82, stable in Extreme Fear raw territory for multiple sessions. Options market remains defensively positioned.
5. Market Volatility — 50.0 Neutral
VIX at 18.21, VIX 50-day MA at 17.44. Both in neutral range. No panic, but no excitement either.
6. Safe Haven Demand — 51.2 Neutral
Stock vs. bond relative performance at 1.54, dropping sharply from 3.54 and 2.67 in prior sessions. Capital is rotating from equities to Treasuries — risk-off sentiment is building.
7. Junk Bond Demand — 49.2 Neutral
High-yield vs. investment-grade spread at 1.30%, stable. Credit markets show no stress signals but also no risk appetite.
Structural Contradictions
⚠️ Core Contradiction: Index Highs vs. Internal Divergence
The S&P 500 sits at 7,400+, but Breadth scores just 20.2 — the lowest of all seven indicators. This reveals a dangerous structure: the index is propped up by a few mega-cap tech names while most stocks are already declining.
Specifically:
- Price Strength 35.2 + Breadth 20.2 → Classic “stealth bear market” pattern. Few new highs, many new lows, invisible at the index level.
- Momentum 30.4 + Elevated Index → Decelerating momentum at highs = bearish divergence. If the S&P 500 can’t break higher soon, further momentum decay will trigger a larger correction.
- VIX 50 + Safe Haven 51.2 → Both neutral-to-defensive. The VIX isn’t spiking — this isn’t a panic sell-off, it’s an orderly capital rotation out of equities.
📊 Score Distribution
| Range | Count | Indicators |
|---|---|---|
| Extreme Greed (≥80) | 0 | — |
| Greed (60-79) | 0 | — |
| Neutral (40-59) | 3 | VIX, Safe Haven, Junk Bond |
| Fear (25-39) | 3 | Momentum, Price Strength, Put/Call |
| Extreme Fear (<25) | 1 | Breadth |
4 of 7 indicators in fear territory, zero in greed. This is “fear born from highs.”
Trend Assessment
- 7 consecutive Fear sessions, composite sliding from 43 to 38 with no bottoming signal
- 24.66 → 43 → 38: Pattern resembles a “bear flag” consolidation
- Breadth is the leading indicator — without Breadth recovering first, the composite won’t return to Greed
- Key watchpoints: S&P 500 holding 7,400; Breadth stabilizing
🚨 Crisis Precursor Dashboard
1. Credit Spreads
- HY OAS: 2.81% | 🟢 Normal (threshold: <3%)
- IG OAS: 0.81% | 🟢 Normal (threshold: <1%)
- Trend: Credit spreads at low levels, no stress signals
- Data as of: 2026-07-27
2. Yield Curve
- 10Y-2Y Spread: +35bp | 🟢 Normal (slightly flat)
- 2Y: 4.31% | 30Y: 5.12% | 10Y: N/A (FRED error)
- Interpretation: Positive but flat curve. Elevated 2Y at 4.31% reflects sustained high-rate environment.
3. Margin Debt (FINRA)
- Latest: $1.502T (June 2026) | 🔴 All-Time High
- Prior Month: $1.416T (May 2026)
- YoY: +63% ($920.96B in June 2025)
- Trend: Margin debt hitting consecutive records, +$86B MoM. Leverage at extreme levels — a market pullback could trigger forced liquidation cascades.
4. IPO Market
- 2026 YTD: 86 IPOs, $251B raised (Renaissance Capital, late July) | 🔴 Overheated
- Comparison: 2025 full-year $47.4B, 2024 full-year $33B
- Note: SpaceX alone accounted for $85.7B. Anthropic and OpenAI have filed. The IPO window is wide open with record proceeds — a classic late-cycle signal.
5. ETF Inflows
- 2026 YTD: $1.03T net inflows (ETFGI, end of June) | 🔴 Record
- Forecast: State Street projects $2.3T full-year
- Note: Half-year inflows already surpassing 2025’s full-year record of $1.5T. Inflow velocity is unprecedented.
Composite: 3 🟢 / 0 🟡 / 3 🔴
| Signal | Status | Meaning |
|---|---|---|
| Credit Spreads | 🟢 Normal | Bond market not pricing recession |
| Yield Curve | 🟢 Normal-Flat | No inversion but high rates persist |
| Margin Debt | 🔴 Record High | Extreme leverage = correction amplifier |
| IPO Market | 🔴 Overheated | Classic cycle-top signal |
| ETF Inflows | 🔴 Record | Retail/passive chasing highs |
Key Contradiction: Credit markets (spreads, curve) are entirely normal, but capital flows (margin, IPOs, ETFs) are hitting records across the board. This combination has appeared multiple times at bull market peaks — credit is a lagging indicator while flows are coincident/leading. $1.5T margin debt + $251B IPOs + $1.03T ETF inflows all at simultaneous records was last seen in 2000 and 2021.
Warning: The FNG composite bouncing from Extreme Fear a month ago and now weakening again, combined with extreme flow data, suggests the current environment resembles a “final blow-off” more than a healthy consolidation.