CNN Fear & Greed Analysis 2026-07-27
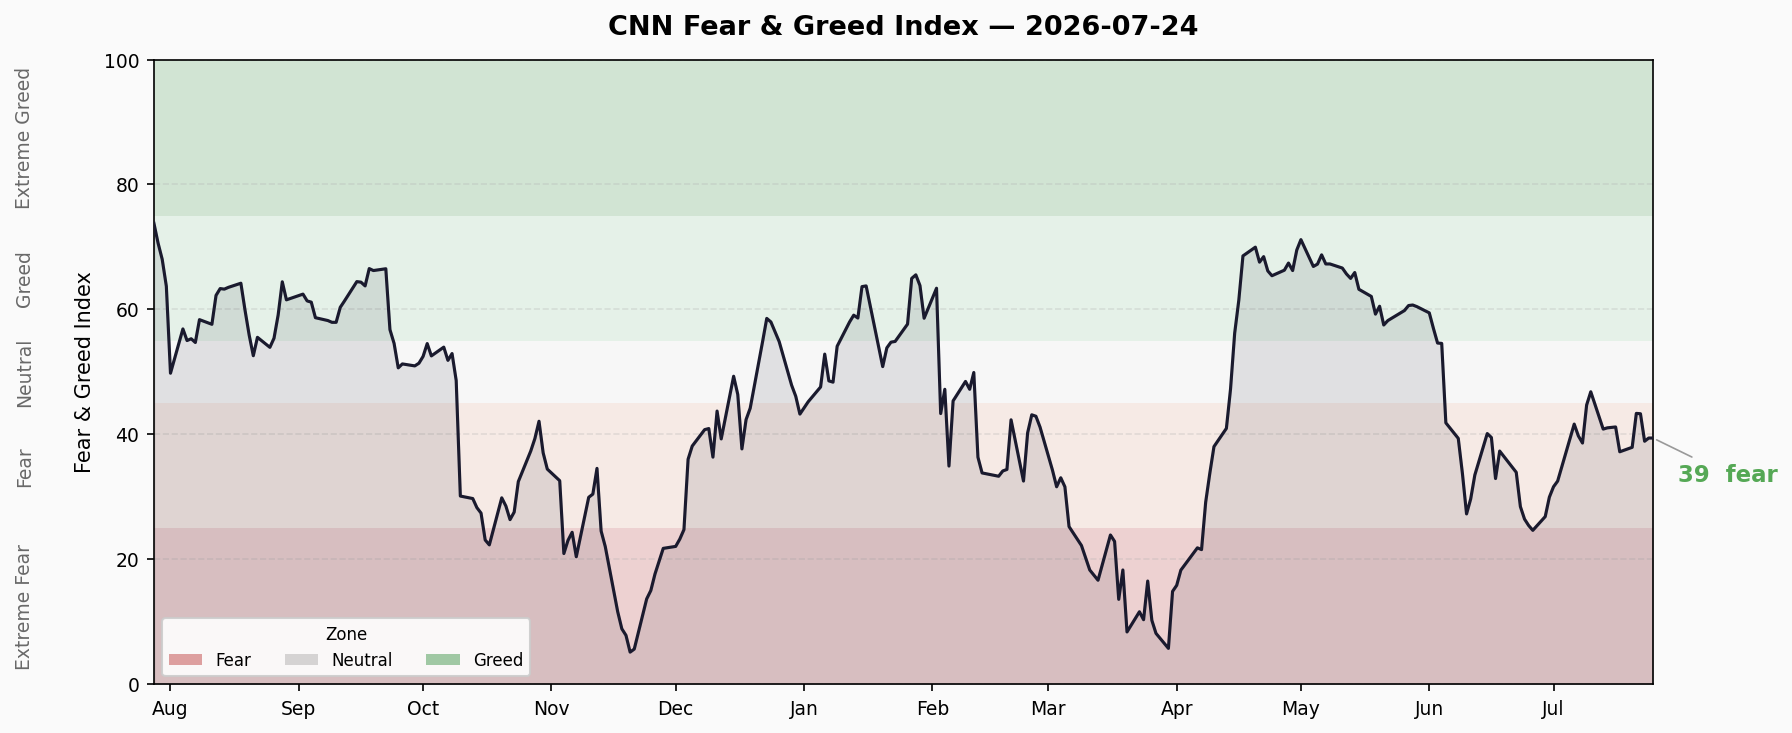
CNN Fear & Greed Index composite score 39.43, in Fear territory. 7 sub-indicators show significant divergence: Stock Price Breadth at Extreme Fear (14), Safe Haven Demand at Greed (63.4). Crisis Precursor Dashboard: 3🟢 0🟡 2🔴, credit spreads normal but margin debt and ETF inflows at historic extremes.
📊 Composite Index
| Metric | Value |
|---|---|
| Latest | 39.43 — Fear |
| Previous Close | 39.60 |
| Daily Change | -0.17 |
| 1 Week Ago | 37.23 |
| 1 Month Ago | 26.46 |
| 1 Year Ago | 75.26 (Greed) |
Trend Assessment
The Fear & Greed composite has been in the Fear zone for approximately 2 weeks, oscillating sideways in the 37–43 range over the last 10 trading sessions with no clear directional breakout. After rebounding from 26.46 (near Extreme Fear) one month ago, it has settled into consolidation.
Time in Zone: 11 consecutive trading days in Fear (since July 13). Last Neutral reading was July 10 (46.8).
Directional Signal: Sideways consolidation. Daily change negligible (-0.17), lacking momentum to break above Neutral (45+) or retest Extreme Fear (<25). The market is in a state of “fear within uncertainty.”
🔍 Sub-Indicator Breakdown
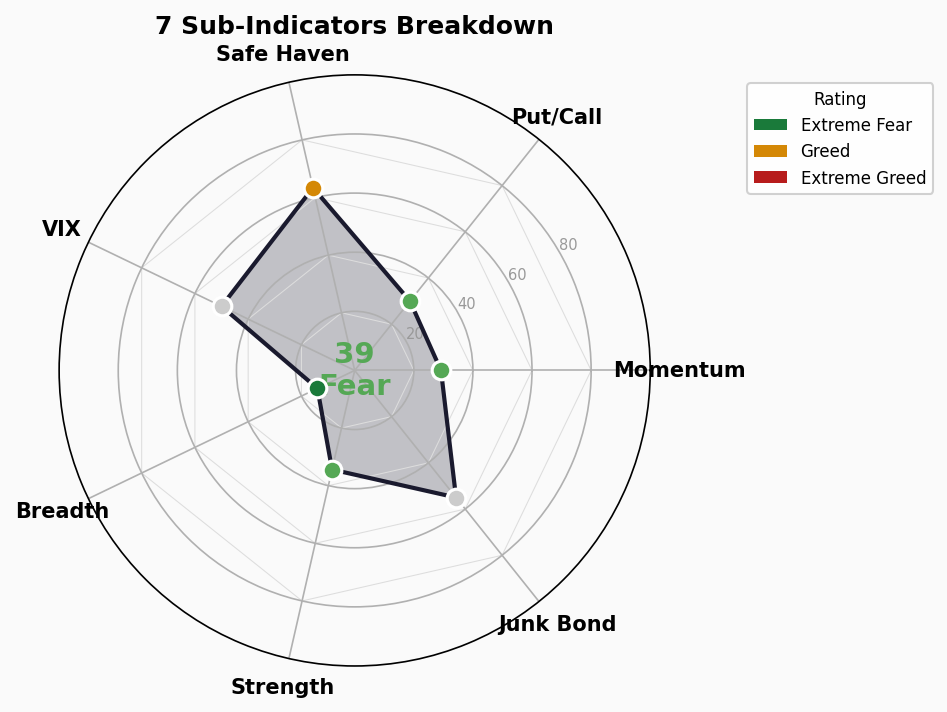
| # | Indicator | Score | Rating | Raw Value | Direction |
|---|---|---|---|---|---|
| 1 | Stock Price Strength | 34.4 | Fear | SPX vs 125MA = 1.646 | — |
| 2 | Market Momentum (52W H/L) | 29.2 | Fear | 52W H/L = 7,121 | — |
| 3 | Stock Price Breadth | 14.0 | ⚠️ Extreme Fear | McClellan = 826.6 | — |
| 4 | Put/Call Options | 30.0 | Fear | P/C Ratio = 0.819 | — |
| 5 | Market Volatility (VIX) | 50.0 | Neutral | VIX = 18.58 | — |
| 6 | Junk Bond Demand | 55.0 | Neutral | HY/IG Spread = 1.29 | — |
| 7 | Safe Haven Demand | 63.4 | Greed | Stocks/Bonds = 2.67 | — |
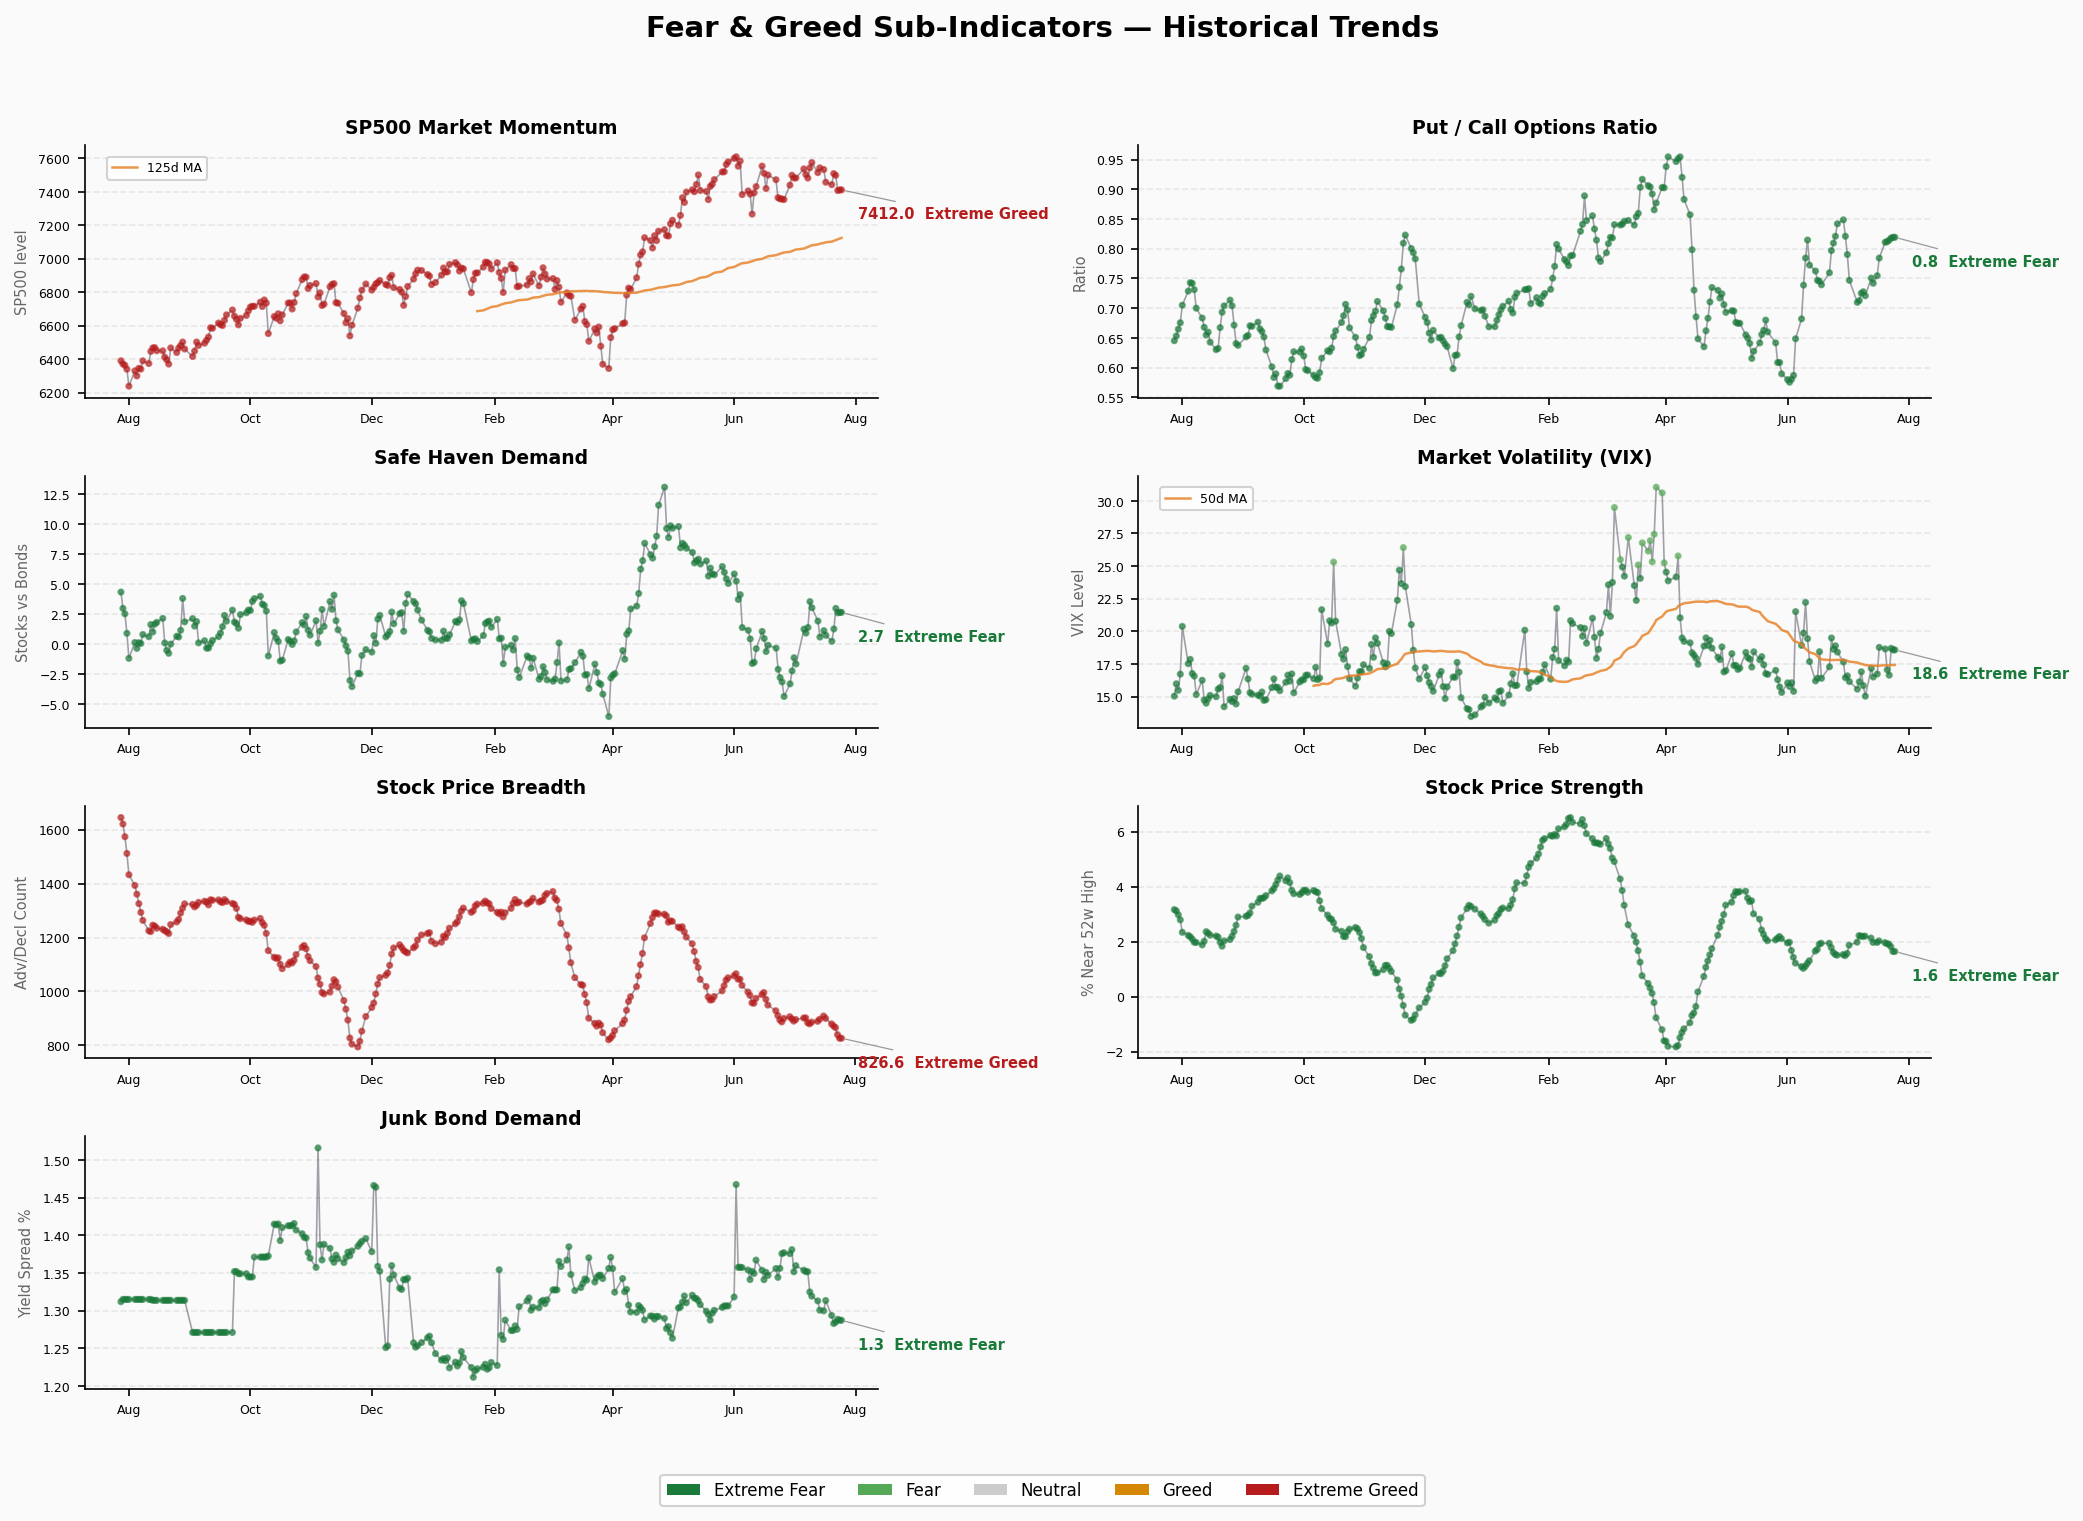
Note: Sub-indicator data based on July 24 (Friday) close. Weekend data unchanged. “—” indicates flat vs prior session.
Detailed Commentary
Stock Price Strength (34.4 / Fear) — SPX premium over its 125-day moving average is approximately 64.6%. While the premium is not small, CNN’s normalized scoring places it in Fear territory, reflecting recent momentum deceleration. SPX is consolidating around 7,400 after pulling back from highs.
Market Momentum 52W H/L (29.2 / Fear) — NYSE 52-week highs vs lows comparison. The reading in Fear territory indicates a limited number of stocks hitting new 52-week highs, with market breadth insufficient to support a full bull narrative.
Stock Price Breadth (14.0 / Extreme Fear) ⚠️ — The most extreme indicator this session. McClellan Volume Summation Index at only 14 points, deep in Extreme Fear. This means advancing volume on up days is far outweighed by declining volume on down days. The market’s internal structure is weakening. This is the most noteworthy warning signal.
Put/Call Options (30.0 / Fear) — P/C ratio at 0.819, in Fear territory. Elevated put volume relative to calls reflects increased hedging demand.
Market Volatility VIX (50.0 / Neutral) — VIX at 18.58, squarely in neutral territory. Volatility has not entered panic levels (>25) nor excessive complacency (<12). This is the most “normal” indicator currently.
Junk Bond Demand (55.0 / Neutral) — High-yield to investment-grade spread at approximately 1.29 percentage points. Neutral-to-tight, indicating the credit market has not yet priced in distress. Credit investors remain willing to take risk.
Safe Haven Demand (63.4 / Greed) — Stocks’ excess return over bonds at 2.67x. Investors continue to prefer equities over safe-haven assets, a Greed signal. This forms a stark divergence with Breadth’s Extreme Fear.
⚡ Structural Divergence Analysis
Key Divergence: Breadth vs Safe Haven
The most significant structural contradiction this session is the massive gap between Stock Price Breadth (14 / Extreme Fear) and Safe Haven Demand (63.4 / Greed).
- Breadth at 14 means the vast majority of volume is concentrated in declining stocks — market width is severely deteriorating
- Safe Haven at 63.4 means capital is still pouring into equities over bonds — risk appetite is not low
Interpretation: This is the classic “large-cap clustering” structure. A handful of mega-cap/weight heavy stocks are propping up the indices, while a large number of small and mid-cap stocks are bleeding out. SPX itself hasn’t dropped significantly (around 7,412), but the market is undergoing silent internal differentiation.
Other Observations
- VIX 50 (Neutral) misalignment with overall Fear 39: Volatility hasn’t spiked, suggesting this is not panic selling but slow erosion of confidence
- Junk Bond 55 (Neutral): Credit markets have not priced in recession risk, disconnected from equity sentiment
- Put/Call 30 (Fear): Hedging demand elevated but not at panic levels
Extreme Value Alerts
| Indicator | Score | Level |
|---|---|---|
| Stock Price Breadth | 14 | ⚠️ Extreme Fear (<20) |
Only Breadth sits in the extreme zone; all other indicators range between 29–63. The concentration of extreme values is low — systemic risk has not yet formed a resonance pattern.
🚨 Crisis Precursor Dashboard
1. Credit Spreads
| Indicator | Value | Status |
|---|---|---|
| High-Yield OAS | 2.77% | 🟢 Normal |
| Investment-Grade OAS | 0.79% | 🟢 Normal |
- Thresholds: HY <3% Normal / 3–5% Caution / 5–8% Panic / >8% Crisis
- Data as of: 2026-07-23 (ICE BofA via FRED)
- Assessment: Credit spreads are at historically low levels. Neither high-yield nor investment-grade spreads show signs of widening. Credit market participants are calm — this is the strongest “no-crisis” signal.
2. Yield Curve
| Indicator | Value | Status |
|---|---|---|
| 10Y-2Y Spread | +36bp | 🟢 Normal-flat |
| 10Y Yield | 4.71% | — |
| 2Y Yield | 4.37% | — |
| 30Y Yield | 5.17% | — |
| 10Y-30Y Spread | -46bp | Inverted |
- Assessment: The 10Y-2Y spread is positive (+36bp), the short end is not inverted, suggesting near-term recession fears are not acute. However, the 10Y-30Y is inverted (-46bp), with the long end yielding less than the belly, reflecting weak confidence in long-term economic growth.
3. Margin Debt (FINRA)
| Indicator | Value | Status |
|---|---|---|
| Margin Debt | $1.304T (Apr 2026) | 🔴 All-Time High Range |
- Assessment: FINRA margin debt is at historically extreme levels. High margin debt alone is not a crash signal, but once the market turns, the deleveraging process amplifies declines. This is the sword of Damocles hanging over the market.
4. IPO Market
| Indicator | Value | Status |
|---|---|---|
| 2026 YTD IPOs | ~73 (Renaissance Capital) | 🟡 Active, not euphoric |
- Assessment: IPO count is at a healthy level without the euphoria of 2021. However, combined with ETF inflow data, capital is flooding into equity markets at scale.
5. Fund Flows
| Indicator | Value | Status |
|---|---|---|
| 2026 YTD ETF Net Inflows | $856B | 🔴 Record High |
- Assessment: ETF net inflows are at all-time records, reflecting both retail and institutional investors continuing to allocate aggressively to equities. Record inflows amid Fear sentiment is a divergence worth noting — either the capital is right (buying the dip successfully) or sentiment indicators are leading the capital turn.
📋 Summary Dashboard
| Category | 🟢 Normal | 🟡 Caution | 🔴 Danger |
|---|---|---|---|
| Credit Spreads | 2 | 0 | 0 |
| Yield Curve | 1 | 0 | 0 |
| Margin Debt | 0 | 0 | 1 |
| IPO / Fund Flows | 0 | 0 | 1 |
| Total | 3 | 0 | 2 |
Overall Assessment: 3 green, 2 red. Credit markets and the yield curve are not emitting crisis signals — this is the most important bottom support. The red flags are concentrated in the “capital overheating” dimension (margin debt + ETF inflows), characteristic of late-cycle exuberance rather than systemic risk. The most critical dynamic to monitor is the divergence between FNG Breadth at Extreme Fear and continued record capital inflows — this typically precedes a market style rotation or internal adjustment, not a full-scale crash.